


All Issues
Efficacy of selenium supplementation methods in California yearling beef cattle and resulting effect on weight gain
Publication Information
California Agriculture 70(4):187-193. https://doi.org/10.3733/ca.2016a0016
Published online November 16, 2016
NALT Keywords
Abstract
Selenium (Se) deficiency occurs commonly in California grazing cattle and has been associated with reduced immune function and, in some studies, reduced weight gain. Multiple methods of supplementing Se are available, but little research has compared the effects of these methods on whole blood Se levels and weight gain. In two trials, we evaluated four methods of Se supplementation — an intrarumenal bolus, two injectable preparations and a loose salt containing 120 ppm Se — over an 85- to 90-day period in Se-deficient yearling cattle in Tehama County. The bolus treatment raised whole blood Se levels to an adequate level (0.08 ppm) for the entire study period. Whole blood Se concentrations in injected cattle initially reached adequate levels but then declined to deficient levels. The loose salt treatment acted slowly, with average whole blood Se concentration reaching adequate levels at the end of the study period. None of the treatments significantly affected weight gain and Se blood concentration was not correlated with weight gain. In growing cattle, it appears that Se supplementation may be viewed not as a direct driver of weight gain, but rather as similar to vaccination, in that it can prevent health problems that might otherwise lead to reduced weight gain.
Full text
Selenium (Se) deficiency in California livestock species is widespread and is estimated to exist in excess of 60% of herds in the state (Dunbar et al. 1988; Williams 1980). Se is an essential nutrient for all animals, including cattle (NRC 1996). The importance of correcting Se deficiencies is well documented. Adequate Se levels have been found to boost immunity, thereby reducing mortality, diarrhea and increasing disease resistance in cattle (Arthur et al. 2003; Gerloff 1992; Maas 1983; Salles et al. 2014; Spears et al. 1986).
Soils with low concentrations of Se are the primary cause of plants providing limited Se levels to cattle in forage (NRC 1996). Methods of increasing forage Se concentrations through the use of soil amendments have been successful in providing adequate Se in forage to cattle (Ajwa et al. 1998). Currently, the use of fertilizers containing Se is not legal in California, leaving direct supplementation of livestock the only method to alleviate Se deficiency. The difficulty facing California livestock producers is determining the most appropriate supplementation strategy that fits their particular operation.
Se injections are a common method of supplementing deficient cattle. Research has found this can be an effective supplementation method, though its effective adequacy period has not been found to last for more than 45 days (Genther and Hansen 2014; Maas et al. 1993). The use of an intraruminal time release bolus has been demonstrated as a safe, long-term Se supplementation strategy (Hemingway et al. 2003; Maas et al. 1994; Sprinkle et al. 2006).

Results from two trials suggest that a selenium rumen bolus can maintain adequate levels of whole blood selenium throughout the study period, whereas the benefits of selenium injections do not last as long.
The U.S. Food and Drug Administration allows a maximum dietary supplement of 3 milligrams per head (mg/head) per day in cattle diets. This is the equivalent of 120 parts per million (ppm) of Se added to a salt supplement mixture that is formulated for consumption of one ounce per head per day. The use of free-choice salt-mineral mixes as a method of Se supplementation has limited research, but in some cases has been found to bring Se to adequate levels (Patterson et al. 2013). Results can be variable due to individual animal intake, varying pasture conditions and climatic conditions such as temperature, precipitation and season. Research quantifying Se status from herds that are provided salt-based supplements is necessary, especially in California conditions, as this is one of the most common methods of supplementation used by California livestock managers.
Unlike immune responses, weight gain and feed efficiency differences between Se-supplemented and -deficient cattle have been variable, with some studies finding significant improvement in supplemented cattle (Del Claro et al. 2013; Johnson et al. 1979; Nelson and Miller 1987; Perry et al. 1976; Spears et al. 1986), while others have not observed significant differences (Albaugh et al. 1967; Cozzi et al. 2011; Jenkins and Hidiroglou 1986; Nicholson et al. 1993; Salles et al. 2014; Swecker et al. 2008). In light of these varying results, current information specific to California conditions is needed to help quantify weight gain differences between Se-deficient and -adequate cattle.
We evaluated both the efficacy of Se supplementation methods and yearling cattle weight gain associated with whole blood Se levels. To our knowledge, these two trials are one of the only evaluations of both different supplement methods and their effect on increasing whole blood Se levels and the subsequent influence on yearling cattle weight gains. Specifically, trial 1 included treatments of a 15-mg/head Se injection (MU-SE), a 25-mg/head Se injection (Multimin) and an intrarumenal bolus against a control group. Trial 2 monitored the effectiveness of a loose salt-based supplement compared to an intrarumenal bolus positive control and true negative control groups.
Study site
The study site for the two trials was a commercial cattle ranch in Cottonwood (Tehama County), California. Herd whole blood and forage sampling prior to the trial showed the site to be a Se-deficient irrigated pasture. Cottonwood has a typical Mediterranean climate with cool wet winters and warm dry summers. The perennial irrigated pastures are grazed from early spring to late fall and rested in the winter rainy season when cattle are hauled to winter annual rangeland. The soil is an Arbuckle gravelly loam formed in alluvial materials from mainly conglomerate and metasedimentary rocks (USDA 2014). Vegetation consisted of dallisgrass (Paspalum dilatatum), tall fescue (Schedonorus arundinaceus), ryegrass (Lolium spp.), bermudagrass (Cynodon dactylon) and white clover (Trifolium repens), with a minor weed component including smartweed (Polygonum lapathifolium), sedge (Cyperus difformis) and mint (Mentha pulegium). The trials were conducted using the same pastures in both 2011 and 2013. Since the pastures are perennial, the composition did not vary largely between years.
Cattle
Trials 1 and 2 consisted of preconditioned weaned steers with an average starting weight of 643 pounds (range 488–824 pounds) in 2011, and an average of 551 pounds (range 325–760 pounds) in 2013. Though not a purebred herd, the ranch has used strictly Angus genetics for many years, categorizing the research steers as Black Angus cattle.
Whole blood sampling
Although liver biopsy is the most preferred sampling method, whole blood sampling for Se has been found to be an accurate and less invasive tool for the assessment of Se status of cattle (Kirk et al. 1995; Pavlata et al. 2001). Unlike other trace minerals, serum has not proven reliable compared to whole blood testing of Se (Maas et al. 1992).
In both trials, collection of whole blood for Se testing was completed using EDTA tubes. Samples were submitted to the California Animal Health and Food Safety laboratory at UC Davis for testing. Samples of the cattle were tested prior to trial initiation to confirm deficiency, conduct stratification, and to make certain there was not a large variance in the herd level.
For sample interpretive purposes, whole blood sample results were placed into four groups that described the mineral level status. The groups were classified as severely deficient at levels of 0–0.050 ppm, marginally deficient at 0.051–0.080 ppm, adequate at 0.081–0.160 ppm and highly adequate at 0.161 ppm or more (Dargatz and Ross 1996).
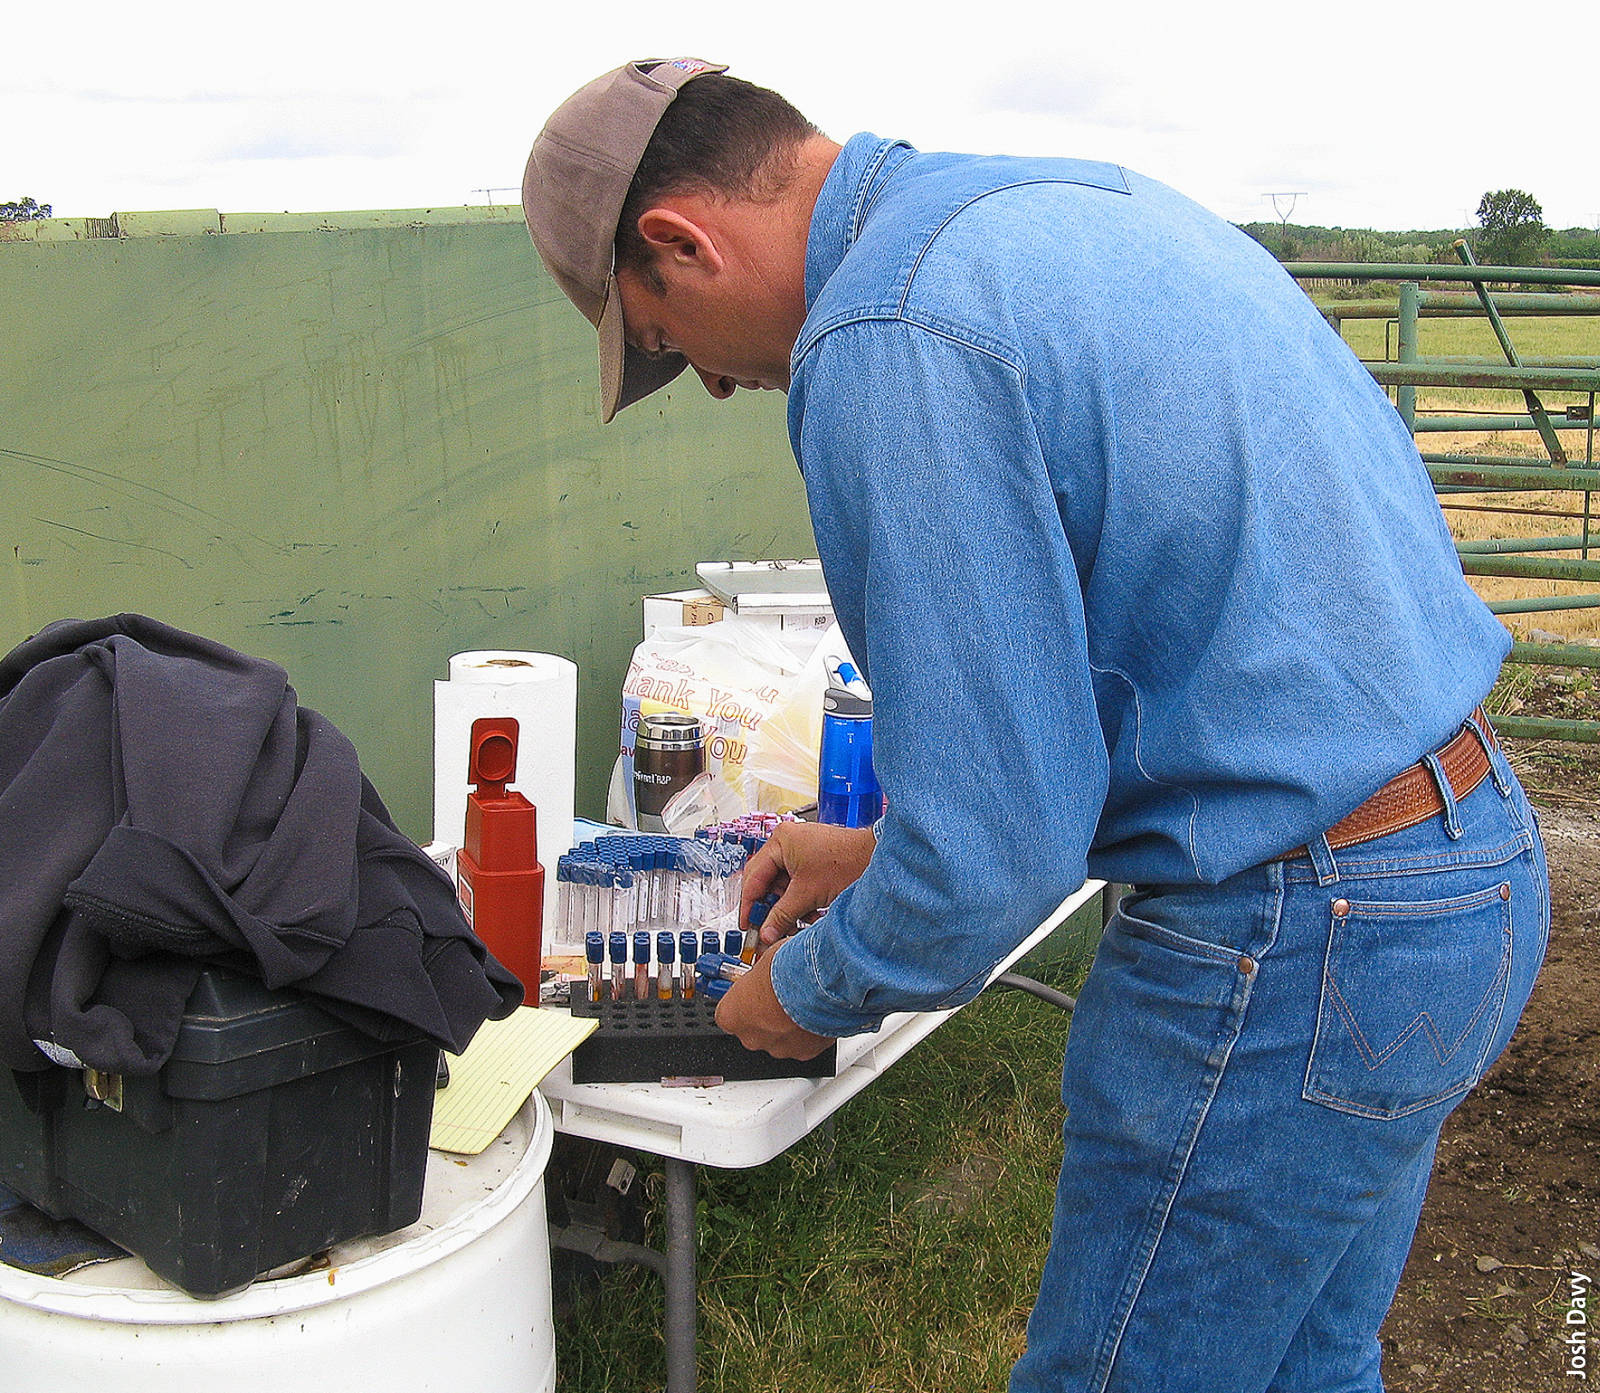
Farm Advisor Josh Davy sorting and processing blood samples to send to the lab for analysis.
Trial 1 methods (2011)
In the 2011 trial, 80 individually identified steers were stratified into four groups of 20 head each. Stratification was completed by creating four weight groups starting with the lightest 20 cattle in group one and continuing in ascending order to group four. Equal numbers of each stratification group were randomly assigned to each treatment. Analysis of variance confirmed that no difference in weight existed between treatments prior to treatment initiation.
The trial began on July 25, 2011. Treatments included 3 cc of a 5-mg/ml injection of sodium selenite (MU-SE, Merck Animal Health, Madison, New Jersey) (15 mg Se/head), a 5-cc injection of a 5-mg/ml sodium selenite in a mixture of zinc oxide, manganese carbonate and copper carbonate (Multimin 90, Multimin, Fort Collins, Colorado) (25 mg Se/head), a Se oral bolus (Se365 Se bolus, Pacific Trace Minerals, Sacramento, California) designed to release not more than 3 mg/head/day, and an untreated control group. Both injections of Se were performed subcutaneously. The two rates were based off of label recommendations of competing Se injection products commonly used for supplementing cattle.
Body weight for each animal was recorded at 30-day intervals for 90 days following treatment initiation. Whole blood Se samples were collected on day 30 and again on day 90 after treatment initiation. All treatment groups were combined in the same pasture throughout the trial.
Trial 2 methods (2013)
The second trial, which began May 28, 2013, built on the previous trial by focusing on loose salt as a supplement source. This trial evaluated the ability of a loose salt mixture to raise deficient cattle to a status of adequate. As in trial 1, we sought to determine whether differences in Se status would affect yearling steer weight gains. Forty-eight steers were placed in a salt-supplemented treatment group with free access to a sodium selenite-based Se supplement at a concentration of 120 ppm. Six positive control steers were given a Se bolus and six negative control steers were given no treatment. The positive control cattle were given a bolus because the 2011 trial had shown it to be a treatment that had the ability to raise and maintain whole blood Se throughout the trial period.
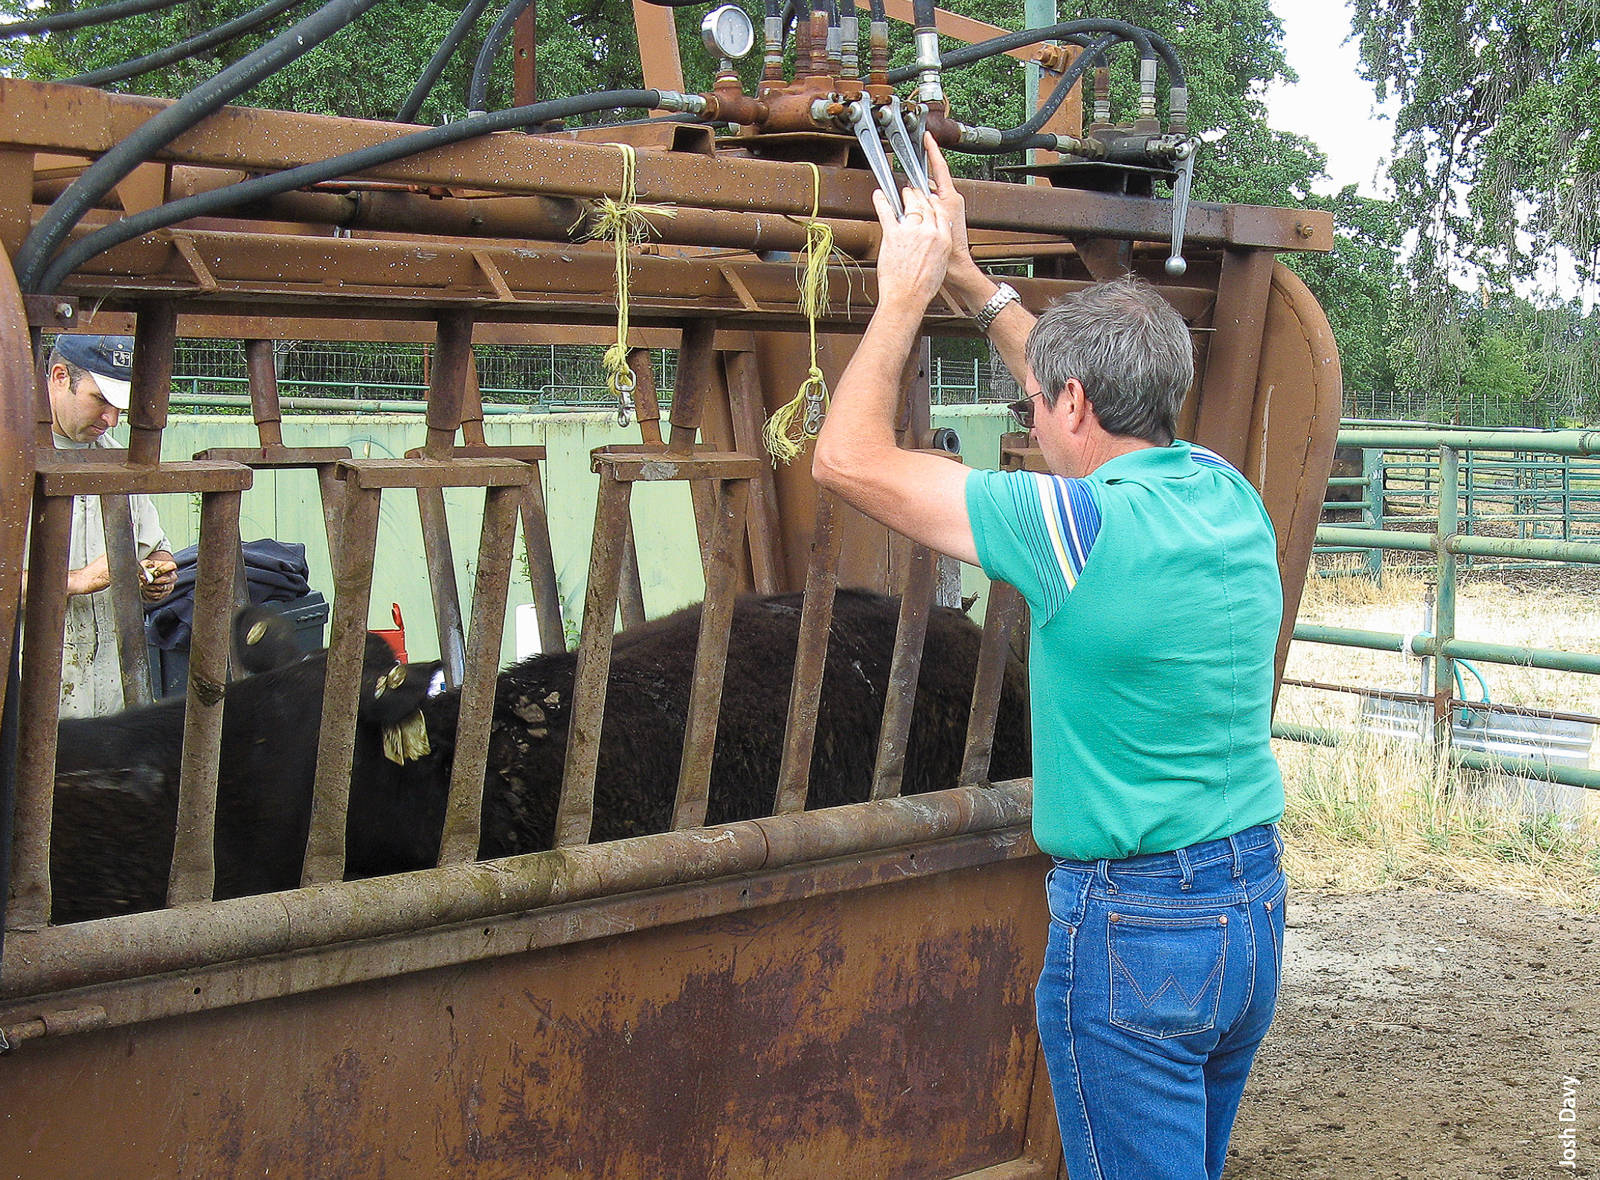
Farm Advisor Larry Forero processing cattle in the squeeze chute.
Both the positive and negative control steers were placed in an adjacent pasture to the loose salt-supplemented steers to prevent access to the supplement. Stratification was completed in the same manner as for trial 1 except that two weight groups and three Se groups within weight groups were used. Weight gain and whole blood sampling of all cattle occurred on day zero and four subsequent 21-day intervals.
The control and treated pastures were also sampled on the same dates as the cattle. In cross-pasture transects that reached from one corner of each pasture to the other, six equally spaced individual points were sampled in order to obtain a representation of the grazing area. Each sampling point recorded pasture composition, standing biomass, forage quality, mineral content and plant height. Pasture composition was recorded as basal cover of plant species present in a one-square-foot frame.
Once composition and average plant height was recorded, the samples were clipped to ground level, dried to 100% drymatter, weighed and then split in half for submission of forage quality and mineral content analysis. Forage quality analysis was conducted by Dairy One forage laboratory in Ithaca, New York, and the forage mineral content was analyzed by the California Animal Health and Food Safety laboratory at UC Davis. The process was repeated in each field at the same sampling date.
Statistical analysis
To analyze weight gain, both trials were run separately using multiple analyses of variance for average daily gain and whole blood Se level. Categorical variables included treatment, date, their interactions and a covariate of the individual animal identification (when applicable) using Statgraphics Centurion (StatPoint 2009). Covariates including initial weight and Se level were run, but were omitted because they were not significant in the model (P > 0.05). Mean separation was completed using least square means at the 0.05 level. Pearson product moment correlations were run for both forage species to Se forage content, and Se whole blood level to weight gain. Se level graphing used 95% least significant difference bars to present true treatment differences. To depict weight gain, both trials were graphed expressing cumulative average daily gain with 95% confidence intervals in Minitab (Minitab Inc. 2013). Likewise, whole blood Se levels are depicted graphically using Minitab.
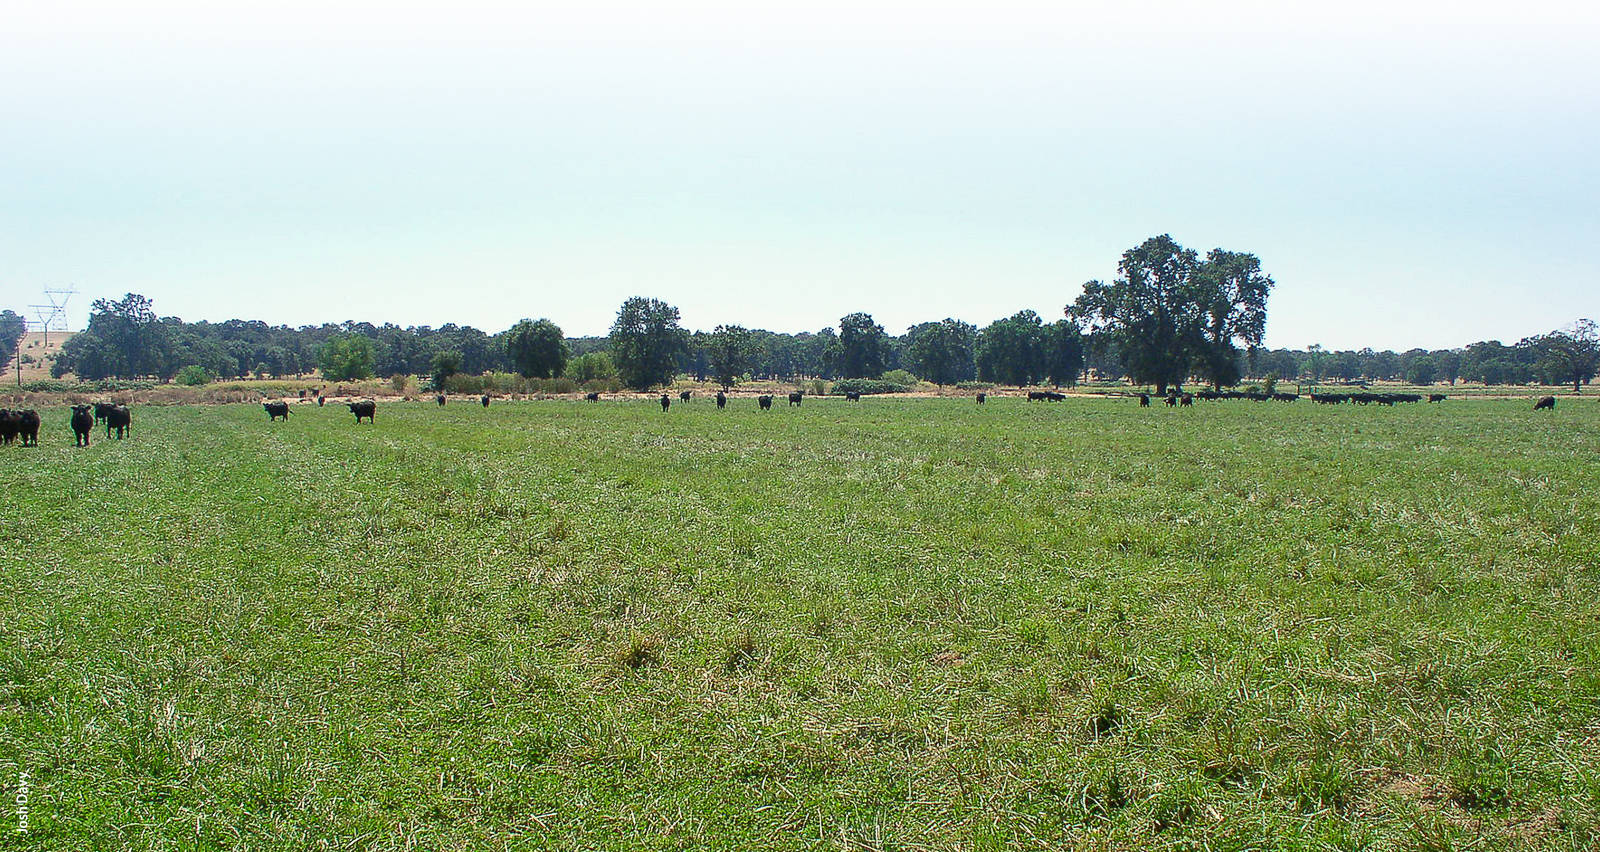
Cattle grazed free-choice on irrigated pasture during both trials.
Trial 1 results
Cattle that received some type of Se treatment generally reached the adequate level of 0.08 ppm whole blood Se at 31 days post treatment (fig. 1). Although the lower dose Se injection (MU-SE) crossed the 0.08-ppm level, it also did not differ from the control (P > 0.05). The higher dose Se injection (Multimin) and Se bolus were significantly higher in whole blood Se than both the lower dose Se injection and the control (P < 0.05, respectively), though they were not different from each other at 30 days posttreatment (P > 0.05).

Fig. 1. Se whole blood levels (ppm) with 95% confidence intervals based on treatment and sample date for trial 1, 2011.
At 90 days posttreatment, the only Se supplement that remained at an adequate whole blood level was the Se bolus treatment. The control Se blood levels dropped between 30 and 90 days posttreatment, indicating that the grazed pasture was deficient in Se, though forage samples were not completed in this trial. The control treatment at day 90 was severely deficient in whole blood Se. Both Se injection treatments were significantly lower than they were on day 90 compared to day 30 (P < 0.05, respectively), and fell between marginally and severely deficient.
Trial 2 results
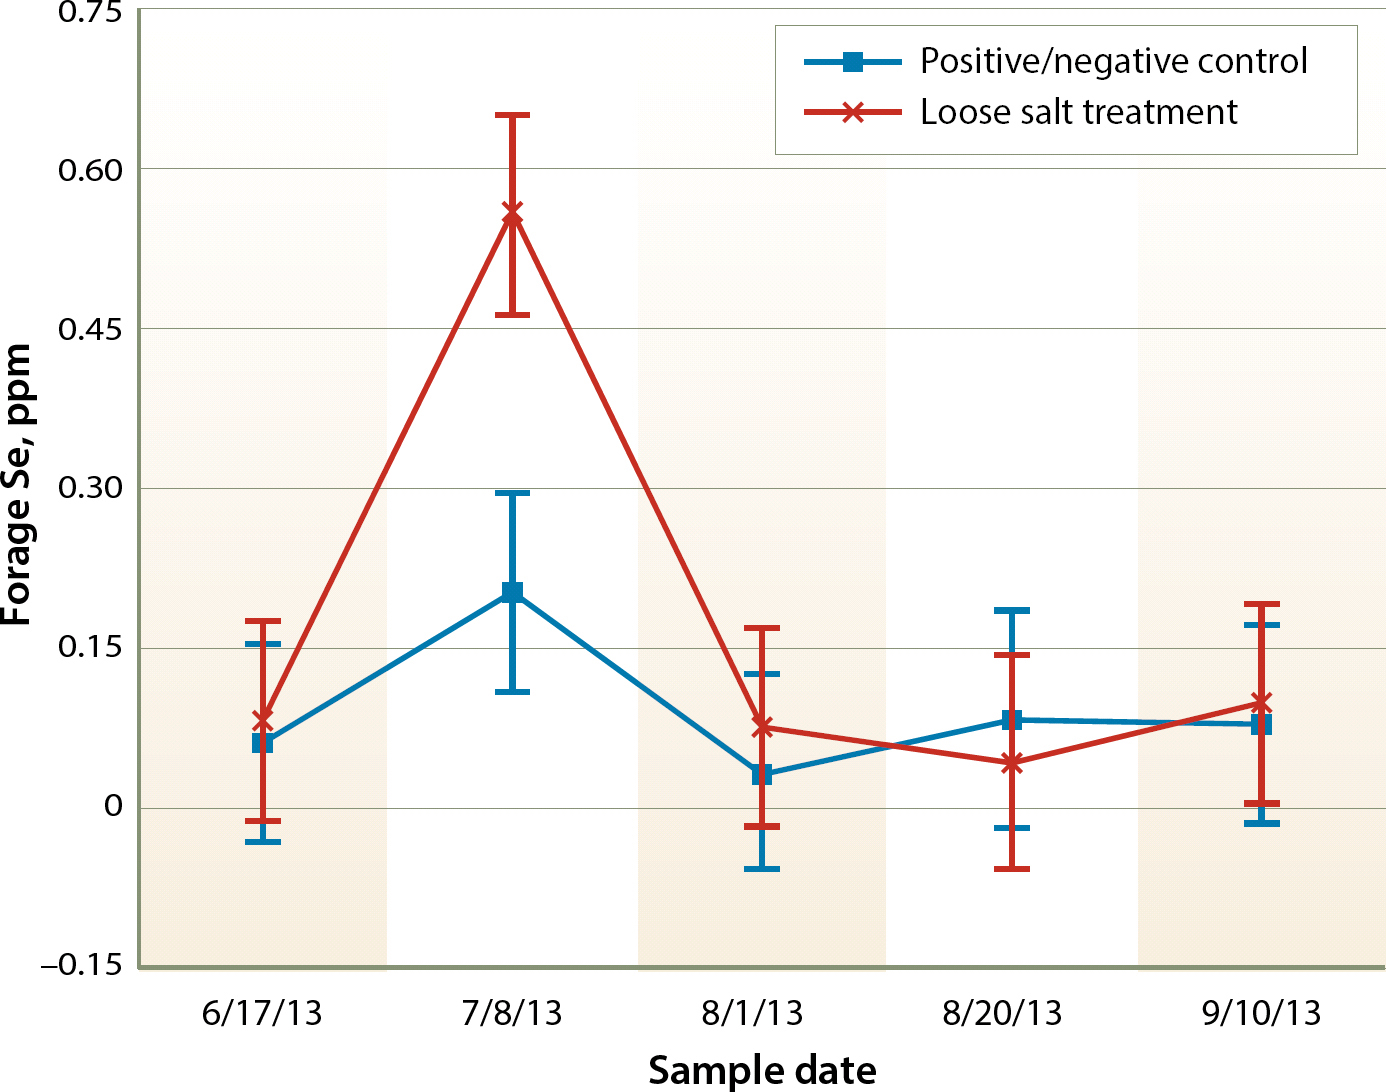
All of the steers in trial 2 began the trial deficient in Se, and most would be considered severely deficient (fig. 2, 6/17/13). As seen in trial 1, the positive control steers that were treated with a Se bolus were adequate in whole blood Se at the first sampling posttreatment (7/8/13) and remained adequate for the duration of the trial. The negative control steers that were not supplemented remained below adequate levels throughout the trial. The loose salt treatment group significantly had higher whole blood Se levels in the first sampling after treatment initiation (P < 0.05). Se levels remained constant between first and second samplings after treatment initiation (P > 0.05). In the third sampling after treatment (8/20/13), whole blood Se levels decreased, but then actually significantly rebounded, reaching adequate levels in the fourth and final posttreatment sampling of the project (P < 0.05).
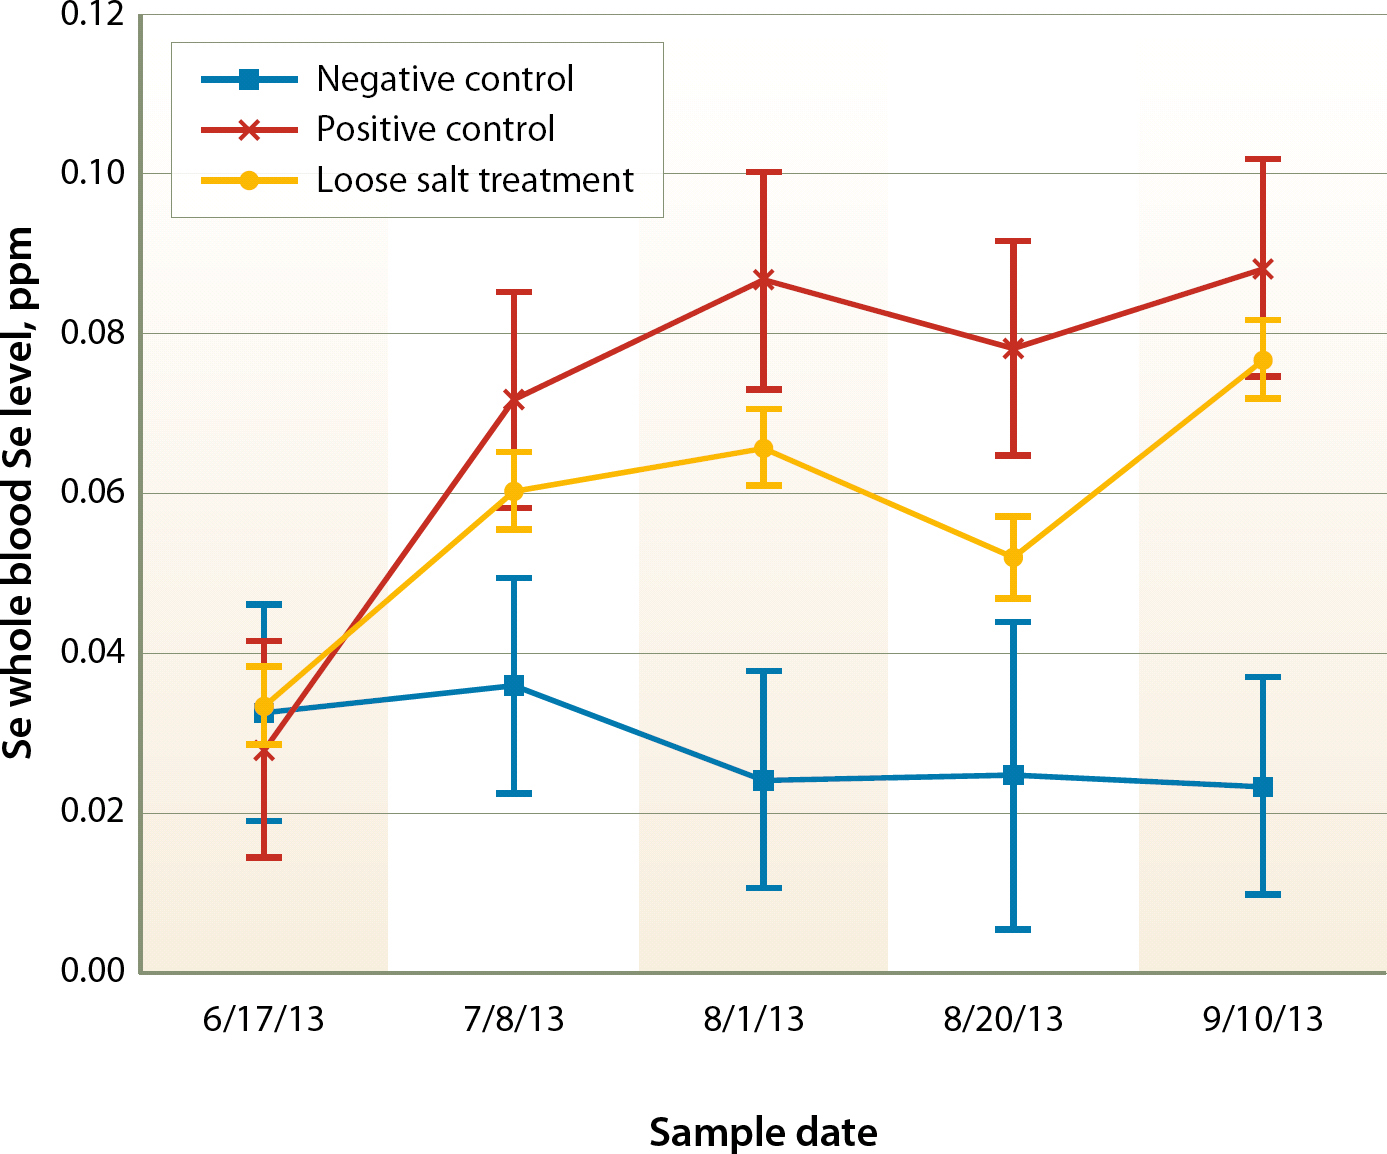
Fig. 2. Whole blood Se response with least significant differences by treatment and date in trial 2, 2013.
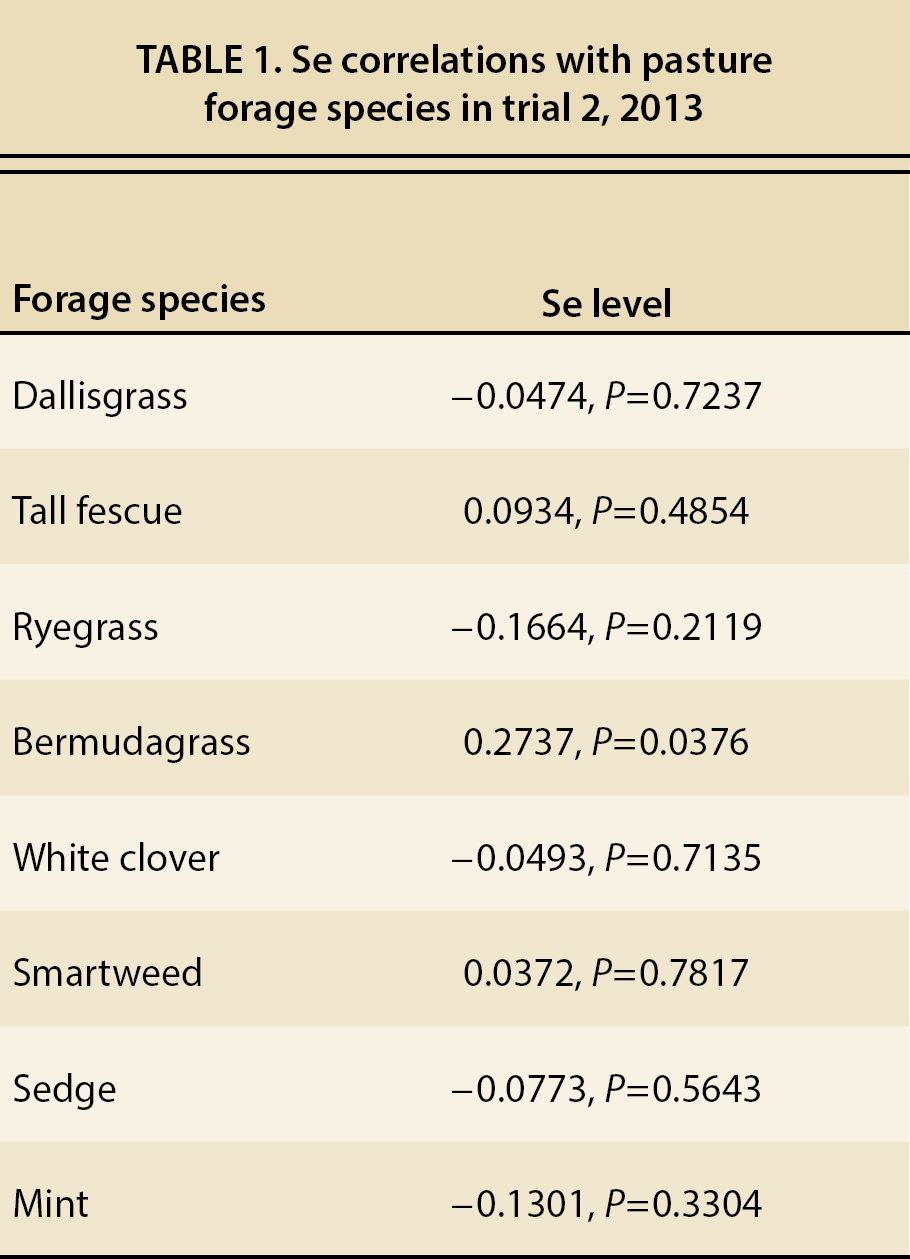
The pasture forage Se level was substantially low (fig. 3). A level of 0.1 ppm with a maximum intake of 2 ppm is considered necessary for cattle (NRC 2000). Both pastures in 2013, with the exception of one outlier sampling in July, were generally below this guideline, which again was evident with the consistent decline of Se levels in control cattle. Most likely due to the outlier sampling date, there was a significant date and date-pasture interaction (P < 0.01, P = 0.04, respectively), though pasture itself was not significant (P = 0.07). Only one significant correlation between forage species and Se level existed, which was bermudagrass, but the correlation was low (P = 0.04, r = 0.27, table 1).
Weight gain
Treatment did not significantly affect average daily gain in either trial (P = 0.20 and 0.12, respectively; fig. 4). Likewise, no correlation existed between Se whole blood level and cumulative average daily gain (r=0.15) or weight at each sampling (r=0.16) in the 2013 trial.

Fig. 4. Cumulative average daily gain and associated 95% confidence intervals by treatment in each trial.
Comparison of treatment methods
Similar to the findings of Renquist et al. (2007), our data show that sustained herd average of adequate levels of whole blood Se are possible through the use of a Se rumen bolus. In both trial 1 and trial 2, Se levels elevated quickly, with most steers reaching adequate levels soon after treatment. This group consistently stayed at an adequate level throughout both trials. The rumen bolus method of supplementation appears to be a very dependable method of supplementation, particularly if Se is the only deficient mineral.
Injection forms of Se are easier to administer in terms of cattle restraint, applicator skill, and, usually, time. The injections do elevate Se levels. In our trials, the higher injection dose at 25 (Multimin) versus 15 (MU-SE) mg/head provided significantly higher whole blood Se levels than the lower dose at 30 days posttreatment. In this time frame, the Se whole blood level in cattle treated with the higher dose was equal to that in the Se bolus-treated cattle, but the benefits didn't last as long. Our results agree with others that at 90 days, an injection of Se should not be expected to provide any supplemental benefit regardless of dose (Genther and Hansen 2014; Maas et al. 1983). However, this method may be a practical consideration when combined with the loose salt-based supplemental method.
The greatest benefit of a salt-based supplement is that it allows multiple minerals to be supplemented at the same time. Our 2013 trial found that it was possible for the herd to reach an adequate level of Se with this supplemental method. The difference between this method and the others is that it takes a longer time period to bring deficient cattle to adequate levels. This treatment did increase whole blood Se levels soon after the supplement was placed into the treatment pasture, but remained at a marginally deficient level until the final sampling.
Since forage Se differences were not significantly impacted by plant species or pasture, we attribute differences in whole blood Se levels to the supplement consumed, and in fact, whole blood Se levels corresponded to consumption of the loose mineral supplement. Intake levels were high when the supplement was first placed in the pasture (6/17/13). At a consumption rate of 5.6 oz/head/day, the corresponding Se intake was 19 mg/head/day, which is similar to levels administered through Se injection. On the first posttreatment sampling date (7/8/2013, table 2), Se intake was 19 mg/head/day. By the next sampling date (8/1/2013), Se intake had declined to 9 mg/head/day, and then to 8 mg/head/day on the third sampling (8/20/13). Yet, on the last sampling date (9/10/13), the herd average intake had increased to 15 mg/head/day, and corresponding Se whole blood levels had again increased significantly. This data indicates the importance of continued consumption of the supplement in known deficient areas. Seasonal supplementation, such as only during the breeding season, does not appear to be a method to adequately maintain Se levels.

TABLE 2. Average consumption of loose salt mineral supplement and associated Se uptake of the whole herd in trial 2, 2013
Though they did very well at a herd average, no supplemental method, including the bolus, brought all animals to adequate levels. Table 3 depicts the percentage of the loose salt treatment cattle that were still deficient or severely deficient as compared to the herd average Se level at each sampling. Surprisingly, all treatments were similar in this effect. Though the salt treatment reduced the percentage of cattle that were severely deficient by four times, there were still 21% of cattle that were severely deficient when the herd average was adequate. Even the bolus, which was considered a reliable long-term treatment, left 23% and 17% of animals severely deficient in trials 1 and 2, respectively. Combining supplementation methods may decrease the overall number of deficient cattle. This may include practices such as administering Se injections at the beginning of the supplementation period and then providing salt supplement as a means to maintain Se levels.
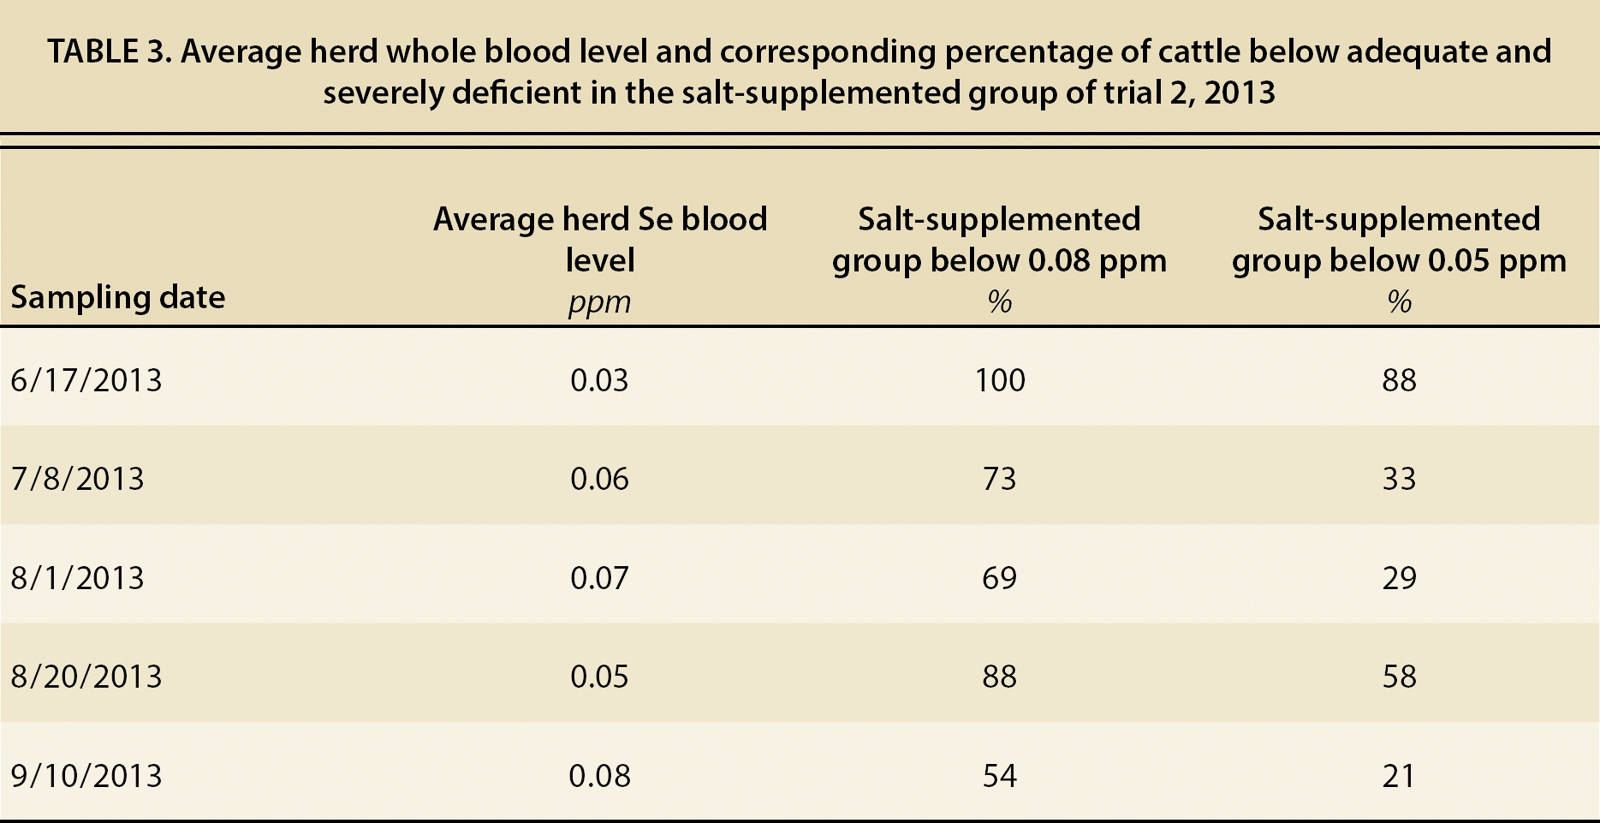
TABLE 3. Average herd whole blood level and corresponding percentage of cattle below adequate and severely deficient in the salt-supplemented group of trial 2, 2013
Surprisingly, weight gain was not a function of Se whole blood level. Both trials had significant variance in animal Se levels and neither proved significantly attributed nor correlated with gain differences based on Se. Pasture appeared to be a greater influence on weight gain in 2013 than Se treatment. The pasture with the positive and negative control cattle had better gains, though not different from each other, than the separated loose salt treatment group. Correspondingly, the positive/negative control pasture was also higher in energy (total digestible nutrients, TDN) (P < 0.01) and protein (P < 0.01). We suspect this was due to a 10% higher basal cover composition of white clover in the control pasture (P < 0.01). This was surprising, as the pastures were separated only by a single fence line and both were originally planted on the same date.

This does not imply that correction of low Se levels is not important. Salles et al. (2014) found significant immune response with elevated Se levels in calves. Nicholson et al. (1993) found slight antibody increases in yearling cattle that were supplemented with Se. Similarly, Makimura et al. (1993) found greater vaccine antibody response in Se-supplemented cattle. It appears that Se may not directly influence weight gain as do factors such as TDN in a ration; rather, it may have an indirect affect on an animal's overall health. Reductions in weight gain may only be noticed in Se-deficient cattle that experience some sort of immune challenge, which secondarily reduces weight gain. The possibilities for this type of challenge could be numerous, including parasite and disease infections, which are commonly faced by beef cattle producers. It is likely in our two controlled trials that these challenges were minimal due to many factors, such as contained herds with little exposure to outside cattle or off-ranch forage sources. However, one could speculate that at some time an immune challenge would occur, resulting in any number of animal health problems in a Se-deficient group of cattle.
Efficacy of selenium supplementation methods in California yearling beef cattle and resulting effect on weight gain

