


All Issues
Spring and summer nitrogen applications to Vina walnuts
Publication Information
California Agriculture 44(4):30-32.
Published July 01, 1990
PDF | Citation | Permissions
Abstract
Walnut yield responses to nitrogen applied in spring or fall, or split between spring and fall varied in an experiment on deep alluvial Columbia soil. Leaf and twig nitrogen responded most to recently applied nitrogen. Matching the crop's rate of nitrogen removal with the nitrogen application rate and monitoring plant nutritional status with leaf analysis should contribute to economical, environmentally sound walnut orchard management.
Full text
Fall nitrogen applications (October through November) have been common practice in Tehama County orchards for many years. The major reasons were convenience and fertilizer cost. It was convenient for growers because harvest was over and pruning would not start for at least a month or two. Early research in dryland orchards indicated that fall-applied nitrogen fertilizer would be moved into the rootzone by winter rains for better uptake by the trees.
While it was convenient and often less costly for growers, wintertime soil conditions in Tehama County are less than ideal for efficient use of fall-applied nitrogen. Cold, wet weather begins in November and saturated soils are common for periods throughout the winter. Nitrogen fertilizers were often broadcast on the soil surface and seldom incorporated into the soil.
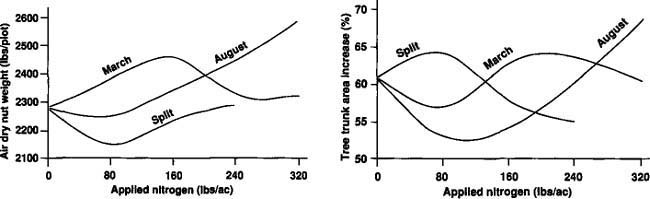
Fig. 1. Five-year (1983-1987) average walnut yields as influenced by rate and time of nitrogen application.
Alternate wetting and drying with heavy dews and warm afternoon temperatures would provide conditions suitable for substantial volatilization of ammonia from surface-applied ammonium-based fertilizers. Also, during wet weather when soils remain saturated for long periods, the denitrification of considerable quantities of nitrate nitrogen is possible. Applying fertilizer long before crop uptake results in less efficient use of nitrogen.
Earlier studies conducted in Tehama County by the senior author suggested large overwinter losses of fall-applied nitrogen. Given the number of undesirable features surrounding fall-applied nitrogen to orchard crops, it seemed advisable to evaluate alternate application times in order to increase the uptake and utilization of fertilizer nitrogen.
The 5-year study
In 1980, we initiated a study to evaluate several rates of nitrogen applied in the spring, the late summer, and at both times to mature walnut trees. These application timings seemed worth exploring in view of the trees' need for nitrogen to set and grow the nuts as well as for tree growth in late summer. By testing several rates at each time, we would provide the opportunity to develop yield response curves whereby an economic analysis could show the most profitable rate of nitrogen for each time of application.
We selected a high-producing Vina orchard planted in 1971 on a deep alluvial Columbia fine sandy loam soil as our experimental site. The field has a solid-set sprinkler system. The nitrogen was applied at 0,80,160,240, and 320 pounds per acre. Along with a control application (0 Ib), these rates covered the range from about one-half to about double the typical rate used in the area.
We chose three application times: (1) spring (March), (2) summer (August), and (3) split (half spring and half summer). The spring application came in late March or early April, as soon as soils were dry enough to support equipment. The late summer application was timed to allow at least two irrigations between application and harvest. Nitrogen was applied at 80, 160,240, and 320 pounds per acre for each spring and summer application. For the split applications, the 80-, 160-, and 240-pound-per-acre rates were split and applied half in the spring and half in the summer.
The experiment included the above 11 nitrogen treatments and a no-nitrogen control. The nitrogen source was UAN-32 (urea-ammonium nitrate solution), which contains one-half of its nitrogen in urea form and one-fourth each in ammonium and nitrate forms. This liquid fertilizer was injected about 4 inches deep using four shanks along each side of the tree row. Because a rather large orchard was available for the experiment, we chose an individual plot size three rows wide by 30 trees long.
Walnut yield information was collected only from the middle row of each plot. The rows on either side served as buffers between adjacent plots. All three tree rows within a plot were similarly fertilized. The total area for the experimental trial was 36 rows wide and 120 trees long for the 48 individual plots, and covered approximately 50 acres.
To assess the yield variation within the walnut orchard, we collected yield data for 2 years from each of the 48 plots before applying any nitrogen fertilizer treatments. The 48 plots were ranked from highest to lowest based on their 2-year average yields, and divided into four blocks of 12 plots each. The highest-yielding 12 were in one block (replication), the next highest 12 in the next block, and so on.
The 12 treatments were randomly assigned to the 12 plots within each block. The first treatments were applied in the summer of 1982, so that was essentially another base year. The 1983 yields were the first we considered to be affected by the nitrogen treatments. Yield measurements were taken for the 5-year period 1983 to 1987. We measured the yields by weighing the nuts, hulls, and debris harvested from the middle row of each plot.
Samples were taken at harvest time to assess the air-dry nut weight fraction. The samples were hulled, cleared of debris, and air-dried to determine the percentage the nuts represented of the total harvest weight. Leaf samples were taken in July of 1983, 1985, and 1986; dormant season twig samples were taken once in early February of 1987. All samples were analyzed for total nitrogen.
Results
The 5 years' yield results are given in table 1. For March applications, nut yields increased with nitrogen increases of 0 to 160 pounds nitrogen per acre, and then decreased with higher application rates. The yield for 80-pound summer application was essentially the same as the control, but higher application rates tended to increase yields, with the highest yield at the 320-pound rate. Split applications tended to have the lowest yields.
In 1983,1985, and 1986 leaf nitrogen concentrations increased in response to increases in applied nitrogen (table 2). The increased nitrogen levels followed the applied nitrogen rates more closely for the March and split applications than for the August applications. Twig nitrogen concentration increased for the applied nitrogen rates within each of the three application times, but the control treatment had among the highest concentrations of all.
Conclusions
There are several notable differences in the trends the walnut yields exhibited for different nitrogen application times and rates. The most striking was the difference between spring and summer treatments. The spring-applied treatments were more in line with what is expected from increased yield in response to increased nitrogen rates. That is, yields increased as the rate of applied nitrogen increased from 0 to 160 pounds per acre, with no further increase and even a slight decline for higher nitrogen rates.
The summer-applied treatments showed no increase in yield until a significant amount of nitrogen had been applied. However, after the nitrogen rate reached 160 pounds per acre, yields continued to increase up to the highest rate applied, 320 pounds per acre. The summer-treatment results suggest that higher rates of nitrogen applied in August will lead to higher yields. From the yield trends, the split application appears to be the least efficient way to apply nitrogen. All split applications gave yields near or below that of the control.
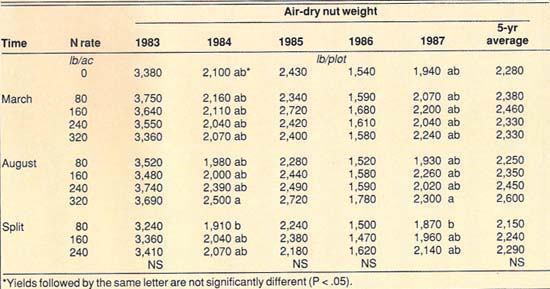
TABLE 1. Walnut yields from 1983 to 1987 as influenced by rate and time of UAN-32 nitrogen fertilizer application
Statistical analysis of the yield data revealed essentially no significant differences between rates or times of nitrogen application. Only the highest-yielding treatment (August, 320 pounds of nitrogen per acre) and the lowest-yielding treatment (split, 80 pounds of nitrogen per acre) were significantly different in 2 of the 5 years, 1983 through 1987. This lack of nitrogen response is typical for a number of orchard crops in California, first because they are usually planted on deep fertile soils, and second because nitrogen removal in the harvested portion of the crop is often less than the amount stored in the tree plus what the soil is able to supply.
Apparently, the deep alluvial Columbia soil at our experiment site provided substantial nitrogen to meet the walnut crop needs. Leaf nitrogen concentrations reflect this high level of soil nitrogen. Both economical and environmental perspectives indicate that growers should more closely match the crop's nitrogen removal with the nitrogen application rate, and monitor the nutritional status of the orchard with leaf analysis.
Field heterogeneity and tree growth differences have significant impacts on permanent or multiple-year crops and the resulting yields. Tree circumference measurements taken early each year indicate that the highest-yielding treatment (August, 320 pounds of nitrogen per acre) also recorded the greatest increase (69%) in cross-sectional area from 1981 to 1987.
Nitrogen undoubtedly was one of the important components that resulted in the largest percentage increase in trunk area and the highest nut yields. Leaf and twig nitrogen concentrations are often the quickest to respond to nitrogen applications. The highly mobile nitrogen moves to the more active photosynthetic tissue in the leaves, and is then incorporated into other parts of the growing trees. Because a large portion of the nitrogen going into the nuts comes from stored rather than fertilizer nitrogen, the correlation between nut yield and applied nitrogen can be lower than between leaf nitrogen and applied nitrogen.
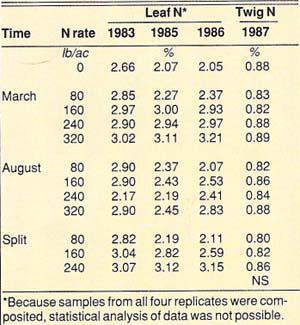
TABLE 2. Total nitrogen (N) concentration in walnut leaves in July and twigs in February 1987 as influenced by time and rate of nitrogen fertilizer application

Spring nitrogen applications were made well before walnut leaf-out, as soon as the orchard floor was sufficiently dry to support equipment. Better results were obtained with late-summer applications.
Spring and summer nitrogen applications to Vina walnuts

