


All Issues
Cracks affect infiltration of furrow crop irrigation
Publication Information
California Agriculture 52(2):38-42. https://doi.org/10.3733/ca.v052n02p38
Published March 01, 1998
PDF | Citation | Permissions
Abstract
Cracks can play a major role in water advance and infiltration in a cracking soil. Water flowing directly into subsurface cracks dominated the cumulative intake for the preirrigation at a site in the San Joaquin Valley. Differences in furrow inflow rates had little effect on cumulative infiltration for preirrigation. However, for subsequent irrigations, different furrow inflow rates significantly affected cumulative Infiltration. Crack flow was a significant factor in cumulative infiltration for the crop irrigations. Uniformity of water advance among furrows was high for the preirrigation but was less for the crop irrigations. A comparison of surge irrigation and continuous-flow furrow irrigation with furrow lengths of about 1/4 mile and 1/2 mile showed little difference in cumulative infiltration.
Full text
Furrow irrigation is used on about 70% of the irrigated acreage in California. The main advantage of furrow irrigation is the low capital cost. Properly managed, furrow irrigation can be efficient if appropriate furrow lengths, furrow inflow rates and irrigation set times are used and the surface runoff is beneficially used.
The performance of a furrow irrigation system depends on furrow length, furrow inflow rate, slope, surface roughness, infiltration rate and furrow geometry. Water flowing into cracks in the soil can affect overall infiltration.
The performance of a furrow irrigation system depends on furrow length, furrow inflow rate, slope, surface roughness, infiltration rate and furrow geometry. The rate at which water flows down the furrow reflects an integration of these factors. By plotting the time water arrives at various distances down the furrow against the distance, an advance curve is developed that describes the rate at which water moves down the furrow length.
Water infiltration plays a major role in the performance of furrow irrigation systems. Soils with high infiltration rates require short furrow lengths for efficient operation, while long furrow lengths can be used for soils with low infiltration rates. In noncracking soils, infiltration consists of water flowing directly into the porous matrix of the soil. Initial infiltration into a cracking soil consists of water flowing into the cracks and the soil matrix, causing a very high initial infiltration rate. Once the cracks close, the infiltration rate drops to very low values.
During the period of crack flow, water movement can occur as far as 15 to 20 feet beyond the furrow (called subbing).
Water flow into cracks, and subsequent subbing may affect the performance of a furrow irrigation system. The objective of this study was to evaluate the performance of a furrow irrigation system in a cracking clay loam soil.
Furrow irrigation system
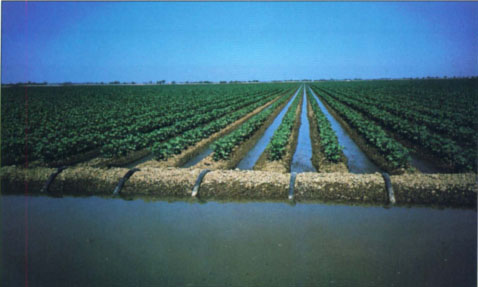
We evaluated a furrow irrigation system in a cracking clay loam soil over a 2-year period (1987 and 1988). The site was a cotton field located near Stratford, on the west side of the San Joaquin Valley.
Data on furrow inflow and outflow rates, advance times, depth of flow, slope and furrow geometry were collected on 3 to 6 furrows. The inflow rates were 37, 43 and 56 gallons per minute for the January preirrigation; 32, 38 and 48 gallons per minute for the June 17 irrigation; and 22, 32 and 45 gallons per minute for the Aug. 4 irrigation. The lowest inflow rate was the grower's normal flow rate. Advance times were also measured on 20 to 30 furrows at distances of 590 feet, 1,180 feet and 2,360 feet, irrigated with the normal inflow rate. Broadcrested weir flumes were used for the flow rate measurements. Irrigation set times were 22 to 24 hours. Siphons were used for the irrigations.
For the second year, we changed design and management based on the first year's data. The pressure chamber was used for irrigation scheduling during the second year. Furrow length of the preirrigation was reduced from 2,360 feet to 1,260 feet and the irrigation set time was reduced to 10 hours. For the crop irrigations, we used furrow lengths of 1,260 feet (1/4-mile treatment) and 2,360 feet (1/2-mile treatment) with a block of 50 furrows per treatment. Treatments were not replicated due to farm-level restrictions. Gated pipe was used for the irrigations.
Surge irrigation was also evaluated during the second year. A furrow length of 1,180 feet was used for the surge preirrigation, and a length of 2,360 was used for all crop irrigations.
During the second year, we measured inflow rate and outflow rate for each block of 50 furrows for each treatment. Water advance times were recorded for 40 furrows during the February preirrigation, the June 20–21 irrigation and the July 11–12 irrigation. Soil moisture was measured during the crop irrigations with a neutron moisture meter at 50 locations (50-foot intervals between locations) along transects installed over the furrow length of 2,360 feet (1/2-mile treatment) and the surge irrigation treatment.
Soil type was a clay loam in the upper half of the field (30% clay, 40% silt and 30% sand), but gradually changed to a loam in the lower half (23% clay, 44% silt and 33% sand). Our observations revealed that below the cultivated top soil, cracking of the subsurface soil occurred prior to the preirrigation and the first crop irrigation. Once cultivation ceased, the cracks extended to the surface.
Cumulative infiltration
Cumulative infiltration of the first year was determined by the differences between the cumulative furrow inflow and outflow rates. Distance between the inflow and outflow flumes was 1,640 feet for the preirrigation and 2,360 feet for the crop irrigations.
For the preirrigation, cumulative infiltration increased at a decreasing rate with time for all three inflow rates, which would be expected (fig. 1). Little difference occurred in cumulative infiltration between the three furrow flow rates, even though the highest flow rate was 1.5 times greater than the lowest flow rate. No trend in increasing slope of the cumulative infiltration curve with increasing inflow rate occurred.
In general, cumulative infiltration expressed as a volume of infiltrated water per unit length of furrow should increase as the furrow inflow rate increases. Higher inflow rates mean more wetted area of the furrow available for infiltration, and thus higher infiltration rates. For this irrigation, however, cumulative infiltration was not affected by the furrow inflow rate.
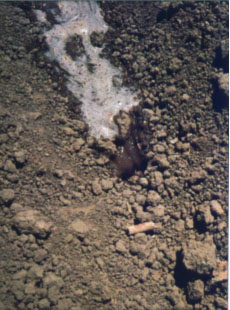
The subsurface cracks caused this behavior. During the irrigation, the plowed top soil periodically sloughed off into subsurface cracks. Water in the furrow then drained into the crack, and water advance down the furrow ceased. This crack flow lasted several minutes. The behavior of cumulative infiltration with furrow inflow rate indicates that the water flow into the cracks dominated the early infiltration process, and that differences in the wetted perimeters of the different inflow rates had little effect on infiltration.
Figure 1 shows cumulative infiltration with elapsed time for the 1987 June and August irrigations. A trend of increasing cumulative infiltration with increasing furrow inflow rate occurred during the early stages of the irrigations. Note that for both irrigations, the slopes of these curves increased with increasing inflow rate for the early stages of infiltration. The steeper the slope, the higher the infiltration rate. Differences in cumulative infiltration between the inflow rates were less for the June irrigation than for the August irrigation.
Soil cultivation occurred prior to the June irrigation, so no surface cracks existed at the time of the irrigation. Drainage into subsurface cracks was visually observed during this irrigation. However, this crack flow apparently was less of an influence on the cumulative infiltration compared with the preirrigation because of the trend of increasing infiltration with increasing inflow rate.
No cultivation occurred prior to the August irrigation. Surface cracks were observed in the furrow and bed. During the irrigation, interfurrow water flow was observed, caused by water flowing through the bed cracks. This flow eroded the cracks and created channels in the bed for water flow.

Fig. 1 Cumulative infiltration with inflow rate for the preirrigation, first crop irrigation and last crop irrigation of the first year.

Fig. 2 Advance times of the preirrigation, first crop irrigation and last crop irrigation of the first year.
The strong relationship between cumulative infiltration and furrow inflow rate of the August irrigation suggests that water infiltration was strongly affected by the depth of flow in the furrow. The deeper the depth of the flowing water, the larger the wetted surface available for infiltration, both on the furrow surface and inside the cracks.
The steady-state or basic infiltration rate, determined for the smallest inflow rates, was 0.48 gallons per minute per 100 feet of furrow length for the preirrigation, 0.27 gallons per minute per 100 feet for the June irrigation and 0.07 gallons per minute per 100 feet for the August irrigation.
One implication of this behavior is that the method used for measuring infiltration rates must account for the crack flow. Methods such as blocked furrows, ring infiltrometers and flowing furrow infiltrometers, which may use several feet of furrow length, might not account for the water flow into cracks, particularly where crack filling accounts for much of the infiltration. Methods such as inflow and outflow or the volume-balance “2-point” approach would be more appropriate for cracking soils because a long length of the furrow is used as the infiltrometer. Measurements should also be made on a block of adjacent furrows because of the crack flow. Those furrows with a tendency for faster water advance could have larger infiltration rates because of crack filling, whereas slower furrows could have smaller infiltration rates because the cracks have already been filled.
Water advance times
Uniform advance times among the furrows occurred at 590 feet and 1,180 feet for the 30 furrows of the preirrigation (fig. 2). Variability among advance times increased with distance down the furrow, with the variability at 2,360 feet nearly three times more than at the other distances. No correlation was found between advance times and furrow inflow rates (table 1).
For the June irrigation, average advance times were similar to those of the preirrigation due to smaller inflow rates. More variability in advance times occurred for this irrigation compared with the preirrigation. Again, variability among the advance times increased with distance.
Variability among the advance times of the August irrigation was much higher than those of the previous irrigations. Large advance times in two furrows contributed to much of the variability caused by water flowing through cracks into adjacent furrows. However, average advance times of this irrigation were similar to those of the other irrigations, which reflected the smaller furrow inflow rates used for this irrigation compared with the other irrigations.
The relatively uniform advance times of the upper part of the field were caused by crack flow. Flow into the subsurface cracks of the preirrigation and the June irrigation would slow down the advance in those furrows that tended to have faster advance. At the same time, water flow into the cracks would be small for those furrows that tended to have slow advance because the cracks were already full. Interfurrow flow occurred for the August irrigation. Water flowed through the bed cracks from those furrows that tended to have faster advance into adjacent furrows with slower advance rates.
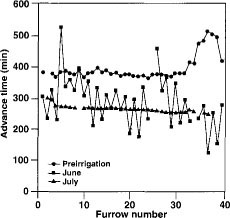
The advance times progressively increased during the irrigation at 1,180 feet for the second year (fig. 3, table 1). The same inflow rates were used for all irrigations, which resulted in the smaller advance times as the irrigation season progressed and the infiltration characteristics of the soil porous matrix changed.
Little variability in advance times occurred among the 40 furrows for the preirrigation for the first 30 furrows (fig. 3). Much longer times were found for the remaining furrows, believed to be caused by crack flow into an adjacent unirrigated block. Penetrometer measurements made after the irrigation revealed that subsurface water flowed though cracks for nearly 15 to 20 feet into this adjacent block.
Much more variability occurred for the first crop irrigation (June 21) compared with the preirrigation. These advance times showed relatively short times every 2- and 8-furrow spacings. Reasons for this behavior of 2-furrow spacings are unknown. The behavior of 8-furrow spacings reflects differences in the advance times between the wheel furrows and nonwheel furrows, because two wheel furrows occurred for every block of eight furrows.
Advance times were less variable for the July 12 irrigation than with the other two irrigations. No cultivation occurred prior to this irrigation. A slight trend of decreasing times occurred across the block of furrows. No periodic behavior was found in these data, indicating that differences between wheel and nonwheel furrows was no longer a factor.
Soil moisture content
Only slight changes in soil moisture content occurred with time at depths below 2 feet (fig. 4). The increase in soil moisture content at the end of the field was caused by surface runoff from preceding irrigation sets backing up the furrows (table 2). The last 10 measurements were excluded from the statistical analysis because of the effect of surface runoff from earlier sets.
Before each irrigation, a trend occurred; soil moisture decreased with increasing distance along the furrow until near the end of the field. After the irrigation, a slight trend of decreasing soil moisture occurred for the June and August irrigations, similar to that before the irrigations. The trend, however, was much larger for the July irrigation, particularly along the lower part of the furrow length.
An analysis of the changes in soil moisture content due to an irrigation showed a slight trend of increasing change in soil moisture with increasing distance along the furrow for the June and August irrigations. For the July irrigation, a trend of increasing change occurred over about the first 1,400 feet, followed by a trend of decreasing change for the remaining distance.
Uniformity of the soil moisture content along the furrow length was quite high (table 2). Distribution uniformities after an irrigation ranged between about 87% and nearly 98%, whereas before the irrigation distribution uniformities were about 84% to 86%. Distribution uniformities of the change in soil moisture ranged between 83% and 96%.
Similar average respective soil moisture contents occurred before and after the irrigation, although differences in the average values after the irrigation were statistically different. The average change in soil moisture content ranged between 3.2 inches for the June irrigation and 4.6 inches for the July irrigation. Based on the first year's data, the infiltration rate though the soil per irrigation should decrease with time. Yet for the same irrigation set times, the average change in soil moisture did not decrease with time during the irrigation season. This behavior suggests that water flow into cracks played a major role in the infiltration process because this flow would not be affected by any seasonal reductions in the infiltration rate into the soil matrix.
System performance
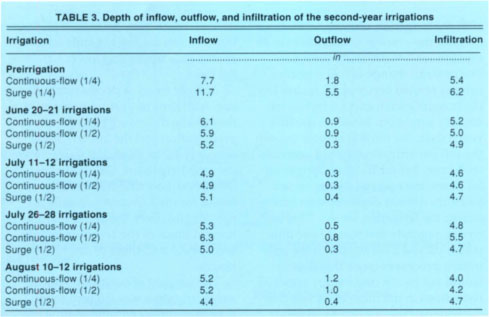
Inflow was measured with a propeller flow meter installed at the irrigation district turnout. Surface runoff was measured with a WSU flume installed in the tailwater ditch at the end of the field. The depth of infiltration is the difference between inflow and outflow. Values for the 1/4-mile lengths are for both upper and lower halves of the field.
A slight trend of decreasing infiltration with time of year occurred, although the difference between the preirrigation and the last irrigation was only 1.2 to 1.4 inches (table 3). For the crop irrigations, little difference in inflow, outflow and infiltration was found for the 1/4- and 1/2-mile furrow lengths, even though the irrigation set times of the 1/4-mile length were about half those of the 1/2-mile length.
The amount of infiltration under surge irrigation was 0.8 inch more than that of the continuous-flow irrigations for the preirrigation. Normally the opposite would be expected because many field trials comparing surge irrigation with continuous-flow irrigation revealed less infiltration under surge irrigation. The amounts of applied water and surface runoff were considerably higher under surge irrigation than under continuous-flow irrigation. This was due to a longer irrigation set time used for this surge irrigation compared with the set times of the continuous flow treatments. For the crop irrigations, little difference in infiltrated amounts occurred between the continuous-flow irrigations and the surge irrigation.


TABLE 2 Average soil moisture content, standard deviation, coefficient of variation (CV) and distribution uniformity (DU) for the second year
These results show little difference in infiltrated amounts between the three irrigation methods, particularly for the crop irrigations. This behavior indicates that under a cracking soil, improvements such as reduced furrow lengths, increased furrow inflow rates and surge irrigation may have little effect on infiltration. Two factors appear responsible for this behavior. First, for the earlier irrigations, water flow into the subsurface cracks appeared to dominate the infiltration process. These improvements could not reduce this crack flow compared to that which occurred under the unimproved furrow system. Second, for the later irrigations after cultivation had ceased, water flow into shallow surface cracks coupled with a very low steady-state infiltration rate controlled the infiltration. Little could be done to reduce infiltration below these amounts under these conditions.
Conclusions
Cumulative infiltration was not affected by furrow inflow rate for the preirrigation because the water flowed into the subsurface cracks. For the first crop irrigation, cumulative infiltration increased slightly with increasing furrow inflow rate, indicating that infiltration directly into the porous soil matrix from the furrow was more of a factor for this irrigation than for the preirrigation. Cumulative infiltration increased substantially with increasing furrow inflow rate for the August irrigation of the first year. The wetted perimeter thus increased for the larger inflow rates during this late-season irrigation. Steady-state infiltration rates decreased substantially with time during the year based on the measurements of the first year.
Uniform advance times up to 1,180 feet, caused by crack flow, occurred for the preirrigation and crop irrigations, except for the later irrigation of the first year.
High uniformity of soil moisture occurred with distance along the furrow. Values of distribution uniformity after the irrigation exceeded about 87% for each irrigation. Average changes in soil moisture content after the irrigation were similar, even though the steady-state infiltration rate decreased with time (based on the results of the first year). This behavior reflects the role of the surface cracks in the infiltration process.
For all practical purposes, little difference in infiltrated amounts was found for the two continuous-flow irrigation treatments and the surge irrigation treatment. This indicates that in cracking soils, measures normally recommended for improving furrow irrigation systems may have little impact on system performance compared with the unimproved system. Sprinkler irrigation may be necessary to reduce infiltration under these conditions.

Cracks affect infiltration of furrow crop irrigation

