


All Issues
Food stamp recipients eat more vegetables after viewing nutrition videos
Publication Information
California Agriculture 53(5):24-28. https://doi.org/10.3733/ca.v053n05p24
Published September 01, 1999
PDF | Citation | Permissions
Abstract
After viewing a videotape promoting vegetables, food stamp recipients increased their consumption of vegetables. The control group that viewed a videotape on the safe use of household chemicals also increased their vegetable consumption, but to a lesser extent. The food stamp recipients greatly increased their potato consumption and scored significantly higher for vegetable knowledge than they had on the pretest, whereas the control group significantly improved its knowledge on the safe use of household chemicals. This study demonstrates that videotape instruction can improve nutrition knowledge, and to some extent can change the behavior of food stamp recipients.
Full text
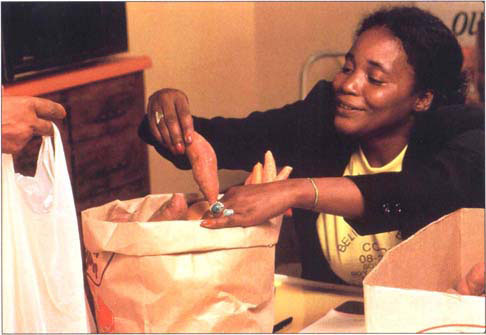
Cooperative Extension nutrition education assistant Majeedah Rahman formed a cooperative to buy fruits and vegetables at low cost from farmers' markets. Most California farmers' markets are certified for vendors to accept food stamps.

In the For Goodness Sake! videotape series, participants learned about the higher nutritional value of fresh vegetables.
Research has shown that nutrition education improves the diet of low-income families (Del Tredici et al. 1988). Food stamp recipients have benefited from nutrition education (Joy and Doisy 1996), and more approaches are needed to reach this audience. Videotape, television and radio instruction are effective approaches to changing nutrition knowledge and attitudes. The use of videotape instruction to increase knowledge has been studied in a variety of settings. Nichols and Schmidt, in 1995, used videotape instruction in grocery stores to increase the knowledge of fat and cholesterol in shoppers. Byrd-Bredbenner et al. used a videotape or lecture to teach two 5-minute lessons on convenience foods. Significant improvements in knowledge were seen in the videotape group (mean knowledge score 15.36 out of 19.0) compared to the lecture group (mean knowledge score 13.42 out of 19.0). In addition, Hassell and Medved (1975) improved knowledge in diabetic patients.
Although knowledge changes have been published in some clinical studies, few studies have shown behavior changes. Pace et al. at the Lipid Research Clinic of Baylor College of Medicine showed improved breakfast-eating practices of men participating in a coronary prevention trial. In this study, 54 men were divided into three groups (control, videotape and videotape plus discussion with a dietitian). Significant improvements (as measured by the mean number of breakfast components consumed daily) were found 1 week and 2 months after instruction in the groups receiving the videotape and videotape plus discussion compared to the control group.
Lawson et al. (1976) used a videotape tutorial method developed primarily for hemodialysis patients who had less than a lOth-grade education level. Although all patients in the study showed significant knowledge gains (increase of 30.8%), the less educated group showed a larger change (37.0%).
Videotape instruction is commonly used in low-income nutrition programs like the Expanded Food and Nutrition Education Program (EFNEP) and the Special Supplemental Nutrition Program for Women, Infants and Children (WIC), and many health departments use videotapes in waiting rooms (Joy and Fujii 1995; Wightman 1990). On videotape, nutrition information can be easily packaged and visually stimulating. In addition, many researchers have noted that although this approach is increasing in popularity, few studies have been done to evaluate its effectiveness. Furthermore, although many studies have been done in clinical settings, few researchers have tried to measure changes in an agency setting.
The purpose of our study was to evaluate the effectiveness of using a short, focused videotape to increase the amount of vegetables consumed and to improve nutrition-related knowledge in food stamp recipients. We also collected information on die types and amounts of vegetables they consumed. Our hypothesis was that videotape instruction would increase the consumption of vegetables in food stamp recipients. In addition, we expected that videotape instruction in an agency setting was a feasible approach to reach food stamp recipients.
Three-county study
We conducted the study in food stamp offices in three California counties: Contra Costa, Sonoma and Stanislaus. A quasi-experimental design was used to randomly assign food stamp recipients to either an experimental group or a control group. All recipients in both groups heard a description of the study, took a self-administered pretest and then watched an experimental or control videotape. The experimental group viewed the “For Goodness Sake! Vegetables” videotape (12 minutes) about vegetables. The control group viewed a videotape (11 minutes) focusing on the safe use of household chemicals, titled “Too Close for Comfort.”
Two to nine weeks following the pretest, food stamp recipients took a posttest administered via telephone by a trained nutrition researcher. Most of the respondents were interviewed between weeks 2 and 6. Three attempts were made to reach them. We could not reach 39% for the following reasons: (1) no answer or did not return telephone message; (2) moved with no forwarding telephone number; (3) telephone was disconnected or no longer in service. Recipients were included in the analysis if they watched the videotape and completed both the pretest and posttest. Those who completed the study received a $10 grocery store voucher.
Because research has shown that low-income EFNEP families have low intakes of fruits and vegetables (Del Tredici et al. 1988), the objective of the videotape “For Goodness Sake! Vegetables” (Joy et al. 1994) was primarily to increase vegetable consumption in terms of number of servings per day and variety of vegetables consumed.
Individual randomization was not possible because the food stamp offices did not have two rooms available to snow the videotapes simultaneously. Instead, we used a quasi-experimental design: groups of 5 to 25 food stamp recipients were randomly assigned to watch either the experimental or the control videotape. A random-number chart was used to determine which videotape each group watched.
Vegetable recall
To document vegetable consumption patterns of food stamp recipients, we designed a 24-hour vegetable recall and a three-page questionnaire. Results from the vegetable recall were analyzed in terms of frequency of vegetables reported and amount consumed (in serving sizes).
The three-page questionnaire contained one page to collect demographic information and two pages of open-ended, multiple choice and true and false questions. There were eight open-ended questions on specific vegetables (for example, “How many times, within the last two days, have you eaten any of the following vegetables?”) and two open-ended questions on which vegetables were eaten most often last week and what raw vegetables were eaten last week. One more question was asked about raw vegetables (“Have you eaten any raw vegetables in the last week?__yes __no; if yes, please name them”). The apparent repetitiveness in the questions was intentional, to examine respondent consistency in answering these questions. The questionnaire also asked 12 knowledge questions based on concepts from both videotapes, with 8 questions addressing vegetable knowledge (subscale VEGKN) and 4 questions addressing the safe use of household chemicals, or household safety knowledge (subscale HHSKN). Each of the subscales was scored (range for VEGKN was 0 to 8 and range for HHSKN was 0 to 4), so that both videotapes were evaluated for knowledge changes. Finally, to get a measure of fat intake, we asked a question on sauces and condiments that are added to vegetables. Recipients were asked to check off all the items that they usually add to vegetables f margarine and butter; lemon juice; herds, including salt and pepper; salsa; sour cream or cheese sauce; soy sauce; and other).
To measure participants' vegetable consumption, we developed the vegetable 24-hour recall. Recipients recorded the previous day's intake of vegetables on a form (pretest), listing all vegetables eaten as meals or snacks from waking to bedtime. Some vegetables were confusing to the target audience when the instrument was pilot tested so we listed examples (vegetable salads, salsa, vegetables as part of another dish like spaghetti sauce, tacos, soup, tomatoes, potatoes, onions, french fries, casseroles). The nutrition researcher was available to answer questions, and this person also reviewed the recall for completeness, especially in regard to mixed dishes and casseroles.
Posttests were done by telephone interview using the same form. Vegetable intakes from all study participants were scored by one nutritionist using the Food Guide Pyramid recommendations (USDA 1992): 1 serving was a half cup of cooked vegetables or 1 cup of raw leafy vegetables; conversions were made for raw, nonleafy vegetables. Although the nutrition researcher carefully recorded food mixtures and casseroles to determine the vegetable content and quantity, few respondents reported vegetables from mixed dishes. Potato chips and other highly processed or flavored snack foods were not counted as vegetables. Potatoes that were baked, broiled or fried were counted.
Statistical analysis
We analyzed pretest and posttest data using Statistical Package for the Social Sciences for IBM computers. An analysis of covariance was used to analyze the vegetable recall data in order to compare changes for the experimental and control groups adjusted for baseline values (Stevens 1986). For these analyses of covariance, the “change score” acted as the dependent variable, with the baseline values (pretest results) acting as covariates and the experimental group as the grouping variable of interest.
The baseline values for the pretest were significantly different for the two groups (the control group started at a higher level of vegetable intake than the experimental group). Thus the simple evaluation of the change scores could be biased due to “regression to the mean” effects. Analysis of covariance techniques eliminated this source of bias. Both the unadjusted and adjusted change scores are presented.
Study sample characteristics
Before and after the study, we interviewed 560 food stamp recipients (293 in the experimental group and 267 in the control group). Less than 1% of the sample refused to participate.
The demographic characteristics (ethnicity, age, number of children and gender) were not significantly different for the two groups. The participants were mainly women (76.5% women in the experimental group and 74.9% women in the control group). The sample group was also ethnically diverse: mostly Caucasian (50.2% experimental; 52.1% control), followed by African-American (25.6% experimental; 22.5% control), Hispanic (16.7% experimental; 16.1% control), Native American (3.4% experimental; 3.7% control), Asian (1.7% experimental; 1.9% control) and other (2.4% experimental; 3.7% control).
Vegetable consumption
The increased vegetable consumption was statistically significant for both groups (table 1). The experimental group increased its consumption by 1.28 servings (P < 0.001), while the control group increased its consumption by 0.50 servings (P < 0.001). The pretest consumption data for both groups is within the ranges reported by others using a recall method, and lower than those using a food frequency method.
The vegetables most often reported as being consumed by participants (both before and after recalls) were in this order: green salad, potato, broccoli, mixed vegetables, lettuce, tomato, corn, carrots and green beans. We analyzed the consumption results (posttest only) of these vegetables and found that only potatoes showed a significant increase (P = 0.007) in the experimental group (table 1). The increase in consumption was 0.25 servings for the experimental group compared to -0.04 servings for the control group. After adjusting for baseline, the change for the experimental group was found to be significantly greater than the change for the control group (P = 0.02). None of the other vegetables showed a significant difference in either of the two groups.
The mean number of times vegetables were eaten over a 48-hour period increased for both raw (P = 0.013) and cooked vegetables (P = 0.061) in the experimental group (table 2).
Knowledge scores
The vegetable knowledge score (VEGKN) was highly significant for both the unadjusted (P < 0.001) and “adjusted for baseline” (P < 0.001) differences of the experimental group (table 3). The reverse was true for the household safety knowledge score (HHSKN), where both the unadjusted (P < 0.001) and adjusted for baseline (P < 0.001) changes were greater for the control group. Although none of the -recipients reported having received EFNEP instruction, it is possible that some were enrolled in WIC or had other means of receiving nutrition education that contributed to these knowledge gains.
For the VEGKN score, changes for the two groups (adjusted for baseline) were found to be significantly different for the statements “Vegetables are good because they are high in fiber” (P = 0.004); “Should not eat potato skins with green spots” (P = 0.001); and “Should store potatoes in a dark, cool, and dry place” (P = 0.029).
For the HHSKN score, there were significantly different changes for the questions about using baking soda (P = 0.031) and boric acid (P < 0.001).
To measure fat intake related to vegetable consumption, we analyzed a checklist of six condiments. Of the six choices, two were high in fat. For one of the low-fat condiment choices, salsa, the change was statistically significant for the experimental group compared to the control group (P = 0.006).
Limitations
This study had limitations in both its design and its methodology. The study sample was limited in its representation of the California food stamp population. Because of the high mobility of this population in California and the need to have a telephone to participate in this study, the food stamp recipients who completed the study may be biased in the direction of being the most stable and the most motivated.
In addition, using a quasi-experimental design posed other limitations. It would have been better to have all individuals randomly assigned; however, it is difficult to find agency settings with two separate classrooms. Although this study will provide information on the feasibility of using a classroom in an agency setting, the setting was the most favorable, having fewer distractions than might normally be present.
Video: feasible teaching tool
This study has shown that videotape instruction is a feasible approach to changing the behavior of food stamp recipients in an agency setting. Vegetable consumption was measured by a 24-hour vegetable recall. Pretest consumption results from this study were similar to those reported in the intakes by Krebs-Smith et al. (1995) of 2.35 servings for the experimental group and 2.55 servings for the control group. Although the hypothesis that videotape instruction would increase vegetable consumption was not proven to the extent expected, some changes in vegetable consumption did occur.
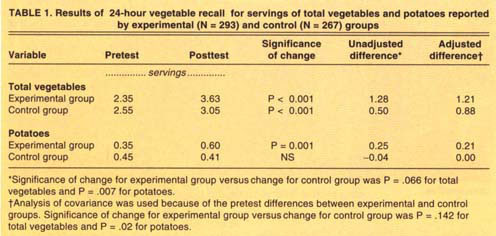
TABLE 1. Results of 24-hour vegetable recall for servings of total vegetables and potatoes reported by experimental (N = 293) and control (N = 267) groups

TABLE 2. Raw and cooked vegetables reported eaten in 48 hours by experimental (N = 293) and control (N = 267) groups

TABLE 3. Changes reported for vegetable knowledge score and household safety knowledge score for borth experimental (N = 293) and control (N = 267) groups
The increase in potato consumption in the experimental group was significant(P = 0.007) compared to the control group. The increase in the servings of potatoes in the experimental group can be directly related to the videotape content. The videotape illustrates many low-fat ideas and recipes for preparing potatoes. Potatoes are shown added to soups, salads and stews and used as a main dish (for example, stuffing baked potatoes with yogurt, chili or cheese). The videotape also showed low-fat cooking techniques to prepare potatoes using the oven and the microwave.
Serdula et al. (1995) collected fruit and vegetable consumption patterns of adults (all income levels) and found that the average intake of potatoes (not fried) was 0.3 servings per day for both men and women. In this study, the pretest consumption of potatoes reported by the food stamp recipients was 0.35 servings (experimental) and 0.45 servings (control), which included fried potatoes.
In addition to the increase reported in potato consumption, there was also an increase in raw vegetable consumption in the experimental group (P = 0.013). Again, the videotape illustrated many different ideas of using raw vegetables in bagged lunches, as snacks and as side dishes with meals (quick and easy salads). The nine vegetables most often reported by both groups, in order of frequency, were green salad, potato, broccoli, mixed vegetables, lettuce, tomato, corn, carrots and green beans.
The desired improvement, increased vegetable consumption, was chosen for two reasons: research has shown that diets high in fruits and vegetables are associated with a decreased risk of cancer; and low-income families typically consume fewer vegetables than recommended. For low-income adults (annual household incomes of less than $30,000), one estimated dietary intake of vegetables is approximately 2.7 to 3.0 servings per day, although the true range is probably broader. Krebs-Smith et al. report that 6.3% of people with an annual income under $10,000 and 10.2% of people with an income of $10,000 to $29,999 consume two servings of fruit and three servings of vegetables per day (1995). Additionally, results from the 1989 to 1991 Continuing Survey of Food Intakes by Individuals (CSFII) suggest “a need to develop strategies for overcoming barriers to eating fruits and vegetables” (Krebs-Smith 1995). Treiman et al. (1996) conducted focus groups to determine barriers to eating fruits and vegetables. Common responses among low-income WIC audiences were “don't like vegetables” and “don't know how to prepare them.”

Nutrition education assistant Michele Brown delivers vegetables for the cooperative.
With the current recommendation of increasing fruits and vegetables in the diet and the low consumption pattern of low-income adults, it is important to find ways to help people change their intake patterns as well as to introduce these foods into the diets of their children. In this study, we observed dietary improvements in vegetable consumption.
This study is the first to evaluate the contribution of videotape instruction in a low-income agency setting. Nutrition knowledge and, to some extent, the vegetable consumption practices of food stamp recipients improved in the videotape group. With the understanding of the difficulties encountered in conducting this research study (especially in the design and methods used), it is important to recognize the limitations of working in the real world. Further work is needed to understand more fully the kinds of food behavior and attitudes that video-tape instruction can influence in any educational setting.
Food stamp recipients eat more vegetables after viewing nutrition videos

