


All Issues
Cost-benefit analysis conducted for nutrition education in California
Publication Information
California Agriculture 60(4):185-191. https://doi.org/10.3733/ca.v060n04p185
Published October 01, 2006
PDF | Citation | Permissions
Abstract
Documenting the cost-effectiveness of nutrition education programs is important to justify and determine expenditures and ensure continued funding. A cost-benefit analysis was conducted using the program demographics and food-related dietary behavior of participants enrolled in California's Expanded Food and Nutrition Education Program (EFNEP), based on methodology developed by Virginia Cooperative Extension. The initial benefit-cost ratio for nutrition education in California was 14.67 to 1.00. Several sensitivity analyses were done to estimate the effect of changes in key variables. The resulting benefit-cost ratios ranged from 3.67 to 1.00, to 8.34 to 1.00, meaning that for every $1.00 spent on nutrition education in California, between $3.67 and $8.34 is saved in health care costs. These results bolster the argument that nutrition education programs are a good investment and funding them is sound public policy.
Full text
Successful nutrition education programs should be effective in both improving dietary health and ensuring a positive economic impact. Evaluations of the Expanded Food and Nutrition Education Program (EFNEP), federally funded nutrition education for low-income families, have demonstrated many positive behavior changes over the last 35 years. These include improvements in diet (increasing intakes of fruits, vegetables and fiber, and decreasing fat and soda consumption); food shopping and preparation (saving money, reading labels, food safety); and nutrition knowledge and attitudes (Contento et al. 1995; Del Tredici et al. 1988). Although the positive improvements in dietary health due to nutrition education are well documented, its value in health care savings has not been extensively studied.
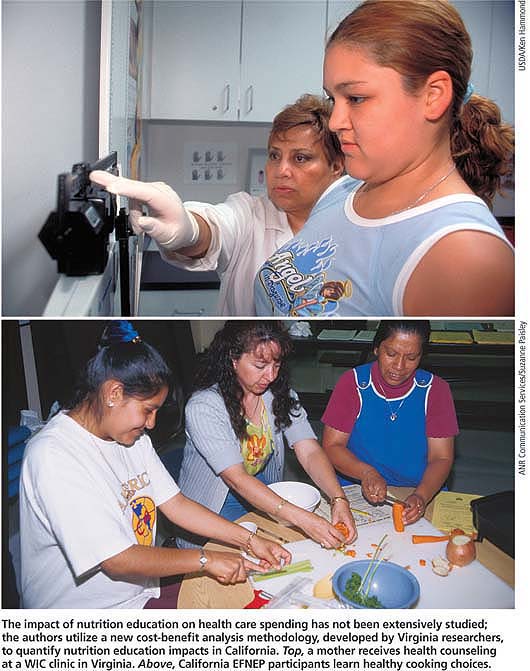
The impact of nutrition education on health care spending has not been extensively studied; the authors utilize a new cost-benefit analysis methodology, developed by Virginia researchers, to quantify nutrition education impacts in California. Top, a mother receives health counseling at a WIC clinic in Virginia. Above, California EFNEP participants learn healthy cooking choices.
Documenting cost-effectiveness is critical if community nutrition programs are to survive under current economic conditions. Cost-benefit analysis is one of the standard ways to document economic benefits. Used primarily by economists for policy- and decision-makers, cost-benefit analysis offers an analytic procedure that is widely applicable to most government, public, private and nonprofit programs (Sassone and Schaeffer 1978).
In 1999, Virginia Cooperative Extension (VCE) designed, implemented and published the first cost-benefit analysis to evaluate the economic value of EFNEP (Rajgopal et al. 2002; Lambur et al. 1999). The Virginia researchers developed a methodology to measure the economic impact of nutrition education by using behavior changes among EFNEP participants. They developed criteria associated with a number of chronic diseases/conditions and determined the associated medical costs, and implemented sensitivity analyses on the data to adjust for certain assumptions.
Glossary
Test Benefits (direct, indirect): Direct benefits are estimated monetary amounts for delaying treatment or preventing a chronic disease; indirect benefits include increased productivity, longer life span and reductions in lost workdays.
Cost-benefit analysis:: Benefits (direct + indirect)/Costs
Costs (direct, indirect): Actual expenditures for program implementation. Direct costs include personnel, benefits, travel, supplies and equipment. Indirect costs include the value of time lost from work by participants.
Costs (in-kind): Total estimated costs for office space and maintenance (donated by county budgets) and utilities (not paid for directly). In California these were calculated using estimated proportions of Virginia's costs.
Costs (tangible, intangible): Tangible costs are easily monetized (direct and indirect benefits); intangible costs are not (e.g., increased self-esteem, improved quality of life). For example, a doctor's visit is considered tangible, while “not feeling well” is intangible.
Equipment costs: The total amount paid for equipment (e.g., computers, teaching supplies).
Salaries and benefits: Total funds spent on all personnel, including program delivery staff, program supervisors, clerical and administrative staff and state office staff for fiscal year 1998–1999 (Oct. 1, 1998, to Sept. 30, 1999). Staff merits awarded in July 1999 for work done in 1998 were also included.
Supplies and expenses: Total amount paid for state/county programs to deliver the nutrition education, including the cost of materials, phone, copying, fax, demonstration supplies, teaching materials and utilities.
Travel costs: Total travel costs for county-based program staff and state staff (e.g., teaching, training, meetings, conferences).
The VCE calculated a benefit-cost ratio ranging from 2.16 to 1.00, to 17.04 to 1.00, meaning that between $2.16 and $17.04 was saved in health care costs for every $1.00 that was spent in Virginia on nutrition education programs for low-income residents. We calculated similar benefit-cost ratios for California using program demographics and food-related dietary behaviors from participants enrolled in the state's EFNEP program, utilizing VCE's methodology. In California, the EFNEP program is administered through the UC Division of Agriculture and Natural Resources (ANR).
Virginia methodology
The VCE studies provided detailed background on two important factors used in their methodology: the relationship between diet and chronic disease, and the assigning of monetary values to nutrition outcomes. Cost-benefit analysis was used to measure economic value by comparing “benefits” (monetized in terms of decreased medical treatment costs) with “costs” (actual nutrition education expenses over a set time). The Virginia researchers decided to compute the monetary benefits of EFNEP using the future savings in health care costs accrued by the potential avoidance of certain diseases and conditions among the participants who received nutrition education lessons (Rajgopal et al. 2002).
Both the Virginia and California studies used computer software called ERS-3.01 (Evaluation and Reporting System, version 3.01, National EFNEP Program, USDA; Merrill et al. 1993) to enter the demographic and dietary behavior data of EFNEP participants. The monetized benefits were direct and indirect: The direct benefits were the dollars of postponed health care costs due to the delay of these chronic diseases and conditions, and the indirect benefits were those that increased productivity due to a healthy lifestyle (e.g., fewer sick days) (Rajgopal et al. 2002).

EFNEP provides 4 to 6 weeks of classes in a small-group setting to more than 13,000 low-income California families each year. The program is administered by UC nutrition scientists and educators.
EFNEP for low-income families
The EFNEP program (in both Virginia and in California) teaches low-income families how to purchase, safely prepare and serve a balanced, highly nutritious diet. The program emphasizes the increased consumption of fruits and vegetables, decreased consumption of fat, and improved skills in food safety, preparation and shopping, with the long-range goal of improved health and risk reduction for chronic diseases. The 1990 Dietary Guidelines for Americans were the basis for instruction during the time of this study (USDA/DHHS 1995), although the recently updated version is currently used. Participants receive intensive nutrition education from trained paraprofessional staff for approximately 6 to 8 hours per week over a period of 4 to 6 weeks. Entry and exit dietary-assessment data is collected on every participant enrolled in and graduated from EFNEP.
The study in California was done using EFNEP data from 1998, following the methodology developed by the VCE (using their 1996 results). Virginia used health and labor statistics from 1996 in their assessments of monetary values, utilizing national averages.
During the time period that we studied (1998), California EFNEP served 13,430 enrolled families in 17 counties. County locations varied from urban (Los Angeles, Orange, San Francisco) to rural (Tulare, Stanislaus, Butte). Enrolled participants were ethnically diverse (62% Hispanic, 9% black, 15% white, 12% Asian and 1% Native American) and primarily female (92%). The median age was 25 to 30 years old, and 10% of the women were pregnant. Most participants had at least two children (65%), while 35% of the families had one child and 8% had five or more. Approximately 41% were enrolled in the Special Supplemental Nutrition Program for Women, Infants, and Children Program (WIC), 34% in the Food Stamp Program, 19% in Head Start and 35% in the Child Nutrition Program; all are federal support programs for low-income families. The majority of individuals (98%) met the federal income level for eligibility (at or below 150% poverty level) with 75% of them at or below the 100% poverty level.
All enrolled families completed two records: the EFNEP family record for demographic information and the California food behavior checklist for pre- and post-evaluation data. The California food behavior checklist contained 14 of the same questions used in the Virginia study, plus an additional seven questions. Of the 21 questions, seven had been validated in terms of predicting increased fruit and vegetable consumption (Murphy et al. 2001; Blackburn et al. 2006).
Trained program-delivery staff collected the family record and checklist (both were self-reported, unless the individual was unable to complete the form). The data was collected and entered into the ERS-3.01 computer program, and the results were aggregated.

The link between diet and chronic diseases/conditions, such as heart disease, diabetes and obesity, has been established by scientific research. EFNEP uses a food behavior checklist to evaluate changes in nutrition behavior among participants, such as increases in fruit and vegetable consumption.
The nutrition education lessons were taught weekly in a group setting (four to 10 individuals) over a period of 4 to 6 weeks, which has been documented as effective in promoting positive dietary changes and meeting program goals and objectives (Del Tredici et al. 1988; Joy 2004). Eighty-six percent of the families completed the nutrition-education program lessons and the pre- and post-tests, and were continuing in the program. Of the 14% that did not complete the program, the reasons given included: moved without a contact address (19%), family concerns (12%), took a job/returned to school (12%) and other (47%).
Determining benefits and costs
The VCE methodology included a list of program benefits and costs associated with EFNEP (see glossary), as well as the following three major assumptions.
(1) Diet and chronic disease link
The link between diet and disease has been established by research. For their analysis, the Virginia researchers included heart disease, stroke, hypertension, colorectal cancer, osteoporosis, type 2 diabetes, obesity and foodborne illness. These were studied because they have a known dietary association, and the EFNEP program teaches participants how to reduce their risk and delay or prevent their onset. For California, additional nutrition behavior indicators were included: one question on increasing fiber consumption; two separate questions on increasing fruit and vegetable consumption; three questions on decreasing fat consumption; and one question on decreasing the number of visits to fast food restaurants.
(2) Estimation of diet-related risk
The Virginia study relied on the fact that there is a relationship between diet and chronic disease, which it discussed in detail. Likewise, in the literature there is evidence of this relationship, but it is imprecise. In order to justify this assumption, the Virginia researchers created a formula to quantify this relationship. For example, how much of a role does diet play in the development of colorectal cancer? We can estimate that the link is not 100%, nor is it 0%. Other factors are involved — genetics, lifestyle, age, ethnicity and environmental toxins, as well as factors that have not yet been identified. The Virginia researchers estimated that 35% of the incidence of colorectal cancer is diet-related. For each condition, this estimation was computed based on published reports from sources cited in Healthy People 2000, a publication of objectives aimed at reducing chronic disease by changing lifestyle factors, including diet (DHHS 1990).
(3) Behavior changes for 5 years
Studies have shown that some EFNEP families who attain optimal nutritional behaviors maintain them for 5 years following the nutrition education (Nierman 1986). Documentation for more than 5 years has not been published. Therefore, the Virginia researchers did a sensitivity analysis to modify this assumption.

To establish a cost-benefit relationship, the amount of money saved by delaying a disease or condition for 5 years was estimated. Blood pressure monitoring can help to detect heart disease, hypertension and stroke risks.

TABLE 1 Nutritional behavior and scores of EFNEP participants, filtered pre- and post-test for optimal nutritional change for eight chronic diseases/conditions
Monetizing educational benefits
For the California study, benefits were constructed and calculated in the same way as in Virginia. Both states use the same nutrition-education delivery approaches and teach enrolled low-income participants how to choose and prepare a healthy diet (Lambur et al. 1999). Both programs have similar behavioral results and associated costs.
The VCE monetized direct, tangible benefits (Lambur et al. 1999) using costs compiled from Healthy People 2000 (USDA/DHHS 1995). National figures computed by the Virginia researchers were used for treatment costs. Although California medical costs would likely be much higher than the national average, we used the same kind of cost-benefit data as the VCE in order to provide a more conservative benefits estimation. Similarly, the intangible benefits were calculated using the VCE methods reported in their protocol. The VCE used a lost-workdays approach for the indirect cost-benefits, based on worker productivity (e.g., health care savings as well as the value of the work lost due to illness).
The tangible benefits of nutrition education were the costs saved by preventing or delaying the onset of a disease or condition. The reason that the delay is of value is because a given amount today is worth more in the future. We used 5% for the discount rate, as Virginia did. Virginia developed a formula for calculating both the direct and indirect benefits, which we utilized in our study (see box).
Nutritional behaviors as benefits
Nutrition behaviors taught in EFNEP (Rajgopal et al. 2002) to prevent or delay diseases/conditions were used retrospectively to calculate the benefits for each of the eight conditions/diseases studied (table 1). The California results were similar to the Virginia results except for the following: (1) the Virginia researchers collected data on infant mortality, but we did not use this information in our analysis because California EFNEP does not collect any medical data on participants; and (2) the California food behavior checklist included all the questions used in Virginia, plus seven additional ones.
In order for participants to be included in the California analysis, they had to be practicing “optimal nutritional behaviors,” and stringent conditions were applied. The rigor of the analysis was increased with both filtering of the Virginia questions as well as the seven additional questions from the California food behavior checklist. Only EFNEP graduates who achieved the greatest benefit (a score of 4 or more) in all the dietary practices criteria were considered as practicing optimal nutritional behaviors. All other graduates were eliminated from the analysis (including those who practiced the optimal behaviors at pre-test).
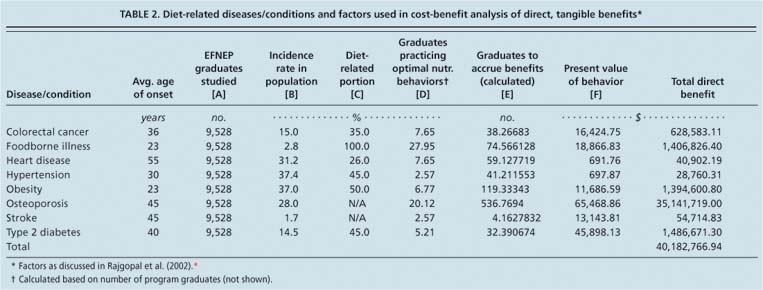
TABLE 2 Diet-related diseases/conditions and factors used in cost-benefit analysis of direct, tangible benefits⋆
Responses were filtered by satisfying all the criteria simultaneously. For example, the original sample size for California was 20,999. After removing participants who did not complete either the pre- or post-survey, the sample size was 9,528. For example, with heart disease, of the 9,528 who completed the pre- and post-tests, only 150 answered all eight questions with a score of 4 or more. This was 7.65% of the California population who received EFNEP lessons (table 1). The only participants used in the calculations were those whose behaviors could reasonably be attributed to the nutrition education. Causally connected participants who improved in their behaviors (e.g., moved from not practicing to sometimes practicing) but did not achieve the highest score were screened out of the analysis.
Cost-benefit calculations
We used the same values as Virginia for the cost-benefit analysis formula because our data was collected at about the same time as theirs, and for the purposes of this study represented national averages.
We calculated the benefits as follows: For direct, tangible benefits, if the disease/condition could be prevented or delayed for 5 years, then the benefit was the amount of money saved by the delay in treatment costs for 5 years (using a 5% discount rate) (table 2). For indirect, tangible benefits, calculations were done only for those diseases/conditions where data was available (table 3). (Virginia used Bureau of Labor Statistics data from 1995 for these analyses.)
Calculation of direct benefits
Formula: A x B x C x D = E; E x F = benefits⋆
A = Number of EFNEP graduates studied per year
B = Incidence rate (%) of disease/condition in general population (estimation)
C = Incidence rate of disease related to dietary change (estimation)
D = Percentage of graduates practicing optimal nutrition behaviors (calculated/filtered)
E = Estimated number of graduates to accrue benefits (calculated: A x B x C x D = E)
F = Present value of “benefit” for disease/condition (estimation)
In general, the population served by EFNEP is less likely to be employed than the general population represented by this data. One of the sensitivity analyses was done to correct for this generalization. The benefits of postponing pain and suffering were not included in the analysis, though this would be a very large number.
To select participants practicing optimal nutrition behaviors, a cost-benefit method was used. SPSS (Statistical Package for Social Sciences) was used to analyze results for each of the diseases/conditions studied. All participants who met the optimal behavior at the pre-test were eliminated from the study to increase the likelihood that the improved behavior was a result of the nutrition education.
California EFNEP costs, benefits
The cost of delivering nutrition education to California participants was derived from the California EFNEP budget, using all tangible costs. The estimated total direct costs for fiscal year 1998–1999 were $2,543,667, and the estimated indirect costs were $236,883 (cost definitions and calculations available from authors).
The initial benefit-cost ratio for California was 14.67 to 1.00, meaning that for every $1.00 spent on EFNEP, $14.67 was saved in future medical costs (initial cost calculations available from author). Even though this result seems high, the researchers used stringent conditions to apply both the benefit calculations and the cost estimates. In addition, our initial result was similar to that calculated by the Virginia researchers.
A number of different values for the critical variables were used for these analyses; economists call this sensitivity analysis. Therefore, the cost-benefit results would change as values for these variables change. We used sensitivity analyses to quantify how the cost-benefit calculation changed, using VCE's protocol. The following four sensitivity analyses were done to be conservative and to prevent overstating results (table 4).
Low-income populations. The Virginia study reported that the incidence rates used for diseases/conditions were for the general population, and there was reason to believe that the incidence rate in low-income populations such as EFNEP families would be higher. In Healthy People 2000, “low income” is noted as a special risk factor for chronic diseases. Although the Virginia researchers recalculated their cost-benefit to correct for this possible disparity, we decided to leave the initial incidence rate unadjusted. The incidence rate used in our analysis is likely to be conservative for low-income individuals.
Diet for stroke and osteoporosis
The Virginia benefit calculations were based on the assumption that there was a 100% relationship between diet and disease for stroke and osteoporosis. The initial analysis used 100% (e.g., everyone will get this condition at some time) for the incidence rate, since there was no actual data available. However, 100% is inaccurate for both of these diseases. The first sensitivity analysis done on the Virginia and California data used a 50% incidence rate for both stroke and osteoporosis, then an additional incidence rate using 25% as an estimation. For California, the revised benefit-cost ratio using 50% was 8.34 to 1.00, and using 25% it was 5.17 to 1.00 (table 4).
Osteoporosis benefits
The California and Virginia studies both had the largest tangible benefit in their osteoporosis calculations. Dietary factors play a role in delaying osteoporosis for 5 years. The EFNEP population is mostly female (92%) and younger (25 to 30 years old), which would justify the assumption that dietary changes could reduce the risk of osteoporosis later in life. However, there are a number of other risk factors for osteoporosis that are not related to nutrition (e.g., genetics, hormones and smoking), and the age at which risk prevention is reduced may be much younger. The EFNEP intervention, however, would provide a positive benefit for reducing the risk of osteoporosis. Since the sensitivity analysis for diet and osteoporosis (previous paragraph) reduced the incidence to 25%, an additional reduction did not seem warranted.
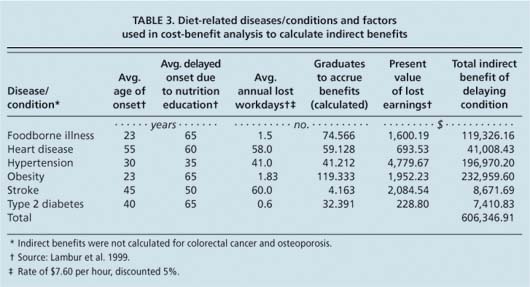
TABLE 3 Diet-related diseases/conditions and factors used in cost-benefit analysis to calculate indirect benefits
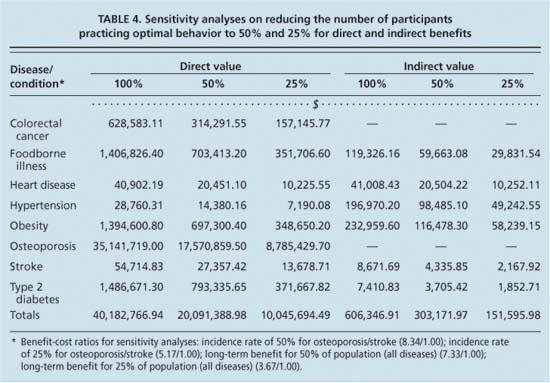
TABLE 4 Sensitivity analyses on reducing the number of participants practicing optimal behavior to 50% and 25% for direct and indirect benefits
Long-term benefits. The long-term benefits of EFNEP have been studied for at least 5 years following program participation, but there are no studies to date showing that the benefits are life-long. The Virginia study did two sensitivity analyses to correct for this: they assumed that 50% of the population that showed optimal improvements would maintain them over 5 years, and that 25% of the population would maintain them for 5 years. In California, the same two analyses were done: for 50% the benefit-cost ratio was 7.33 to 1.00, and for 25% the ratio was 3.67 to 1.00 (table 4).
As in all studies using data that is self-reported, and due to data collection procedures in the field, the potential for bias from confounding variables can never be completely eliminated.
Good public policy
Our initial benefit-cost ratio for California was 14.67 to 1.00, and our additional sensitivity analyses provided a range of results from 8.34 to 1.00, to 3.67 to 1.00. The bottom line is that for every dollar spent on nutrition education in California, at least $3.67 is saved on medical treatment costs.

In addition to publishing nutrition guidelines such as the Food Guide Pyramid (updated in 2005), USDA spends $255 million annually on direct nutrition education for low-income consumers. The study provides evidence that this spending is cost-effective.
We believe that the benefit-cost ratios presented in our study are low. Several decisions ensured that our estimates were conservative, including: (1) using stringent criteria to determine the optimal nutrition behaviors associated with the delayed onset of several chronic diseases; (2) reducing the incidence rate for osteoporosis and stroke; (3) using national averages for treatment costs instead of California's higher costs; (4) reducing the population that practiced the optimal behaviors to 25%, to adjust for the 5-year time frame of treatment delay; and (5) reporting benefit results for individuals only when these benefits would be expected to extend to other family members as well.
Nutrition education is now widely acknowledged as an important component of the U.S. Department of Agriculture (USDA) budget. The current EFNEP budget is larger than it was in 1998, more than $65 million nationally. At the same time, the Food Stamp Nutrition Education (FSNE) program also targets food stamp-eligible clients with a budget of more than $190 million, for a total national USDA nutrition education budget of about $255 million.
Based on our findings and those of the Virginia researchers, nutrition education appears to be a good economic investment for the country, especially with an underserved population likely to have poor eating habits and higher risk for numerous chronic diseases and conditions. We believe this data provides strong evidence that nutrition education programs are cost-effective and that continuing to fund them is a sound investment and good public policy.
Tribute: Vijay Pradhan

Vijay Pradhan
Two of the authors would like to recognize the outstanding contributions made by Vijay Pradhan, who passed away after the study was completed. He implemented the statistical analyses for this study, looking at all the possible criteria and meticulously working with multiple variables. Pradhan spent 2 years on the design, development and implementation of the analyses for California, and he met with the other authors regularly to discuss the results. His dedication to the completion of the study was a reflection of his character; he was a devoted, concerned, caring and committed researcher. He was a self-motivated professional who took pride in his achievements. Vijay Pradhan was a man of great integrity and a valuable friend.
Cost-benefit analysis conducted for nutrition education in California

