


All Issues
California agritourism operations and their economic potential are growing
Publication Information
California Agriculture 65(2):57-65. https://doi.org/10.3733/ca.v065n02p57
Published April 01, 2011
PDF | Citation | Permissions
Abstract
More than 2.4 million visitors participated in agritourism at California farms and ranches in 2008. They stayed at guest ranches in the foothills, picked peaches in the Sacramento Valley, played in corn mazes up and down the state, shopped at on-farm produce stands along the coast, held weddings in fields and vineyards from coast to mountains, and experienced myriad other agriculture-related tourism activities. The UC Small Farm Program conducted the first statewide economic survey of California agritourism operators to better understand their goals, needs and economic outlook. University researchers from several other states provided input and sample data from state surveys conducted between 2000 and 2007. This information will help to target outreach and address current and emerging challenges.
Full text

Many California growers offer the public “agritourism” opportunities as a way of improving their farm's visibility and profitability. Above, visitors enjoy a gourmet “Dinner in the Barn” at the Romano Family's Sierra Valley Farm in Plumas County.
The pressures of urbanization and shrinking profits have led California farmers to seek alternative approaches for maintaining profitable agricultural enterprises. “Agritourism” includes any income-generating activity conducted on a working farm or ranch for the enjoyment and education of visitors. It includes the interpretation of the natural, cultural, historical and environmental assets of the land and people working on it (George and Rilla 2008).
Agritourism is growing nationwide as farm operators in many states offer activities as a way to diversify and increase their profits (Brown and Reeder 2007). In 2002, the U.S. Department of Agriculture (USDA) Census of Agriculture began collecting agritourism statistics. In 2007, 685 California farms reported a total of $35 million in revenue related to agritourism (USDA 2009). However, the USDA definition of agritourism is extremely limited; it includes some recreational or educational experiences occurring on farms, such as hay rides and pumpkin patches, but does not explicitly include other major on-farm activities such as festivals, accommodations or direct sales of products.
The USDA Economic Research Service's Agricultural Resource Management Survey (ARMS) (USDA 2004) was used as a data set for the agency's 2007 report on farm-based recreation (Brown and Reeder 2007). The authors used the terms “farm-based recreation” and “agritourism” interchangeably but acknowledged that because ARMS data on farm-based recreation does not describe hospitality services and direct sales of on-farm products, their estimates are conservative. (Both the Census of Agriculture and ARMS data would be more useful if the USDA developed and applied a standardized definition of agritourism activities.)
Other national data sources also support the economic development potential of agritourism. Nearly two-thirds of all U.S. adults (87 million) have taken a trip to a rural destination within the last 3 years (Miller 2005). USDA estimates that more than 82 million people, including approximately 20 million youth and children under age 16, visited farms during a 1-year period between 2000 and 2001. U.S. Fish and Wildlife Service reports indicate that in 2006 more than 6.2 million wildlife and nature tourists spent more than $7.8 billion in California (Leonard 2008).
Building a survey
Nationally, few systematic statewide studies have evaluated the agritourism sector (Ryan et al. 2006; Bruch and Holland 2004; Kuehn 2002), and none have been conducted in California (with the exception of the California wine industry, which attributes $2 billion to tourism-related sales [The Wine Institute 2006]).
To help fill this void, chairs of the UC Cooperative Extension (UCCE) Agricultural Tourism Workgroup convened a survey team, which included the director of the UC Small Farm Program, academics and graduate students. The team members identified key areas that would enhance a general understanding of California's agritourism sector and improve the quality of UCCE outreach and extension. The survey contained fill-in-the-blank and multiple-choice questions about location, products and services, motivation, advertising, management, profitability, visitation and future plans. It also included open-ended questions, giving agritourism operators the opportunity to share issues, concerns, challenges and successes. The survey asked respondents to answer financial and management questions based on their experiences in 2008.
Historically, one barrier to conducting a systematic analysis of the agritourism sector in California has been the lack of a comprehensive database of farms engaged in agritourism. The survey team built a database from addresses contributed by UCCE academics, lists of agritourism operators and workshop participants, addresses from local marketing campaigns, and other relevant agency lists and databases. The new database also included small, family-owned wineries (which produce fewer than 10,000 cases annually) that were engaged in non-wine-related agritourism activities such as on-farm sales of jams, herbs, olive oil, grassfed beef and other value-added products.
Despite our attempts to be comprehensive, the resulting database of 1,940 farm businesses most likely does not include all agritourism operators in the state. As such, our resulting sample is not completely random, and therefore we are not able to generalize our findings to the entire agritourism sector. The total number of visitors is likely orders of magnitude larger, especially when compared with other visitor figures reported in less populated states. Nonetheless, our findings provide valuable insights into the political, social and economic context, and characteristics of agritourism in California.
After developing and piloting the survey, the team worked closely with the UC Small Farm Program to implement it. On Jan. 10, 2009, the survey was mailed to operators in the database. A second mailing went out to all nonrespondents on March 10, 2009. Due to budget constraints, the team did not send any further follow-up reminder letters. A total of 554 farm businesses (29%) returned the survey, of which 222 indicated that they were not currently operating agritourism businesses. Our analysis is based on the 332 operators currently participating in agritourism activities.
Operator motivation and activities
Given the tens of thousands of small farms in California and the competitive pressure on small farmers due to agricultural restructuring, we hypothesized that the financial need to diversify would be a key factor in motivating farm and ranch operators to open up to visitors. Indeed, 75% of our respondents cited the need to increase profitability as a reason for entering into agritourism. Other economic reasons included “to market farm products” (62%) and “to provide an employment opportunity for family members” (22%).
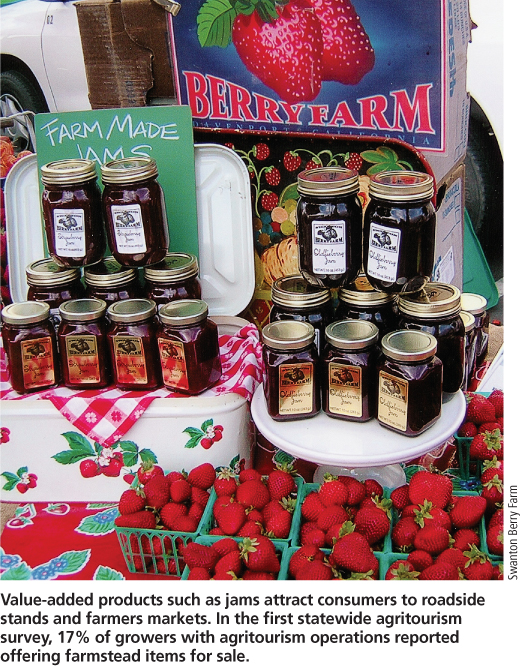
Value-added products such as jams attract consumers to roadside stands and farmers markets. In the first statewide agritourism survey, 17% of growers with agritourism operations reported offering farmstead items for sale.
Profit and employment opportunities were not the only reasons cited. Three-quarters of those who entered the agritourism sector for financial or employment reasons also did so because they “wanted to educate visitors,” “enjoyed working with people” or wanted to provide “outreach to the community.” Only 15% started an agritourism venture solely for outreach or educational purposes, with no financial motivation. These findings support other research suggesting that a complex set of economic and social factors motivate farmers to pursue agritourism (Mace 2005).
Operator characteristics.
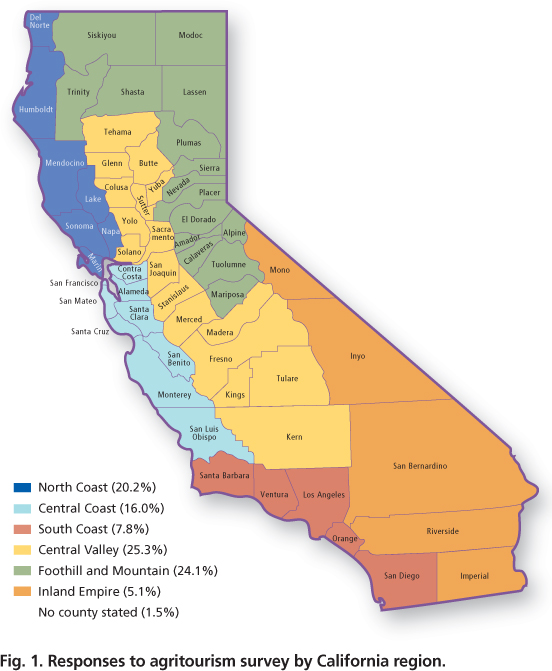
Almost half (43%) of the agritourism operators surveyed had been in the sector less than 10 years. Respondents were grouped into six regions in California, with the Central Valley region having the most operations (25%) and the Foothill and Mountain region close behind (24%) (fig. 1).
Agritourism activities.
Agritourism operators in California were engaged in a wide range of activities, offering direct sales (78%), tours or lectures (81%), demonstrations, lessons or participant experiences (69%) and special event facilities (51%) (table 1). In general, agritourism operators made more money from direct sales of agricultural products (45% on average of all agritourism gross income) than from other activities. The most common direct-sales activity was selling produce, nuts or flowers at a farm stand (38%).

The most common agritourism activity (51%) was hosting school field trips, with only 17% charging a fee. With the exception of weddings, overnight stays, horse or wagon rides, and fishing or hunting, less than half of agritourism operators participating in each service activity charged a fee, underscoring the public-service, educational and marketing/outreach nature of these activities.
While the low percentage of operators charging fees for school field trips is not surprising given the public-service nature of the activity, the fact that many other services are provided for free is puzzling. Although service activities such as tours already have a strong marketing angle related to direct sales, other activities such as cultural festivals or farm demonstrations could potentially serve as a source of income. One operator commented, “We have not developed agritourism into a moneymaking operation. Most visitors are nonpaying customers. We are moving in the direction of having paid activities and stays.”
Promotional strategies
There is no single formula for marketing success in agritourism (Chesnutt 2007). Operators estimated that on average 88% of their visitors in 2008 were from California, with 50% coming from the same county. This finding is consistent with the state tourism and travel commission figure that 85% of visitors were from in-state in 2008 (CTTC 2008). On average, only about 3% of visitors were from Canada or other countries.
More than half (51%) of the businesses responding to the survey had fewer than 500 visitors in 2008, while 12% hosted more than 20,000 visitors. October was the highest volume month, with activities such as pumpkin patches, apple picking, winery tastings and tours, corn mazes, harvest festivals and end-of-summer fruit and vegetable purchases.
Types of promotion.
Word of mouth was the leading form of promotion used by respondents (97%) to reach customers (fig. 2). Signs outside of businesses (81%), business cards/brochures (76%) and websites (78%), along with listings in regional guides (74%), were the next most popular forms of marketing. The next tier of marketing included feature stories in a newspaper or magazine (63%), agricultural organizations (57%), paid advertising (55%), chamber of commerce (46%), visitor's bureau (39%), direct mail (37%) and business newsletters (32%).

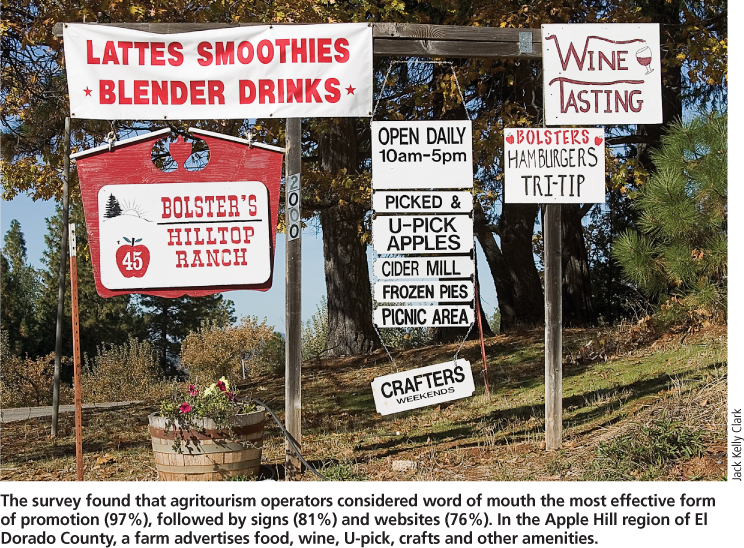
The survey found that agritourism operators considered word of mouth the most effective form of promotion (97%), followed by signs (81 %) and websites (76%). In the Apple Hill region of El Dorado County, a farm advertises food, wine, U-pick, crafts and other amenities.
Effectiveness.
Respondents were asked to rate the effectiveness of their promotional strategies on a scale from 1 to 5. Seventy-three percent rated “word of mouth” as effective or highly effective (4 or 5), followed by websites (68%) and feature stories (69%).
More than 80% of respondents used some form of signage. A few people expressed frustration with county zoning restrictions and state and federal “scenic road” designations that prohibit the use of signs. Some suggested special considerations for small farmers.
Websites/Internet.
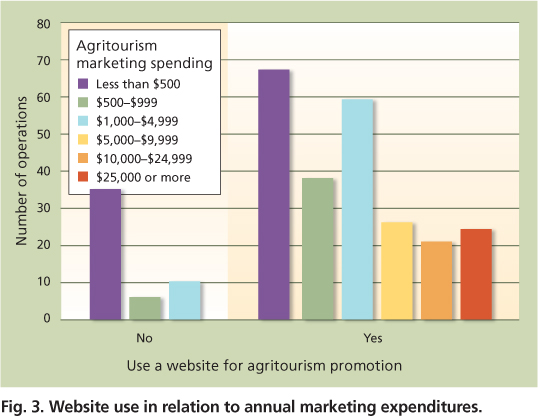
The Internet is often the first source of information for vacation plans or purchasing items, making a website the first impression that a business makes on the consumer (Klotz 2002). Regardless of how much money businesses allotted for marketing and promotion, the vast majority (78%) (n = 311) had a website. About two-thirds of operators spending less than $500 on all marketing efforts had a site (fig. 3). Comments from respondents indicated that they were very satisfied with results generated from their websites. One respondent commented, “The Internet is proving to be the biggest PR tool we have. Lots of Bay Area families came after a lady posted a rave review of us.”
A University of Delaware study (German et al. 2008) found that there may be opportunities for producers to improve their profitability by adding e-commerce to their websites in order to attract new and returning visitors. More than 65% of the 98.3 million travelers to California made their arrangements online in 2004 (CTTC 2007).
Challenges to agritourism growth
Agricultural tourism supports local farms and ranches as well as their surrounding communities by generating revenue, but diversification also presents challenges. Zoning, permitting, environmental health regulations, liability and insurance issues were the leading impediments to farmers and ranchers who wanted to expand their operations to include agritourism (fig. 4). Comments from respondents, regardless of region, indicated that they were frustrated and overwhelmed with their county's policies and procedures, and the expenses related to initiating or expanding an agritourism enterprise on their farm or ranch.

Fig. 4. Major challenges rated 4 or 5 by California agritourism operators, on a scale of 1 (not a problem) to 5 (very challenging).
Twenty-nine percent (n = 97) indicated that they had acquired a use permit from their county for an agritourism operation. Among these respondents, 69% responded negatively (expensive, difficult, slow) to questions about the permitting process, while 31% responded with positive or neutral comments (workable, not complicated, officials very cooperative). These comments echo the frustration expressed by operators who participated in a 2002 survey regarding the permitting process for agritourism in 10 California counties (Keith et al. 2003).
Only 24% of the respondents had a business plan for their entire farm or ranch, but of those who did, 91% included their agritourism operation. Those with business plans for their entire farm were about twice as likely as those with no business plans to have agritourism incomes above $100,000.
When asked about liability insurance and other risk management practices, 87% reported having liability insurance, and 90% of the insured were covered for $1 million or more. Several people commented about the cost of liability insurance and expressed concerns about being sued. Although most of the respondents carried insurance, operators rated liability and insurance issues as major challenges, along with permitting, zoning and other regulations and legal constraints.
Farmers and ranchers share the problems voiced by California agritourism operators across the nation. However, other states are moving forward on programs to help operators overcome challenges, and they may be useful models for California. For example, Colorado and Tennessee are appropriating funds for the promotion and development of agritourism, and Georgia and Missouri give tax benefits to agritourism operators. At least 19 states have enacted statutes that address agritourism, ranging from tax credits to zoning requirements to liability issues (Mirus 2009).
Profitability of agritourism
Although 14% of the survey respondents had annual revenues of $1,000,000 or more, 68% fit the USDA definition of a small farm, having annual gross revenues of $250,000 or less in 2008. Almost half (48%) of the operators reported less than $10,000 in gross revenues from their agritourism operations in 2008, while 21% had revenues of $100,000 or more (table 2).
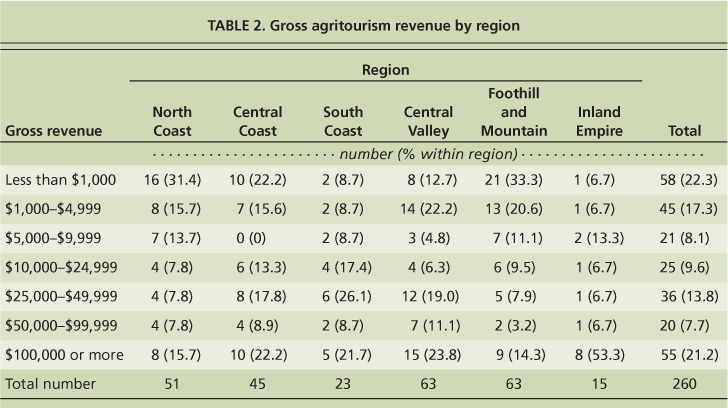
While the number of Inland Empire respondents was relatively small, the region had a considerably higher proportion of operations with gross revenues of $50,000 or more (60%). Conversely, the North Coast (61%) and Foothill and Mountain (65%) regions had higher proportions of small agritourism operations with gross revenues under $10,000. Differences in the proportion of operations within gross revenue categories among regions were statistically significant at the 0.05 level.
A primary activity was defined as one generating more than 50% of an operation's total agritourism revenue. The primary activities for which operators were most likely to have gross agritourism revenues of $50,000 or more were corn maze/pumpkin patch (44%), nature activities (43%), retail sales of agricultural products (33%) and events (25%). Differences in the proportion of operations within gross revenue categories among regions were statistically significant at the 0.05 level (differences in observations across all categories were tested using the Pearson chisquared test).
Agritourism operators were asked to rate the profitability of their operation on a 7-point scale, with “1” indicating “not at all profitable” and “7” meaning “highly profitable.” One-fourth considered their agritourism operations to be at least “fairly profitable” (rated 5 or higher), while 16% rated their operations as “not at all profitable.” The mean profitability rating was 3.3. However, generating profit was not a direct objective for some agritourism operations. One operator commented, “Even though this business only breaks even, we continue on because I consider it a marketing arm of our other business.” Another operator noted, “Agritourism is primarily for education on herbs. Profits come from [sales of] herbal products produced on the farm.”

Most agritourism operators said that they like interacting with visitors to their farms. Those surveyed had an estimated total of 2.4 million visitors in 2008. At Full Belly Farm in Yolo County, visitors tour the farm during the Hoes Down Harvest Festival.
Agritourism operators’ assessments of their profitability increased with gross revenues, and the differences were statistically significant at the 0.01 level. More than half (53%) of the operators with agritourism revenues of $50,000 or more considered their operations at least “fairly profitable,” compared to 15% with agritourism revenues under $50,000.
Respondent assessments of their operation's profitability varied by region, and the differences were statistically significant at the 0.05 level. Similar to gross revenues, a noticeably higher proportion of operators in the Inland Empire rated profitability as at least a 5 (fairly profitable) (40%). Conversely, North Coast operations were most likely to rate their profitability as 3 (somewhat profitable) or lower (67%), followed by the Foothill and Mountain region (62%). The types of agritourism activities most prevalent in these low-revenue/low-profitability regions should be investigated; these operations appear to have the greatest potential to benefit from consultation regarding business planning and marketing. Profitability assessments varied widely by primary activity (fig. 5).
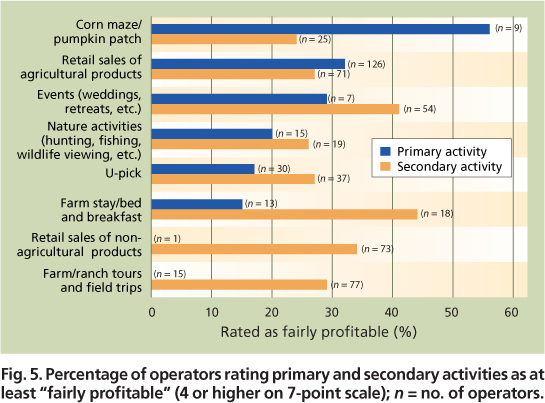
Fig. 5. Percentage of operators rating primary and secondary activities as at least “fairly profitable” (4 or higher on 7-point scale); n = no. of operators.
Thirty-two percent of operators rated retail sales of agricultural products, the largest activity category, as at least “fairly profitable,” compared to 27% of operators for whom retail sales were a secondary activity. Retail sales of agricultural products and corn maze/pumpkin patch were the only activities rated more profitable as primary than secondary activities. Those for whom tours and field trips were secondary activities rated their profitability considerably higher than those for whom they were primary activities.
Creating jobs and growth
In general, tourism is considered to have both negative and positive economic impacts. Critics contend that tourism often generates low-paying, seasonal job opportunities; however, if tourism can attract high numbers of seasonal and permanent residents, then it is usually considered to have positive impacts on a community (Reeder and Brown 2005).
Employee numbers and pay.
In our survey, agritourism operators reported their employee numbers (excluding themselves) based on categories of hours worked. One-third of the operations had employees who worked at least full time primarily or exclusively for the agritourism operation; a similar proportion had employees who worked between 21 and 39 hours a week. More than half (54%) of the operations had employees who worked half time or less, primarily or exclusively for the agritourism operation; some of these operations also had full-time employees. Overall, California operations surveyed averaged 6.3 employees (both full-and part-time) hired to work mainly or only for agritourism activities.
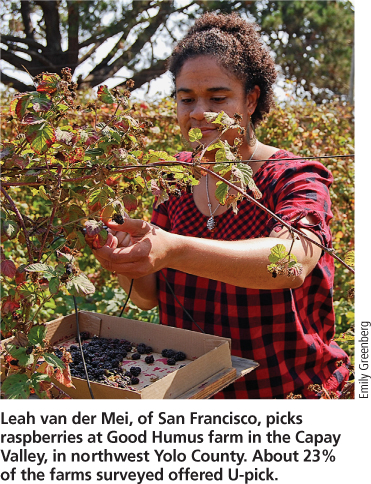
Leah van der Mei, of San Francisco, picks raspberries at Good Humus farm in the Capay Valley, in northwest Yolo County. About 23% of the farms surveyed offered U-pick.
In addition, more than half of the operations had employees working mainly for their farming/ranching operation who also pitched in on agritourism activities; on average, there were 2.3 such employees per agritourism operation. Operations with no employees were included in calculating the reported mean values; however, the mean calculation did not include the “missing cases” that occurred frequently because respondents checked a particular employment category but did not indicate the number of employees for that category.
Overall, 83% of the operations had paid employees, with an average of 11.6 per operation. This value is significantly higher than the sum of the average numbers of employees in the previously discussed categories (hired primarily or exclusively for agritourism activities, or for farming and ranching activities). This disparity is due to the fact that there were many missing cases that occurred when adding together the number of employees for the two categories. Not surprisingly, on average half of all agritourism operations hired one family member, meaning that there were 10.6 nonfamily employees per agritourism operation.
It is not uncommon for agritourism operations to have multiple employees. In our survey, 17% had no employees and only 5% had just one employee; but 13% had more than 10 employees and 8% had more than 20 employees. (Forty-five percent of respondents checked a specific employee category but did not report the number of employees.)
In the largest primary-activity category (retail sales of agricultural products) there were 8.4 jobs per operation on average, despite the fact that 32% of such operations reported no employees. One-fourth of the retail operations had more than 10 employees.
Wages and salaries.
Slightly more than half of the operations (53%) had no employees or paid less than $5,000 in employee wages, almost one-fifth (19%) paid between $10,000 and $49,999 in salary expenses, and 13% paid more than $100,000 per year (fig. 6).
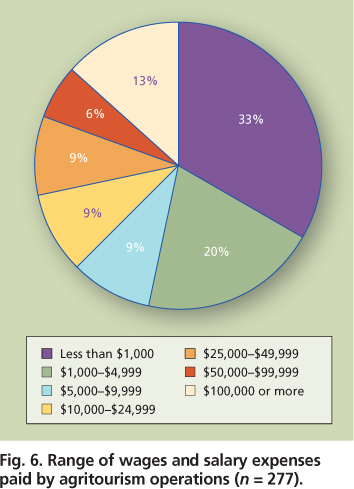
Since this wage data was categorical, total salary expenses were estimated using the midpoint of each category as the observed value, along with $1,000 for the lowest and $100,000 for the highest category. This procedure generated average wage expenses of $24,489 per agritourism operation, probably a considerable underestimate given the relatively large proportion of operations in the highest wage-expense category.
The economic effects of agritourism are apparent. Even though many of the agritourism operations hired employees at least part time (83%), agritourism is adding additional economic activity to rural communities. The average $24,489 in wages paid is likely spent within the community and sustains other local businesses.
Growth trends.
When asked about their agritourism plans over the next 5 years, the majority of operators (64%) indicated that they expected to expand or diversify. Almost a quarter (23%) planned to maintain their current income level. Only 4% expected to go out of business.
Not surprisingly, growth plans appeared to be correlated with profitability. Seventy percent of the operators who rated their enterprises at least “fairly profitable” planned to expand or diversify, compared to 53% who rated theirs “not at all profitable” or “slightly profitable.”
There were differences across regions regarding growth plans. The highest proportions of operations planning to expand or diversify were in the South Coast, Inland Empire and Central Valley regions (fig. 7A).
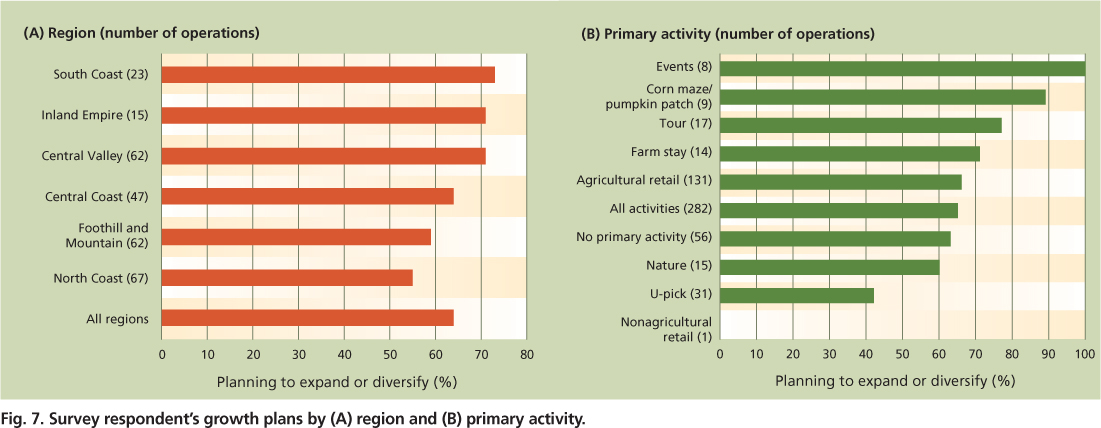
There were also differences regarding growth plans among primary activities (P < 0.05) (fig. 7B). Events, corn mazes/pumpkin patches and tours were the primary activities with the highest proportions of operators planning to expand or diversify.
These differences in growth plans indicate a potential need for further information about agritourism management. Specifically, networking and business development consultation may be particularly beneficial for agritourism operators in the North Coast region and Foothill and Mountain region, and for operators of U-pick operations.
A vital strategy
Agritourism is clearly not an economic panacea for all of agriculture, considering the small proportion of California's 80,000 farm operators engaged in such activities. But the survey results revealed that agritourism is a vital strategy for diversifying and boosting profit for a small but significant number of California farms. The trend seems to be growing, as many operators planned to expand their agritourism operations. In 2008, more than 2.4 million Californians (the sum of visitors estimated by 257 survey respondents) learned about and experienced firsthand the unique attributes and contribution that agriculture provides to the state, and this figure is likely to grow as new data becomes available.

More than 80% of the surveyed farms that offered tours to school groups did so for free. Rosemary Nightingale shares herb lore with young visitors to Squaw Valley Herb Gardens.
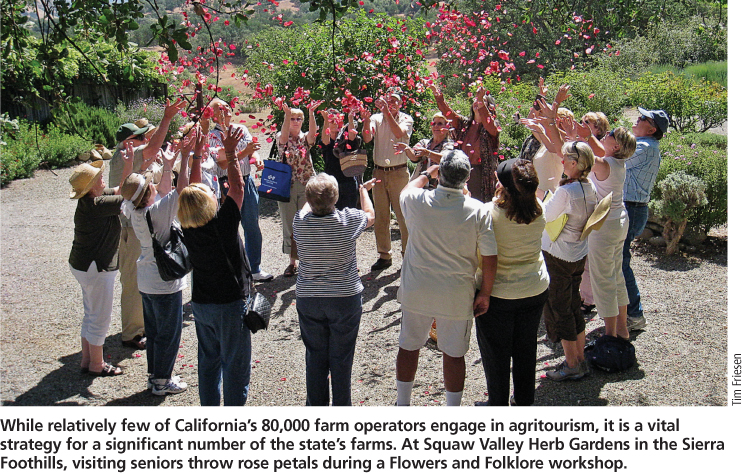
While relatively few of California's 80,000 farm operators engage in agritourism, it is a vital strategy for a significant number of the state's farms. At Squaw Valley Herb Gardens in the Sierra Foothills, visiting seniors throw rose petals during a Flowers and Folklore workshop.
We confirmed that for most operators, both social and economic factors are important, and different motivations are dominant for different types of farm landholders at different stages in farm, family and business cycles (Ollenburg and Buckley 2007). Most respondents stated that they liked educating and interacting with visitors, possibly suggesting that farmers engaged in agritourism possess particular skills and personality traits. While observable in case-study research, most data on operator characteristics is anecdotal (Rilla 1998; Hilchey 1993). We found that agritourism farms are entrepreneurial in terms of the services and value-added products provided to others, and they are actively involved in marketing their products, with the vast majority using the Internet to reach customers.
In 2008, more than 50% of agritourism operators making more than $50,000 described their venues as profitable. Pumpkin patches and on-farm sales of products were their most profitable activities. Almost equal numbers of operators had revenue less than $1,000 and more than $100,000, and 43% of small farms earned $25,000 or more in agritourism income, which could account for 10% of the farm's total income.
Operators indicated a desire for business planning to improve success. Marketing and management assistance to improve fee revenues for activities currently provided gratis, and assistance with effective promotion, could also increase the bottom line.
A clearer picture of the overall economic impact of agritourism in California will require more work to define the operator database and capture more accurate data from the USDA Census of Agriculture and ARMS relating to on-farm income derived from agritourism activities such as farm stays, U-picks and farm stands. Continuing research on growth trends and profitability will help local governments and farm operators to track success.
The survey identified permitting, environmental health regulations, liability and insurance issues as the most critical challenges facing current and future agritourism operators. As local governments update countywide plans and zoning and development codes, revisions to accommodate on-farm agritourism businesses will help to support and sustain these small farms (see sidebar). Farm advocacy groups may want to follow the examples of other states in advocating for legislation to reduce liability exposure.
California counties adapt permitting and regulations for agritourism
Penny Leff, UC Small Farm Program
P. Leff is Agritourism Coordinator, UC Small Farm Program.
California's 58 counties bear the primary responsibility for permitting and regulating agritourism operations on agricultural land within their boundaries. The counties often struggle with creating allowances and ease of permitting for agritourism businesses while ensuring that agritourism is a supplemental (rather than primary) activity on a commercial farm or ranch. Regulations also must ensure that agricultural production and local residents are not adversely affected by tourism. Some counties have recently changed their general plans, zoning ordinances and staffing assignments to encourage agritourism and have created guides to agritourism permitting.
The Lake County general plan includes Goal AR-3, “To provide opportunities for agritourism that are beneficial to the county and its agricultural industry and are compatible with the long-term viability of agriculture.” The county wide general plan in Calaveras County (Foothill and Mountain region) specifically allows, by right, on-site sales and tasting, and directs that the definition of agricultural operations allowed should be broadly construed. Solano County (Central Valley region) has designated new zoning that encourages agritourism in Suisun Valley, one of 10 county regions defined in its general plan.
Mariposa, Placer and El Dorado counties (Foothill and Mountain region) have involved farmers and ranchers on advisory committees that created ordinances to streamline permitting for agritourism operations while limiting the extent of allowed activities in proportion to the size of the primary agricultural operation.
Potential agritourism operators often complain about the lack of coordinated information from different county regulatory departments. To address this problem, Marin County (North Coast region) contracts with UC Cooperative Extension (UCCE) for an “agricultural ombudsman” to assist applicants with agriculture-related permitting. Marin County UCCE and Placer County staff created plain-language guides for farm-stay operations. Yolo County has created an Agricultural Permit Manual that describes all the permits that may be needed for various types of agritourism operations. More coordination among county departments and between counties would ease the regulatory burden on agritourism operators.

Regulators must strike a balance between promoting agritourism and ensuring that local residents are not adversely affected by traffic and other impacts. Above, a toddler visits Dave's Pumpkin Patch in West Sacramento.
California agritourism operations and their economic potential are growing

