


Strawberry Plant Nutrient Sufficiency Levels Revised
It has been more than 30 years since UC published strawberry leaf nutrient diagnostic guidelines (Publication 4098, ‘Strawberry deficiency symptoms: a visual and plant analysis guide to fertilization’, released in 1980). In the years since that publication, varieties, production practices and yield expectations have changed considerably. In 2010 we began a project, funded by the California Strawberry Commission, to reevaluate leaf and petiole nutrient sufficiency ranges for day-neutral strawberries. With the cooperation of many berry growers in the Watsonville-Salinas and Santa Maria areas we collected leaf and petiole samples from more than 50 ‘Albion’ fields over the past two production seasons. In each field samples were collected 5 times over the production season, from early spring through September, to document the nutrient concentration trends from pre-fruiting to post-peak production. Leaf samples were analyzed for total concentration of nitrogen (N), phosphorus (P), potassium (K), calcium (Ca), magnesium (Mg), sulfur (S), zinc (Zn), manganese (Mn), iron (Fe) and copper (Cu). Petioles were analyzed for NO3-N, PO4-P and K concentration.
After the season cooperating growers provided yield information, which allowed us to categorize the fields as being ‘high yield’ or 'low yield’. We then applied a process called DRIS (Diagnosis and Recommendation Integrated System) to mathematically evaluate the difference in nutrient concentrations as well as nutrient ratios between high yield and low yield fields. This process allowed us to identify which of the high yield fields were ideally balanced nutritionally. From this group of nutritionally balanced, high yield fields we were able to calculate a DRIS sufficiency range for each nutrient at each growth stage.
Fig. 1 shows that leaf N, P and K concentrations were highest before harvest began (stage 1, which was late February in Santa Maria and late March in Watsonville-Salinas), and declined to a reasonably stable level throughout the main harvest period (stages 3-5, May-July in Santa Maria, June-August in Watsonville-Salinas). The decline in leaf macronutrient concentrations during the peak harvest period was expected; it happens in many fruiting crops because the leaves rapidly translocate nutrients to the developing fruit. By contrast, micronutrient concentrations either increased from early vegetative growth to the main harvest period (as was the case for B, Ca and Fe), or remained reasonably stable over the entire season (all other micronutrients). The vertical bars on each data point on Fig. 1 indicate the range of values typical of nutritionally balanced, high yield fields at each growth stage. These are the DRIS sufficiency ranges; leaf nutrient concentrations within these ranges can safely be assumed to be adequate for high yield production.
Table 1 lists the DRIS leaf nutrient sufficiency ranges for pre-harvest and main harvest growth stages. For the sake of comparison, both the sufficiency ranges given in UC Publication 4098 and the current University of Florida guidelines have been included. Although for most nutrients the ranges match pretty well, for others there are substantial differences. Where the DRIS sufficiency range is substantially higher than the other sources (Ca, Mn and Fe, for example) it is because those nutrients are in such abundant supply in our coastal soils that plant uptake is far in excess of actual plant requirement; for those nutrients a lab test result marginally below the DRIS range would not be a matter of concern.
For several nutrients (N, Zn and Cu) the DRIS sufficiency range fell below the other recommendations. We are confident that the DRIS ranges represent nutrient sufficiency because they were determined by measuring the levels common in high yield fields. The field survey approach used in this project ensured that a wide range of field conditions and grower practices were included, so the results are broadly representative of the coastal industry. Also, for all three nutrients the average leaf concentrations of the high yield and low yield groups were essentially equal, suggesting that availability of these nutrients did not limit yields.
Fig. 2 shows the trends in petiole nutrient concentrations over the season. Petiole NO3-N was so highly variable as to be nearly worthless as a diagnostic technique; during peak fruit harvest (our sampling dates 3 and 4) petiole NO3-N in high yield fields varied from < 200 PPM to 2,600 PPM. While we believe that leaf total N is a more reliable measurement, this study suggests that maintaining petiole NO3-N > 1,000 PPM pre-harvest, and > 400 PPM during peak harvest, is adequate to maintain high productivity. Given the high variability of petiole NO3-N it is possible that concentrations < 400 PPM would be adequate during the summer.
Petiole PO4-P and K were less variable than petiole NO3-N. Maintaining PO4-P > 1,200 PPM throughout the season should ensure P sufficiency. Given the high soil P availability in most coastal soils rotated with vegetable crops, this level is probably much higher than the ‘critical value’. Maintaining petiole K > 2.5% preharvest, and > 1.5% during peak harvest, appears to be adequate.
Table 1. Comparison of DRIS leaf nutrient sufficiency ranges with prior UC recommendations, and current University of Florida guidelines.
|
|
|
Nutrient sufficiency ranges |
||
|
Growth stage |
Nutrient |
DRIS |
UC Pub. 4098 |
University of Florida |
|
Pre-harvest |
% N |
3.1 - 3.8 |
|
3.0 - 3.5 |
|
|
% P |
0.50 - 0.90 |
|
0.20 - 0.40 |
|
|
% K |
1.8 - 2.2 |
|
1.5 - 2.5 |
|
|
% Ca |
0.6 - 1.3 |
|
0.4 - 1.5 |
|
|
% Mg |
0.33 - 0.45 |
|
0.25 - 0.50 |
|
|
% S |
0.19 - 0.23 |
|
0.25 - 0.80 |
|
|
PPM B |
31 - 46 |
|
20 - 40 |
|
|
PPM Zn |
13 - 28 |
|
20 - 40 |
|
|
PPM Mn |
75 - 600 |
|
30 - 100 |
|
|
PPM Fe |
70 - 140 |
|
50 - 100 |
|
|
PPM Cu |
3.3 - 5.8 |
|
5 - 10 |
|
|
|
|
|
|
|
Main harvest |
% N |
2.4 - 3.0 |
> 3.0 |
2.8 - 3.0 |
|
|
% P |
0.30 - 0.40 |
0.15 - 1.30 |
0.20 - 0.40 |
|
|
% K |
1.3 - 1.8 |
1.0 - 6.0 |
1.1 - 2.5 |
|
|
% Ca |
1.0 - 2.2 |
0.4 - 2.7 |
0.4 - 1.5 |
|
|
% Mg |
0.28 - 0.42 |
0.3 - 0.7 |
0.20 - 0.40 |
|
|
% S |
0.15 - 0.21 |
> 0.10 |
0.25 - 0.80 |
|
|
PPM B |
40 - 70 |
35 - 200 |
20 - 40 |
|
|
PPM Zn |
11 - 20 |
20 - 50 |
20 - 40 |
|
|
PPM Mn |
65 - 320 |
30 - 700 |
25 - 100 |
|
|
PPM Fe |
85 - 200 |
50 - 3,000 |
50 - 100 |
|
|
PPM Cu |
2.6 - 4.9 |
3 - 30 |
5 - 10 |
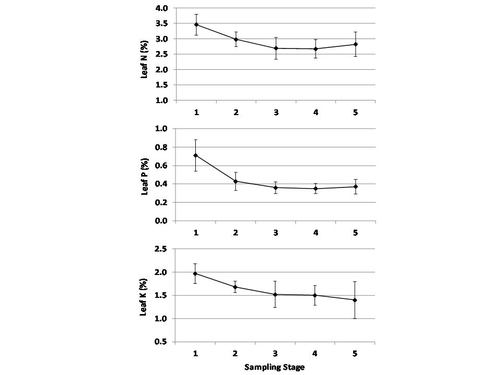
Fig. 1. Trend in leaf macronutrient concentrations over the growing season in nutritionally balanced, high yield fields; the bars indicate the DRIS sufficiency ranges.
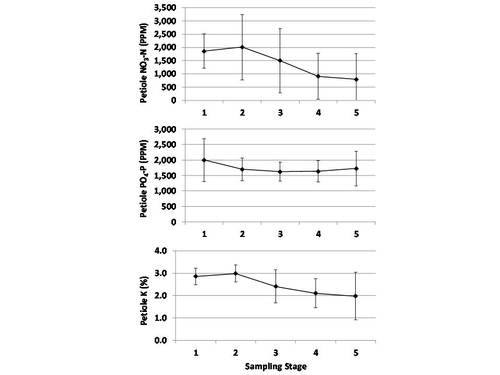
Fig. 2. Trend petiole macronutrient concentrations over the growing season in nutritionally balanced, high yield fields; the bars indicate the DRIS sufficiency ranges.

Posted by john g eiskamp on October 11, 2016 at 5:04 PM