- Author: Michael D Cahn
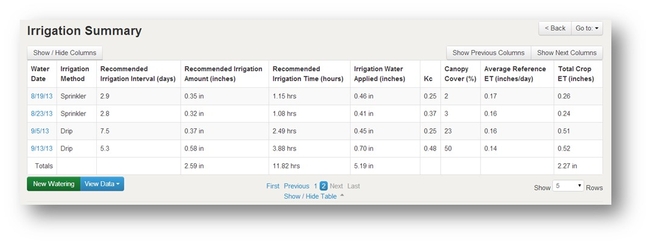
Irrigations can be tracked for each planting by entering new watering events into the “Irrigation Summary” table (Fig. 1). In addition to keeping records on when and how much water was applied, CropManage will recommend an amount of water to apply and an optimum interval between irrigations using reference evapotranspiration data from CIMIS (California Irrigation Management Information System), crop development models, and information about the soil type of the field and irrigation system. CIMIS is operated by the California Department of Water Resources.
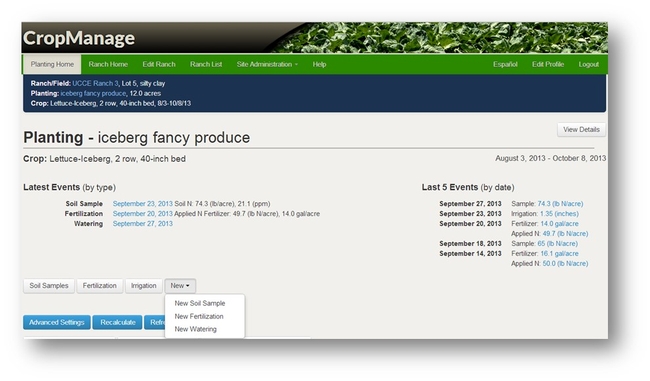
To add a new irrigation event, select the “new watering” button located below and to the left side of the irrigation summary table (Fig. 1) or select “New” and then “New Watering” from the “Quick View” screen (Fig 2).
Figure 1. Enter new irrigation events by selecting “New Irrigation” below the irrigation summary table.
Figure 2. New irrigation events can be entered from the quick view screen by selecting “New” and “New Watering.”
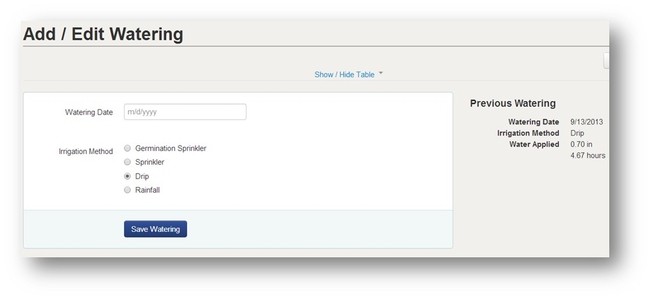
An entry form will display for adding a new irrigation event (Fig 3). Enter the intended date of the irrigation. The previous irrigation event will be displayed on the right side of the form. CropManage uses the days between the last irrigation or significant rainfall event and the next planned irrigation to estimate the water needs of the crop.
Next, select the method of irrigating. The choices are "Germination Sprinkler", "Sprinkler", "Drip", and "Rainfall." The irrigation method is used for estimating crop evapotranspiration and determining an appropriate amount of water to apply to compensate for non-uniformity of the irrigation system. Evaporative losses of moisture from the soil surface are normally greater under sprinklers than drip irrigation, and the application uniformity is usually higher under drip than sprinklers. The uniformity of the irrigation system must be entered when setting up the planting.
"Germination Sprinkler" is distinguished from "Sprinklers" because the method of irrigating with sprinklers during germination is sometimes different than when the crop is established. This distinction allow the user to set different levels of uniformity or application rate for sprinklers used in the germination and the establishment phase of the crop.
Significant rainfall events (more than 0.25 inches) recorded at the CIMIS station associated with the ranch, are automatically entered into the irrigation summary table if no other irrigation events were added for the same day. For cases where significant rainfall is recorded near the planting but not measured by the CIMIS station, one can manually enter the rainfall event by selecting “Rainfall."
Figure 3. Form for entering new irrigation events for a planting.
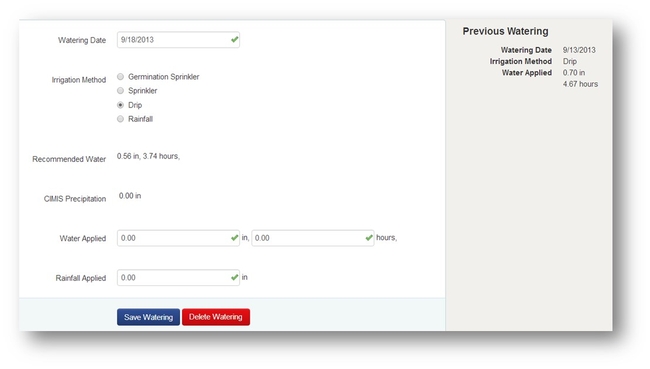
After saving the new watering, the form will update with a recommended amount and time to irrigate, and display a space to enter the amount of water that was applied (Fig. 4). One can save the form without entering the applied water amount, and after irrigating, enter the amount of water applied. Also, one can enter the amount of water intended to be applied and reenter the value after the irrigation is completed. The amount of applied water can be entered as depth of water applied over the area of the field in units of “inches”, or as time (hours) irrigated, which is converted to inches of water applied using the application rate of the irrigation system. If rainfall was selected, then enter the rainfall depth in units of “inches.”
Figure 4. Irrigation form updates with recommended water amount after entering the irrigation date and saving.
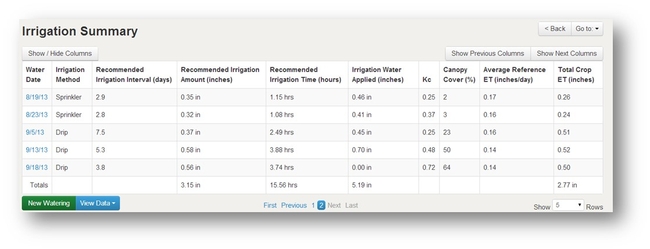
After selecting “Save Watering” the table will be updated with the new irrigation event (Fig. 5). The table displays the recommended irrigation interval, amount of water to apply, and hours to irrigate (Fig. 5). The next column to the right displays the amount of water that was applied. Note that no entry was made for the last watering on 9/18 since the irrigation had not occurred yet. The user can add this information later, or change or delete the irrigation event. The next columns display the estimated crop coefficient (Kc) used to convert reference ET to crop ET, and the estimated canopy cover of the crop, used for modeling the Kc values. The last 2 columns on the right display the average daily reference ET and total crop ET since the last irrigation event (Fig. 5).
Figure 5. The irrigation summary table displays recommended irrigation interval, water amount, and hours to irrigate as well as crop coefficient and reference ET values used for the recommendation.
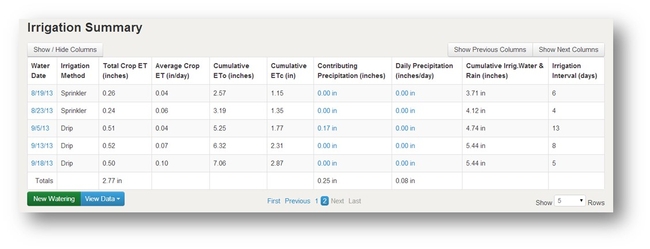
Figure 6. Selecting “next columns” will also display precipitation and other data used for estimating the water needs of the crop.
Selecting the “Show Next Columns” button above the table to the right side, will display cumulative reference evapotranspiration (ETo), cumulative crop evapotranspiration, precipitation, and other data used for estimating the crop water needs. Selecting the “Show Next Columns” button again will display information of the estimated root depth of the crop, allowable soil moisture depletion, and flow meter data if one is used to measure applied water.
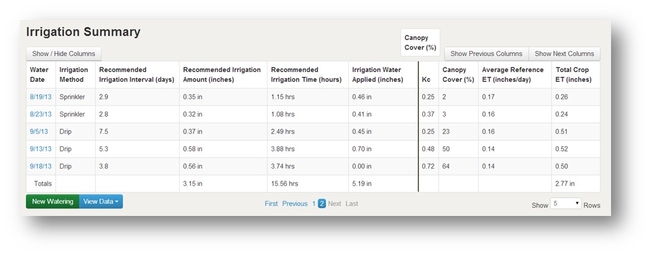
One can customize the column order of the table by clicking on a column heading with the mouse curser and dragging the heading to a new location on the table (Fig. 7). Clicking on previous order button will rearrange the columns to the original order. Additionally, one can temporarily hide specific columns from the table by clicking on the “Show/Hide columns” button.
Figure 7. The order of the columns can be changed by dragging the column heading to a new location.


