- Author: Ian Grettenberger
- Author: Addie Abrams
Two of the worst pests plaguing lettuce growers in the Salinas Valley area are aphids, specifically lettuce-currant aphids (Nasovonia ribisnigri), and western flower thrips (Frankliniella occidentalis). Lettuce-currant aphid is an invasive pest that sets up shop in the heart of the lettuce plant and will render the crop unsellable when it reaches high enough numbers. Thrips can both cause cosmetic damage to lettuce crops and are also responsible for the spread of Salinas impatiens necrotic spot virus (INSV), the fatal lettuce disease that has driven large losses since the 2020 growing season.
While effective tools exist to control both aphids and thrips, they are almost exclusively chemical. Chemical sprays are increasingly under pressure due to changes in the regulatory framework in California as well as the development of pest resistance and discoveries of key chemistries in area watersheds1,2. The UC Davis FiVE lab biological control research program addresses a growing interest in developing alternative tools for managing both pests that do not rely on chemical applications. Biological control provides an opportunity for the management of thrips and aphids that do not rely on chemical tools.
Biological control is defined as the use of natural enemies to control a target pest. Three general categories of biological control could possibly be used as management practices for lettuce pests in the Salinas Valley area:
• Conservation biological control refers to the establishment and maintenance of resources and conditions favorable
• Inundative biological control involves the release of a beneficial insect species in large numbers with the expectation that the beneficials that are released will only provide control for a short amount of time before eventually dying out. Such releases would need to be repeated at regular intervals for the duration of the growing cycle for a crop.
• Augmentative biological control refers to the use of releases of smaller numbers of beneficials to areas where a smaller population of the species already exists, but not in numbers great enough to provide adequate control of the targeted pest species. The goal of augmentative releases is to bolster already-existent populations of beneficial species so they achieve great enough numbers to provide control of the pest or pests of interest.
Conservation biological control in the Salinas Valley
Syrphid flies
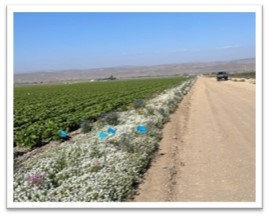
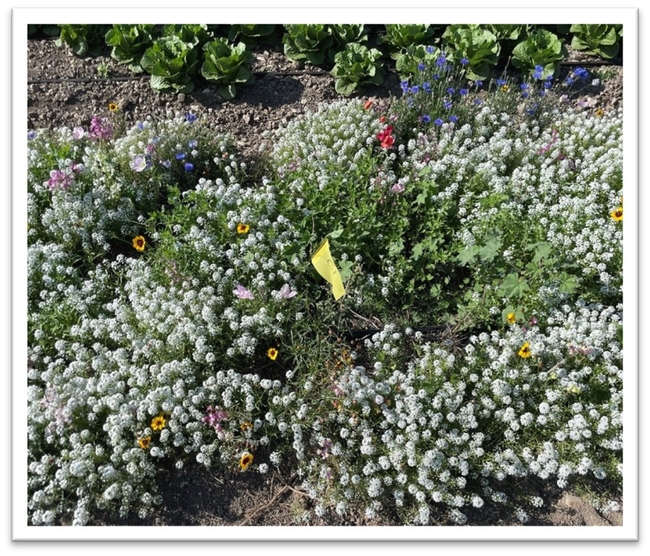
Aphid pests of lettuce have been effectively managed in some lettuce production systems through the planting of sweet alyssum adjacent to and interspersed within crop fields3. Sweet alyssum is a favorite of the Syrphid fly (Diptera: Syrphidae), the primary biological control agent used to control aphid pests in lettuce. Syrphids, also called hoverflies or flower flies, are a family of black and yellow pigmented flies which resemble bees and stinging wasps. The coloration is a protective camouflage; Syrphid flies are harmless to humans. Syrphid adults are frequently seen visiting flowers for their nectar and pollen, which the insect consumes both as an energy source and to support their reproduction.
In exchange the female Syrphid flies will lay eggs in lettuce plants with lettuce aphid infestations, the primary food source for their young. Once the eggs hatch, the syrphid maggots, which are predatory on slow, soft-bodied insects, will feed on the aphids and suppress their population. Syrphid larvae are known to be voracious; some California species have been shown to consume upwards of 100 aphids per day4!
Syrphids are the intended beneficiaries of most conservation biological control in central coast lettuce fields, but other beneficial species take advantage of these resources as well.
Other predatory species love sweet alyssum
Many other biological control agents are supported by insectary plantings5. Ladybird beetles often inhabit lettuce fields and may provide some control of lettuce aphid infestations. Common lacewings (family Chrysopidae) are also found in lettuce fields and insectary plantings. Lacewings, which are only predatory in their immature or larval life stage, can provide biological control services against lettuce aphids and western flower thrips. Minute pirate bug (Orius sp.) and aphid midges (Aphidoletes aphidimyza) have also been observed in and collected from insectary plantings in lettuce fields, but it is not known the extent to which they can suppress populations of lettuce aphid or Western flower thrips.
UC Davis Fi-VE Bug IPM Lab biological control research programs
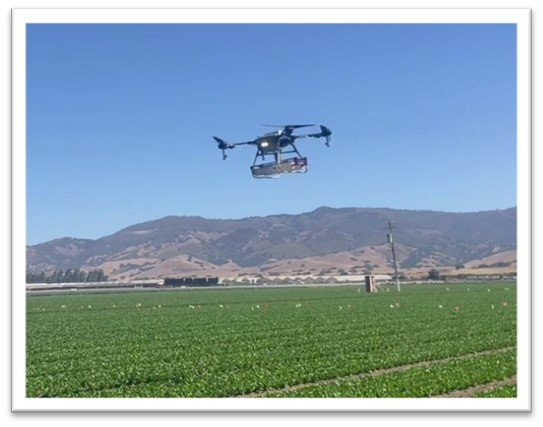
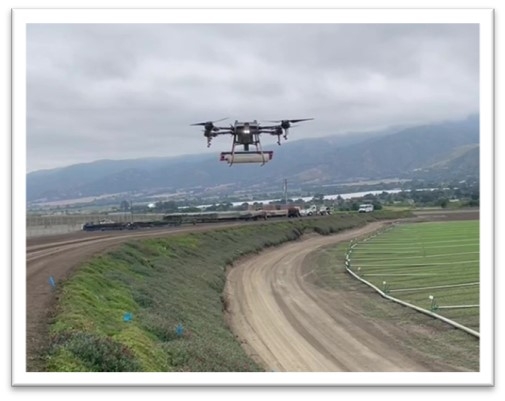
Including insectary plantings to attract naturally occurring predators has historically been the only efficient way to get beneficial species into crop fields. Newly developed technology using drones as a dispersal tool may provide another option for growers interested in using biological control as part of their pest management programs for aphids and thrips. This technology drastically reduces the time and labor required to conduct large releases of laboratory-reared beneficial insects, making the approach more feasible for growers.
As part of a research program funded by the California Department of Pesticide Regulation (CA DPR) and in collaboration with Daniel Hasegawa at USDA-ARS and with Parabug, we are studying the release of biological control agents using drones for the management of aphid and thrips pests of lettuce crops. Our three experimental programs are as follows:

Experiments run by former Monterey County IPM Advisor Alejandro Del Pozo-Valdivia found that a single inundative release of green lacewing eggs (Chrysoperla rufilabris) in lettuce fields reduced aphid pressure six weeks after release6. Our experiment builds on Alejandro's work, examining whether repeated releases of green lacewing eggs throughout the lettuce growing cycle reduce aphid numbers. Additionally, the experiment includes two treatments aimed at suppressing western flower thrips: inundative releases of a species of predatory mite (Amblyseius cucumeris), and a combined release of both predatory mites and green lacewing eggs.
Augmentative releases to bolster non-syrphid predatory species in insectary strips and intercropped alyssum

Other native predators of aphids and thrips are present in the insectary plantings growers use to attract syrphids, but their numbers are too low to provide suppression of thrips and aphids in adjacent crops. These species are reared by commercial insectaries, but using them in an inundative release could prove too costly for growers. Experiments in this program examine the use of smaller releases of these predatory species early in the growing cycle over insectary plantings. The goal is to determine whether the presence of floral resources allows the predators to stick around and build up enough in population to control aphids and thrips in the crop field. Experiments will be conducted with aphid midge (Aphidoletes aphidimyza), an aphid predator, and minute pirate bug (Orius insidiosus), a predator of western flower thrips.
Augmentative releases to manage thrips in non-crop areas
Western flower thrips plague not just vegetable crop fields but also the vegetation surrounding crop areas. In this experiment, we will examine whether releases of cucumeris mites and minute pirate bugs over field edges planted with ice plant will establish these predators in the vegetation and provide long-term suppression of western flower thrips.
Citations
- Deng, X. Study 321: Surface water monitoring for pesticides in agricultural areas in the Central Coast and southern California (2022)
- Gao, Y., Lei, Z. & Reitz, S. R. Western flower thrips resistance to insecticides: detection, mechanisms and management strategies. Pest Manag. Sci. 68, 1111–1121 (2012).
- Brennan, E. B. Agronomic aspects of strip intercropping lettuce with alyssum for biological control of aphids. Biol. Control 65, 302–311 (2013).
- Hopper, J. V., Nelson, E. H., Daane, K. M. & Mills, N. J. Growth, development and consumption by four syrphid species associated with the lettuce aphid, Nasonovia ribisnigri, in California. Biol. Control 58, 271–276 (2011).
- Bugg, R. L., Colfer, R. G., Chaney, W. E., Smith, H. A. & Cannon, J. Flower Flies (Syrphidae) and Other Biological Control Agents for Aphids in Vegetable Crops. (University of California, Agriculture and Natural Resources, 2008). doi:10.3733/ucanr.8285.
- Del Pozo-Valdivia, A. I., Morgan, E. & Bennett, C. In-Field Evaluation of Drone-Released Lacewings for Aphid Control in California Organic Lettuce. J. Econ. Entomol. 114, 1882–1888 (2021).
- Author: Michael D Cahn
Date: Wed. April 3rd, 2024
Course 8:30 am – 12 pm
Location: Monterey County Agriculture Conference Room
1432 Abbott St, Salinas CA 93901
- Learn how to use CropManage to support irrigation and nutrient management decisions and record-keeping for your crops.
- Learn how to set up your ranch and crops in CropManage.
- Learn about the latest updates and how CropManage can assist with Ag Order 4.0
CropManage is a free online decision-support tool for water and nutrient management of vegetables, berry, agronomic, vineyard and tree crops. Based on research and field studies conducted by the University of California Cooperative Extension, CropManage provides real-time recommendations for efficient and timely irrigation and fertilization applications while maintaining or improving overall yield.
At this free workshop, we will provide hands-on training so that you can learn to use the newest version of CropManage. Crops currently supported include many vegetables (carrots, cabbage, celery, broccoli, lettuce, tomato, spinach, etc.), berry crops (raspberry and strawberry), vineyards, tree crops (almond, walnut, pistachio, prunes, and pear), and agronomic crops (alfalfa and corn). CropManage is also available in Spanish.
Who should participate? Growers, farm managers, other farm staff, crop advisors, consultants, and technical service providers are welcome. The workshop is for both new and current CropManage users. Spanish translation will be available.
What to bring? This is a participatory workshop. Please bring a tablet or laptop computer so that you can follow along and participate in the exercises. Each participant will need a user account for CropManage. Please set up a free user account at https://cropmanage.ucanr.edu/ before the workshop. Please arrive early to set up your laptop or tablet computer on the wifi and get logged on to CropManage.
Registration is free: Please register here
by April 1, 2024. Seats are limited to the first 30 registrants.
Questions: Contact Michael Cahn at mdcahn@ucanr.edu / 831-214-3690
Agenda
8:30 – 8:50 am Registration and computer set-up
8:50 – 9:20 am Introduction
9:20 – 10:00 am Getting started with CropManage
10:00 to 10:15 am break
10:10 – 11:00 am Using CropManage for decision support and record-keeping
11:00 – 11:45 am Group exercise
11:45- 12 pm Discussion /Q&A/ wrap up
Continuing Education Units (CEU) for Certified Crop Advisors (CCA) have been applied.
- Author: Michael D Cahn
Date: Wednesday, March 6th, 2024 (8 am – 2 pm)
Location: UCCE Monterey County
1432 Abbott St., Salinas, CA 93901
With: UC Davis, UC Merced, UCCE Monterey County, Land IQ, UC ANR
Free Registration includes coffee breaks, lunch, workshop materials,
and access to workshop presentations.
CEU Credits available
WORKSHOP AGENDA
8:00 – 8:30 am: On-site Registration
Session 1 – Issues and Challenges in Vegetable, Berry, and Grapevine Production under Changing Climate: Moderator: M. Cahn
8:30 – 8:45 am: Climate change trends and potential impacts on specialty crops in the Central Coast (T. Pathak, UC Merced)
8:45 – 9:15 am: Climate change effects on agricultural pests (Daniel Hasegawa, USDA-ARS)
9:15 – 10:00 am: Grower panel discussion on production challenges resulting from climate change and variability
10:00 – 10:15 am COFFEE BREAK
Session 2 – Tools and Resources for Climate-Smart Agriculture: Moderator: D. Zaccaria
10:15 – 10:45 am: The CDFA Climate-Smart Ag Web Repository (S. Tillman, Land IQ)
10:45 – 11:00 am: CalAgroClimate Decision Support Tools for managing risks in agriculture (T. Pathak, UC Merced)
Session 3 – Case Studies on Regional Adaptation Practices: Moderator: T. Pathak
11:00 – 11:20 am: Available rootstocks and varieties for resilient wine-grape production (L. Bettiga, UCCE Monterey County)
11:20 – 11:40 pm Low Biomass cover crop strategies for protecting water quality in vegetable systems (M. Cahn, UCCE Monterey County).
11:40 – 12:00 pm: Cover cropping strategies for climate-smart and climate-resilient farms (Eric Brennan, USDA-ARS Salinas, CA)
12:00 – 12:20 pm: Weather and climate effects on berry production (M. Bolda, UCCE Santa Cruz County)
12:20 – 12:40 pm: Evapotranspiration and water productivity of wine grapes for various vineyard growing conditions (D. Zaccaria, UC Davis)
12:40 – 1:00 pm QUESTIONS & ANSWERS and WORKSHOP EVALUATIONS
1:00 – 2:00 pm LUNCH & ADJOURN
Who should attend: Vegetable, berry, and grapevine growers, farm and ranch managers, representatives from the vegetable, berry, and grapevine production industry, technical assistance providers, consultants and practitioners, CCAs, CPAs, natural resource managers, personnel from water conservation districts, irrigation districts' managers, extension specialists and advisors, professional researchers, University students, and representatives from state and federal agencies.
Event Description: Join, UCCE Specialists Daniele Zaccaria and Tapan Pathak, UCCE Advisors Michael Cahn and Larry Bettiga, and other scientists and experts from USDA-ARS and Land IQ in this in-person Workshop on “Adapting Vegetable, Berry, and Grapevine Production Practices in the Central Coast to Changing and Variable Climate” on March 6th, 2024 at the UCCE Monterey County office in Salinas, CA to learn about the latest research and advances in Management of Climate Change Risks.
Topics include: Climate Change Trends and Impacts, Climate-related Challenges for Vegetable, Berry, and Grapevine Production, Effects of Winter Cover Cropping on Vegetable and Grapevine Production, Mitigation of Heat and Drought Stress, and Climate-Adaptive Practices for Vegetable, Berry, and Wine-grape Production.
A set of information and tools available to manage climate change risks will also be presented during the Workshop.
Free registration includes participation to the thematic sessions, coffee break, lunch meal, workshop materials, and access to the workshop presentations.
For questions, please contact:
Michael Cahn: UC Cooperative Extension, Monterey County: mdcahn@ucanr.edu
Larry Bettiga: UC Cooperative Extension, Monterey County: lbettiga@ucanr.edu
Daniele Zaccaria – University of California, Davis: dzaccaria@ucdavis.edu
Tapan Pathak – University of California, Merced: tpathak@ucmerced.edu
- Author: Michael D Cahn
Date: Thursday, March 7, 2024
Course 10:30 am – 2 pm
Drop-in office hours 2-3:30 pm
Location: Watsonville Public Library
275 Main St., Suite 100, Watsonville, CA 95076
- Learn how to use CropManage to support irrigation and nutrient management decisions and record-keeping for your crops.
- Learn how to set up your ranch and crops in CropManage.
- Learn about the latest updates and how CropManage can assist with Ag Order 4.0
- New—deep dive into advanced CropManage topics during office hours
CropManage is a free online decision-support tool for water and nutrient management of vegetables, berry, agronomic, and tree crops. Based on research and field studies conducted by the University of California Cooperative Extension, CropManage provides real-time recommendations for efficient and timely irrigation and fertilization applications while maintaining or improving overall yield.
At this free workshop, we will provide hands-on training so that you can learn to use the newest version of CropManage. Crops currently supported include many vegetables (carrots, cabbage, celery, broccoli, lettuce, tomato, spinach, etc.), berry crops (raspberry and strawberry), tree crops (almond, walnut, pistachio, prunes, and pear), and agronomic crops (alfalfa and corn). CropManage is also available in Spanish.
A new addition to the workshop are drop-in office hours for anyone already familiar with CropManage and does not want to attend the full program but needs more advance assistance or may have specific questions. Stop by at 2 pm and we will be ready to help answer your questions and dive deep into more advanced topics.
Who should participate? Growers, farm managers, other farm staff, crop advisors, consultants, and technical service providers are welcome. The workshop is for both new and current CropManage users. Spanish translation will be available. Lunch will be provided.
What to bring? This is a participatory workshop. Please bring a tablet or laptop computer so that you can follow along and participate in the exercises. Each participant will need a user account for CropManage. Please set up a free user account at https://cropmanage.ucanr.edu/ before the workshop. Please arrive early to set up your laptop or tablet computer on the wifi and get logged on to CropManage.
Registration is free: Please register here
by March 4, 2024. Seats are limited to the first 30 registrants.
Questions: Contact Michael Cahn at mdcahn@ucanr.edu / 831-214-3690 or Sacha Lozano at slozano@rcdsantacruz.org / 831-224-0293
Agenda
10:30 – 10:50 am Registration and computer set-up
10:50 – 11:20 am Introduction
11:20 – 12:00 pm Getting started with CropManage
12:00 to 12:30 pm Lunch break
12:30 – 1:15 pm Using CropManage for decision support and record-keeping
1:15 – 1:45 pm Group exercise
1:45- 2 pm Discussion /Q&A/ wrap up
Drop-in office hours
2 – 3:30 pm Stop by to receive one-on-one assistance with CropManage and explore more advanced ways to use CropManage to understand nutrient and water needs of crops.
Continuing Education Units (CEU) for Certified Crop Advisors (CCA) have been applied.
- Author: Michael D Cahn
2024 Irrigation and Nutrient Management Meeting
Tuesday, February 20
7:55 am to 1:30 pm
Habrá traducción al Español
7:30 Sign-in and refreshments
7:55 Introduction
8:00 Managing runoff during the growing season and winter.
Michael Cahn, UCCE Irrigation Advisor, Monterey County
8:30 Satellite estimates of crop water use on the central coast and OpenET
Lee Johnson, CSU Monterey Bay/NASA
9:00 Update on using high carbon amendments for reducing nitrate leaching during the winter
Richard Smith, UCCE Vegetable and Weed Emeritus Advisor, Monterey County
Joji Muramoto, UC Santa Cruz, Organic Production Specialist
9:30 Cover crops for reducing winter nitrate leaching and controlling storm water runoff.
Eric Brennan, Research Horticulturist, USDA ARS
10:00 Break
10:15 Ag Order requirements for the upcoming year
Sarah Lopez, Executive Director, Central Coast Water Quality Preservation Inc.
10:45 UCANR Nitrogen and Irrigation Initiative: Opportunity for technical assistance.
Aparna Gazula, UCCE Small Farm Advisor, Santa Clara County
11:00 Using CropManage to help with Ag Order compliance.
Michael Cahn, UCCE Irrigation Advisor, Monterey County
11:25 DPR Surface Water Protection Program: An overview of ag. monitoring on the Central Coast.
Pedro Lima, Sr. Environmental Scientist Cal DPR
11:50 Introduction to pump efficiency
Bill Green, Fresno State University, Center for Irrigation Technology
12:00 Pizza and Salad Lunch (free!)
12:45 Demonstration of pump efficiency and variable frequency drives (Parking lot)
Crystal Sandoval-Leyva, Fresno State University, Center for Irrigation Technology
2:15 Adjourn
CCA and DPR continuing education credits have been requested
For more information, contact Michael Cahn @ 831-759-7377, email: mdcahn@ucdavis.edu


