- Author: Ben Faber
Spatial Overview - How it Works
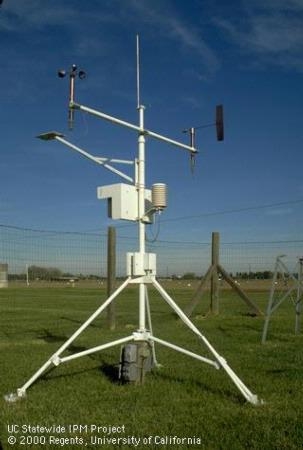
The California Irrigation Management Information System (CIMIS) currently manages over 145 active weather stations throughout the state. Archived data is also available for 85 additional stations that have been disconnected from the network for various reasons. Most of the CIMIS stations produce estimates of reference evapotranspiration (ETo) for the station location and their immediate surroundings, often in agricultural areas. Because of California's diverse landmass and climate, many locations within the state lack a representative CIMIS station. Some counties, for example, do not have a CIMIS station and others have only one or two stations. As a result, there are significant spatial ETo data gaps, especially in urban areas. In an attempt to mitigate this problem, CIMIS initiated a study to investigate the possibility of coupling remotely sensed satellite data with point measurements from the CIMIS weather stations to generate spatially distributed ETo values (ETo maps).
A contract was awarded to the University of California Davis (UCD) remote sensing group, lead by Professor Susan Ustin, to conduct the study. The Department of Water Resources (DWR) formed an advisory committee comprised of individuals with expertise in remote sensing, GIS, modeling, and water management from DWR and UCD. The committee met, on an as needed basis to discuss new developments and plan future actions. After thorough research, the team decided to use combinations of data derived from satellites and interpolated from CIMIS station measurements to estimate ETo at a 2 kilometer (km) spatial resolution. The resulting product has been vigorously tested and has demonstrated a degree of accuracy that is acceptable for most irrigation applications. The CIMIS program will continue to evolve and expand to meet the future irrigation information needs of California. For a brief description of the methodology used to generate the ETo maps, see the Spatial Model discussion below.
Spatial Model
Daily reference evapotranspiration (ETo) at a 2 km spatial resolution are calculated statewide using the American Society of Civil Engineers version of the Penman-Monteith equation (ASCE-PM). Required input parameters for the ASCE-PM ETo equation are solar radiation, air temperature, relative humidity, and wind speed at two meters height. These parameters are estimated for each 2 km pixel using various methods.
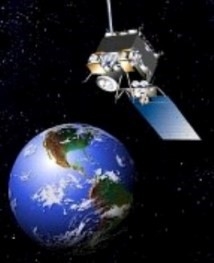
Daily solar radiation is generated from the visible band of the National Oceanic and Atmospheric Administration's (NOAA) Geostationary Operational Environmental Satellite (GOES) using the Heliosat-II model. This model is designed to convert images acquired by the Meteosat satellite into maps of global (direct plus diffused) irradiation received at ground level. The model has also been used with other geostationary satellites such as the GOES. For details on the Heliosat-II model and its accuracy, please refer to the HelioClim web page.
Interpolation
Air temperature, relative humidity, and wind speed values at each pixel were obtained by interpolating point measurements from CIMIS stations. Originally two interpolation methods, Spline and DayMet, were selected based on accuracy of results, code availability, and computational efficiency. Spline – the method currently used – is an interpolation method that fits a surface through or near known points using a function with continuous derivatives. Two- or three-dimensional Spline is used based on which weather parameter is to be interpolated.
The accuracy of both methods has been tested using cross-validation analysis, but DayMet is no longer used. DayMet is an interpolation method that was developed at the University of Montana to generate daily surfaces of temperature, precipitation, humidity, and radiation over large regions of complex terrain. It determines the weights associated with a given weather station for each point where weather parameters are to be determined depending on the distance and density of the stations.
The accuracy of ETo values estimated from these methods depends on many factors. For example, solar radiation remotely sensed through GOES is significantly affected by such factors as cloudiness and snow cover. Therefore, mountainous areas with snow cover and coastal areas with cloud and fog are more susceptible to errors. Also, interpolation accuracy is affected by the density of the weather stations and geographic features of the region. CIMIS stations are purposely placed in irrigated, open, flat areas – usually valleys – to provide the best reference data for adjacent farmlands and other irrigated areas. As a result, interpolation in valleys between CIMIS stations may not provide accurate data for mountainous terrain. Despite these potential problems, however, we believe the ETo estimates provided will be superior to only using data from a distant weather station with a different microclimate. For CIMIS station Siting criteria click the “Siting” tab.
Further Details
For detailed descriptions of the methodology used to map daily ETo, refer to the RESOURCES navigation button https://cimis.water.ca.gov/Resources.aspx
If you would like to get ETo data created using the methods described here, you may do so by logging into your account, clicking on the SPATIAL navigation bar, then on the Spatial Report tab. If you do not have a CIMIS account, you can create one by registering with us. Please note that CIMIS data is provided free of charge and registration is required for statistical purposes only. https://cimis.water.ca.gov/Default.aspx

- Author: Ben Faber
The California Irrigation Management Information System (CIMIS) is a program unit in the Water Use and Efficiency Branch, Division of Regional Assistance, California Department of Water Resources (DWR) that manages a network of over 145 automated weather stations in California. CIMIS was developed in 1982 by DWR and the University of California, Davis (UC Davis). It was designed to assist irrigators in managing their water resources more efficiently. Efficient use of water resources benefits Californians by saving water, energy, and money. https://cimis.water.ca.gov/
CIMIS reflects the energy that has arrived to drive water use by crops. It is the past. Now the National Weather Service has devised a way of forecasting water use, so that growers can be better prepared for irrigation. The question is how well does this new system work. Well, here are the results or a study that should lend confidence in the predictive value of the system.
COMPARISON BETWEEN FORECASTS OF REFERENCE EVAPOTRANSPIRATION and ETo VALUES CALCULATED USING DATA FROM DIFFERENT CLIMATIC CONDITIONS.
G. Ben Hamouda, F. Ventura, D. Zaccaria, R.L. Snyder, K.M. Bali.
Evapotranspiration is the transfer of water from the earth's surface to the atmosphere. It comprises the sum of water losses to atmosphere due to the processes of evaporation of moisture from soil, water bodies and wet plant canopies, and the transpiration of water from plants. Forecasts of this crucial component of the hydrologic cycle can be very valuable for growers, farm managers, irrigation practitioners, water resource planners and managers, and reservoir operators for their planning, allocation, delivery and scheduling decisions, as well as to hydrologic scientists for research purposes. Verifying the reliability of models' forecasts is among the critical tasks for development and performance evaluation of physical models. In fact, the verification allows understanding the models' behavior under different climatic conditions, and evaluating their applicability and dependability.
The US National Weather Service (NWS) has released a product that provides forecasts of reference evapotranspiration (FRET) at 2.5-km grid resolution for the entire continental US. In this study, a comparison is made between ETo estimates from FRET and ETo values calculated by the California Irrigation Management Information System (CIMIS) for 68 days during summer 2019. Both the FRET forecasts and ETo values were obtained from NWS and CIMIS, respectively, on the basis of 15 CIMIS locations that are representative of different climatic conditions in California. In addition, air temperature, dew point temperature, relative humidity, wind speed, and vapor pressure deficit (VPD) data were also collected/calculated from the NWS and CIMIS websites to analyze the sensitivity of FRET forecasts to predictions of these parameters. All FRET forecasts were performed with timescales of 1, 3, 5 and 7 days. Statistical indices were calculated to assess the dependability of FRET values. They showed a good correlation of the FRET model outputs with CIMIS ETo data, with some differences depending on the climatic characteristics of selected weather stations' locations, suggesting that FRET data could be valuable for anticipating near-future water demand and improve irrigation management in California.
Look for a more detailed description of this study in a forthcoming edition of the Journal of Irrigation and Drainage Engineering – ‘Evaluation of Forecast Reference Evapotranspiration (FRET) for Different Microclimates Regions in California to Enable Prospective Irrigation Scheduling' - https://ascelibrary.org/journal/jidedh
FRET is available at:
https://www.weather.gov/abr/etforecasts
And more:
https://www.weather.gov/cae/fretinfo.html
https://www.weather.gov/abr/etforecasts
https://ui.adsabs.harvard.edu/abs/2016AGUFM.H21D1430O/abstract
- Author: Ben Faber
Drought may not be the right time to be thinking about this, or maybe it is. It concerns managing water and any time a grower uses water more effectively the crop performs better. But fog can be a significant factor in water management.
As fog passes through a tree canopy, it is absorbed by leaves and coats them. Before the tree will transpire water, the water coating must first be evaporated before the tree loses internal water. This water use is not accounted for in a water budget schedule using evapotranspiration based inputs, such as from CIMIS. For deciduous trees, this is often not of concern, because in the winter they don't have leaves and therefore are not transpiring anyway. For evergreen subtropicals like citrus and avocado, this could be an important source of water.
In many situations in the Central Valley and along the coast there can be periods where fog can represent a significant proportion of the water requirement for an orchard. These periods would be for winter tule fog in the Valley and along the coast in the spring and early summer. A recent publication by Rick Snyder at UC Davis has just been released that shows how this fog water can be incorporated into an irrigation schedule. You can see it at the UC's California Institute for Water Resources website: http://anrcatalog.ucanr.edu/pdf/8532.pdf, http://ciwr.ucanr.edu/california_drought_expertise/droughttips/

- Author: Gary Bender
Quite frankly, in a county where water is costing $700 to $1000 per acre foot, we though this practice would have been a common practice. Added to this is the increasing pressure to reduce nitrate leaching into creeks and ground water, where there is a serious problem developing. The natural response when water prices are high is to reduce water use, but we have seen groves where even a 10% reduction in water reduces the yield by 50%, and we have also seen quite a few growers irrigating too much with the belief that a couple of extra feet of water per acre will more than pay the cost of water in increased yield. Clearly we need to apply enough water to make the trees produce a profitable yield, How does a farmer accomplish this?
I believe every grower should be using tensiometers or some other kind of soil moisture monitoring equipment to determine when to water, and using CIMIS to determine how much to water. There, just simply, is no an easier, or a better method.
Some growers said that tensiometers don’t work. Well, they work just fine if they are installed correctly and serviced periodically. If the soil gets too dry (the reading goes above 80 cb) the device breaks suction from the soil, and they don’t work until they are removed, filled, pumped and re-installed. As for gypsum blocks, they work just fine also, but are not very accurate under wet conditions. Both work a lot better than just guessing. There are newer electronic devices that work very well if calibrated with the soil moisture, but they don’t work very well in rocky soil (rocks don’t hold water).
Using CIMIS
This assignment is to help you figure out the water use in your grove. The following is a step by step procedure that is not difficult. Several of our grove managers use this on a weekly basis to calculate the water requirement in each of their groves. We have one grower who has this task assigned to his child in the third grade…Really, this is not that difficult!
This assignment will demonstrate how to use CIMIS to calculate the irrigation requirement for an avocado grove in Escondido. ETo is called the reference evapotranspiration (defined as the water use for eight inch tall grass), and all crops in California are related to this water use by adjusting ETo with a “crop coefficient”. In this example you will see that the crop coefficient for avocado in November is 0.55. ETo data is gathered from the automated weather stations that are part of the CIMIS network in California. The irrigation calculator you will be using multiplies the ETo number by the crop coefficient and gives you Etc, the water use by the crop in question. This comes from the station in “inches” of water loss, and the calculator changes this into gallons per tree per day. The calculator then tells you how much water to apply to the avocados to replace the water they used during the last seven days.
Go the website www.avocado.org
Click on California Industry (on the top right side of the page)
Click on Growers
Click on Water
Click on Irrigation Calculator
Start with Evapotranspiration (ETo).
Click on Go To CIMIS
Use the drop down box and Click on San Diego
Click on Submit
Choose Escondido
Click on Daily Data
- “Select a Time Period”, in this example we will select the previous week; select November 15 through November 21
- In “Select Variables”, leave everything selected with the green checkmark.
- Leave “English Units” selected.
- Click “Retrieve Data”
Write down ETo for the last week. In this case it will be: 0.12, 0.11, 0.11, 0.10, 0.12, 0.12 and 0.10.
Add these up, and you get 0.78 (this is your ETo for the past week). Minimize this window.
You are now back to the Irrigation Calculator on the Avocado website.
- Evapotranspiration, delete the 0.22 and fill in your 0.78
- Under “Crop Coefficient”, just click on November in the drop down box.
- Leave “Distribution Uniformity” at 0.85.
- Leave trees at 109 per acre.
- Leave sprinkler output at 17 gal/hr. (of course, you can change this to match your sprinkler output, but for the sake of this example, leave this at 17).
- Click on Calculate.
You should get 138 gallons (this is the amount of water used by one tree in the last seven days) and a watering run time of 8 hrs and 8 minutes.
As I mentioned earlier, you should have tensiometers (soil moisture meters) set at the 8 inch depth (avocado) or 12 inch depth (citrus) to tell you “when” to water. In avocados, I like to irrigate when the shallow tensiometer reads 20-25 cb, and in citrus when the tensiometer reads 35 – 40 cb. You cannot rely on irrigating every seven days because the tensiometer may tell you the soil is getting dry by the fourth day. This often happens in the summer.
To review, CIMIS tells you how much to water, the tensiometer tells you when to water. Now, in actual use, you may find that, in a windy area or on the south side of a slope, your trees may need more water. Merely add a 10% increase to the run time, and keep making minor adjustments until you get this right for your grove. Or, if you have root rot, you may want to water 10% to 30% less water.
By the way, if you are using this calculator for citrus, merely put 0.65 into the crop coefficient for each month, and you can use the same calculator. Some people believe the crop coefficient in the avocado calculator might be too low. Both Ben Faber and I believe the coefficient should be 0.80, but we don’t exactly have good data to support this…just experience. At any rate, the calculator will put you in the ballpark…and it is a lot better than “guessing”.
Give this a try, and Good Luck!
Irrigation Calculator developed by Reuben Hofshi, Shanti Hofshi and Ben Faber.


