I’ve been away from the blog for awhile, but thought I’d catch up a bit. I am in beautiful Madison Wisconsin (Lake Mendota! 90 degrees! Rain! Fried cheese curds!) for the NASA LP DAAC User Working Group meeting. This is a cool deal where imagery and product users meet with NASA team leaders to review products and tools. Since this UWG process is new to me, I am highlighting some of the key fun things I learned.
What is a DAAC?
A DAAC is a Distributed Active Archive Center, run by NASA Earth Observing System Data and Information System (EOSDIS). These are discipline-specific facilities located throughout the United States. These institutions are custodians of EOS mission data and ensure that data will be easily accessible to users. Each of the 12 EOSDIS DAACs process, archive, document, and distribute data from NASA's past and current Earth-observing satellites and field measurement programs. For example, if you want to know about snow and ice data, visit the National Snow and Ice Data Center (NSIDC) DAAC. Want to know about social and population data? Visit the Socioeconomic Data and Applications Data Center (SEDAC). These centers of excellence are our taxpayer money at work collecting, storing, and sharing earth systems data that are critical to science, sustainability, economy, and well-being.
What is the LP DAAC?
The Land Processes Distributed Active Archive Center (LP DAAC) is one of several discipline-specific data centers within the NASA Earth Observing System Data and Information System (EOSDIS). The LP DAAC is located at the USGS Earth Resources Observation and Science (EROS) Center in Sioux Falls, South Dakota. LP DAAC promotes interdisciplinary study and understanding of terrestrial phenomena by providing data for mapping, modeling, and monitoring land-surface patterns and processes. To meet this mission, the LP DAAC ingests, processes, distributes, documents, and archives data from land-related sensors and provides the science support, user assistance, and outreach required to foster the understanding and use of these data within the land remote sensing community.
Why am I here?
Each NASA DAAC has established a User Working Group (UWG). There are 18 people on the LP DAAC committee, 12 members from the land remote sensing community at large, like me! Some cool stuff going on. Such as...
New Sensors
Two upcoming launches are super interesting and important to what we are working on. First, GEDI (Global Ecosystem Dynamics Investigation) will produce the first high resolution laser ranging observations of the 3D structure of the Earth. Second, ECOSTRESS (The ECOsystem Spaceborne Thermal Radiometer Experiment on Space Station), will measure the temperature of plants: stressed plants get warmer than plants with sufficient water. ECOSTRESS will use a multispectral thermal infrared radiometer to measure surface temperature. The radiometer will acquire the most detailed temperature images of the surface ever acquired from space and will be able to measure the temperature of an individual farmer's field. Both of these sensors will be deployed on the International Space Station, so data will be in swaths, not continuous global coverage. Also, we got an update from USGS on the USGS/NASA plan for the development and deployment of Landsat 10. Landsat 9 comes 2020, Landsat 10 comes ~2027.
Other Data Projects
We heard from other data providers, and of course we heard from NEON! Remember I posted a series of blogs about the excellent NEON open remote sensing workshop I attended last year. NEON also hosts a ton of important ecological data, and has been thinking through the issues associated with cloud hosting. Tristin Goulden was here to give an overview.
Tools Cafe
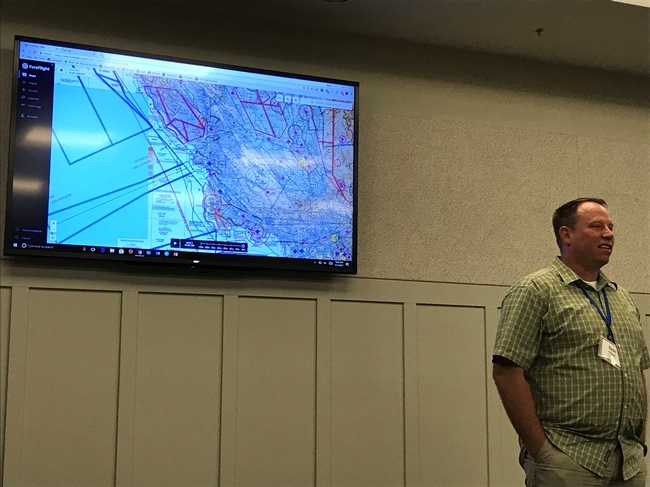
NASA staff gave us a series of demos on their WebGIS services; AppEEARS; and their data website. Their webGIS site uses ArcGIS Enterprise, and serves web image services, web coverage services and web mapping services from the LP DAAC collection. This might provide some key help for us in IGIS and our REC ArcGIS online toolkits. AppEEARS us their way of providing bundles of LP DAAC data to scientists. It is a data extraction and exploration tool. Their LP DAAC data website redesign (website coming soon), which was necessitated by the requirement for a permanent DOI for each data product.
User Engagement
LP DAAC is going full-force in user engagement: they do workshops, collect user testimonials, write great short pieces on “data in action”, work with the press, and generally get the story out about how NASA LP DAAC data is used to do good work. This is a pretty great legacy and they are committed to keep developing it. Lyndsey Harriman highlighted their excellent work here.
Grand Challenges for remote sensing
Some thoughts about our Grand Challenges: 1) Scaling: From drones to satellites. It occurs to me that an integration between the ground-to-airborne data that NEON provides and the satellite data that NASA provides had better happen soon; 2) Data Fusion/Data Assimilation/Data Synthesis, whatever you want to call it. Discovery through datasets meeting for the first time; 3) Training: new users and consumers of geospatial data and remote sensing will need to be trained; 4) Remote Sensible: Making remote sensing data work for society.
A primer on cloud computing
We spent some time on cloud computing. It has been said that cloud computing is just putting your stuff on “someone else’s computer”, but it is also making your stuff “someone else’s problem”, because cloud handles all the painful aspects of serving data: power requirements, buying servers, speccing floor space for your servers, etc. Plus, there are many advantages of cloud computing. Including: Elasticity. Elastic in computing and storage: you can scale up, or scale down or scale sideways. Elastic in terms of money: You pay for only what you use. Speed. Commercial clouds CPUs are faster than ours, and you can use as many as you want. Near real time processing, massive processing, compute intensive analysis, deep learning. Size. You can customize this; you can be fast and expensive or slow and cheap. You use as much as you need. Short-term storage of large interim results or long-term storage of data that you might use one day.
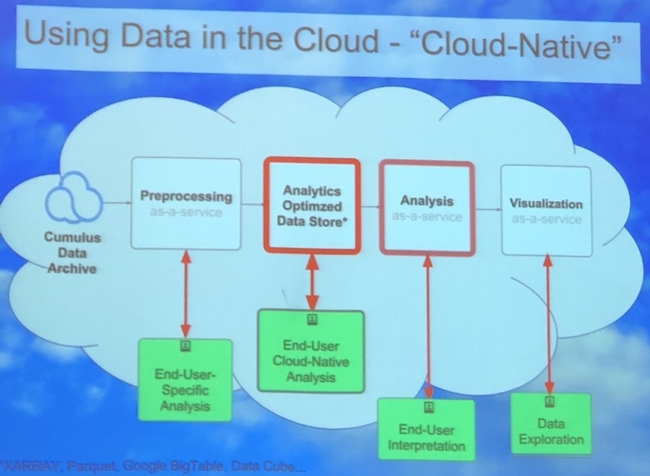
Image courtesy of Chris Lynnes
We can use the cloud as infrastructure, for sharing data and results, and as software (e.g. ArcGIS Online, Google Earth Engine). Above is a cool graphic showing one vision of the cloud as a scaled and optimized workflow that takes advantage of the cloud: from pre-processing, to analytics-optimized data store, to analysis, to visualization. Why this is a better vision: some massive processing engines, such as SPARC or others, require that data be organized in a particular way (e.g. Google Big Table, Parquet, or DataCube). This means we can really crank on processing, especially with giant raster stacks. And at each step in the workflow, end-users (be they machines or people) can interact with the data. Those are the green boxes in the figure above. Super fun discussion, leading to importance of training, and how to do this best. Tristan also mentioned Cyverse, a new NSF project, which they are testing out for their workshops.
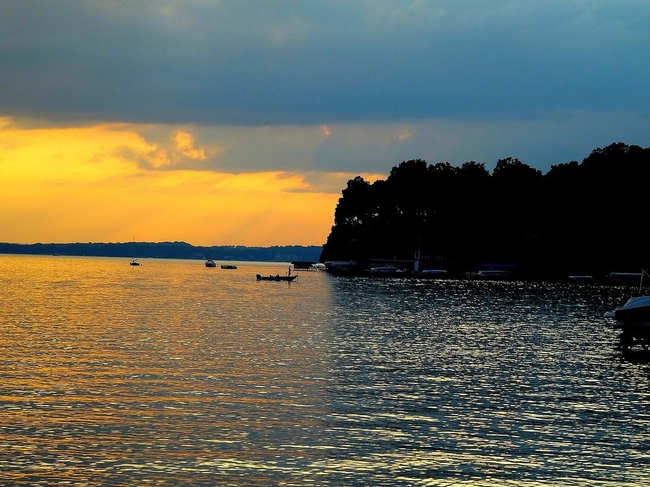
Image attribution: Corey Coyle
Super fun couple of days. Plus: Wisconsin is green. And warm. And Lake Mendota is lovely. We were hosted at the University of Wisconsin by Mutlu Ozdogan. The campus is gorgeous! On the banks of Lake Mendota (image attribution: Corey Coyle), the 933-acre (378 ha) main campus is verdant and hilly, with tons of gorgeous 19th-century stone buildings, as well as modern ones. UW was founded when Wisconsin achieved statehood in 1848, UW–Madison is the flagship campus of the UW System. It was the first public university established in Wisconsin and remains the oldest and largest public university in the state. It became a land-grant institution in 1866. UW hosts nearly 45K undergrad and graduate students. It is big! It has a med school and a law school on campus. We were hosted in the UW red-brick Romanesque-style Science Building (opened in 1887). Not only is it the host building for the geography department, it also has the distinction of being the first buildings in the country to be constructed of all masonry and metal materials (wood was used only in window and door frames and for some floors), and may be the only one still extant. How about that! Bye Wisconsin!
- Author: Sean Hogan
Last week IGIS was very pleased to partner with CERES Imaging Inc. (http://www.ceresimaging.net/) to provide a workshop on GIS and Remote Sensing for Crop Agriculture, in Davis CA. This particular event represents an example of how UC ANR's IGIS Program is working with private industries to better deliver valuable services (in this case training) to public audiences who are eager to put the services/information into action; reinforcing UC ANR's priorities of public service and Cooperative Extension.
This event was partially funded by a Department of Water Resources (DWR) grant to CERES, which among other things has helped CERES to provide very affordable, high resolution, multi-spectral, thermal and NDVI data to agriculturalists around California. The objective of the DWR funding was to help facilitate more agile farming practices for water conservation, through the adoption of newly available aerial image products, while introducing farmers to contemporary image processing and mapping methods. By partnering with CERES in this effort, IGIS is helping farmers to better utilize CERES's image products, to ideally make their operations more efficient and profitable.
Many of us have watched in horror and sadness over the previous week as fires consumed much of the beautiful hills and parts of the towns of Napa and Sonoma Counties. Many of us know people who were evacuated with a few minutes' notice - I met a retired man who left his retirement home with the clothes on his back. Many other friends lost everything - house, car, pets. It was a terrible event - or series of events as there were many active fires. During those 8+ days all of us were glued to our screens searching for up-to-date and reliable information on where the fires were, and how they were spreading. This information came from reputable, reliable sources (such as NASA, or the USFS), from affected residents (from Twitter and other social media), and from businesses (like Planet, ESRI, and Digital Globe who were sometimes creating content and sometimes distilling existing content), and from the media (who were ofen using all of the above). As a spatial data scientist, I am always thinking about mapping, and the ways in which geospatial data and analysis plays an increasingly critical role in disaster notification, monitoring, and response. I am collecting information on the technological landscape of the various websites, media and social media, map products, data and imagery that played a role in announcing and monitoring the #TubbsFire, #SonomaFires and #NapaFires. I think a retrospective of how these tools, and in particular how the citizen science aspect of all of this, helped and hindered society will be useful.
In the literature, the theoretical questions surrounding citizen science or volunteered geography revolve around:
-
Accuracy – how accurate are these data? How do we evaluate them?
-
Access – Who has access to the data? Are their technological limits to dissemination?
-
Bias (sampling issues)/Motivation (who contributes) are critical.
-
Effectiveness – how effective are the sites? Some scholars have argued that VGI can be inhibiting.
-
Control - who controls the data, and how and why?
-
Privacy - Are privacy concerns lessened post disaster?
I think I am most interested in the accuracy and effectiveness questions, but all of them are important. If any of you want to talk more about this or have more resources to discuss, please email me: maggi@berkeley.edu, or Twitter @nmaggikelly.
Summary so far. This will be updated as I get more information.
Outreach from ANR About Fires
-
ANR has a number of programs dedicated to fire preparedness, recovery, and prevention.
Core Geospatial Technology During Fires
-
Wildfire products
-
Fire perimeters from https://www.geomac.gov/services.shtml
-
The Active Fire Perimeters layer is a product of Geospatial Multi-Agency Coordination (GeoMAC). In order to give fire managers near real-time information, fire perimeter data is updated daily based upon input from incident intelligence sources, GPS data, infrared (IR) imagery from fixed wing and satellite platforms.”
-
-
MODIS hot spots from USFS Active Fire Mapping Program. MODIS The MODIS instrument is on board NASA's Earth Observing System (EOS) Terra (EOS AM) and Aqua (EOS PM) satellites. In addition to lots of other data, MODIS delivers Channel 31 brightness temperature (in Kelvins) of a hotspot/active fire pixel.
-
For more on how these are made: http://www.arcgis.com/home/item.html?id=b4ce4179b04f47e4ba79e234205565c1
-
-
-
WebGIS sites
-
Media using maps (super short list)
-
http://projects.sfchronicle.com/2017/interactive-map-wine-country-fires/
-
NYTimes: Minutes to Escape: How One California Wildfire Damaged So Much So Quickly. https://www.nytimes.com/interactive/2017/10/21/us/california-fire-damage-map.html?smid=fb-nytimes&smtyp=cur
-
NYTimes: How California's Most Destructive Wildfire Spread, Hour by Hour. OCT. 21, 2017. https://www.nytimes.com/interactive/2017/10/21/us/california-fire-damage-map.html?smid=fb-nytimes&smtyp=cur
- SFGate focusing on SkyIMD: http://www.sfgate.com/news/article/incredible-aerial-photos-wine-country-fires-12285123.php
-
-
Social media
-
Twitter: #sonomafires, #napafires, #tubbsfire
-
Flickr: SonomaFires, TubbsFires, NapaFires, etc.
-
Core Technology for Post-Fire Impact
-
High resolution imagery collection and analysis
-
From satellite
-
Planet has made fire imagery available: https://www.planet.com/pulse/northern-california-wildfire-satellite-data-available-for-access/
-
Digital Globe + MapBox made a post-fire tool: (Author: @robinkraft
Email: rkraft4@gmail.com, Github repo, Source: Overview News // DigitalGlobe 2017): https://robinkraft.github.io/norcal-fires-imagery/compare.html; https://blog.mapbox.com/santa-rosa-fire-satellite-imagery-a31b6dfefdf8
- Digital Globe - Open Data Program: https://www.digitalglobe.com/opendata
-
Sonoma Veg Map Program has a few links to interesting stuff including ArcGIS Server Drone and Digital Globe Imagery: http://sonomavegmap.org/blog/2017/10/17/fires/
-
-
From aircraft
-
I know SkyIMD was flying the entire time.
- First Map - Flights 10/11-10/14/17 Here: http://www.skyimd.com/napa-sonoma-fire-imagery-map/
- Second Map - Flight 10/20/17 - Here: http://www.skyimd.com/napa-sonoma-fire-imagery-map-2/
-
-
From drone:
-
Greg Crutsinger from @droneScholars made this available: Aftermath of #TubbsFire: https://www.mapbox.com/bites/00382/#18/38.4763/-122.74861
-
Open Aerial Map has one drone image not sure the source https://map.openaerialmap.org/#/-122.7497720718384,38.471986484020334,16/square/023010201213/59e62be93d6412ef7220c4c0?_k=hm0j7l
-
-
UC ANR's IGIS program hosted 36 drone enthusiasts for a three day DroneCamp in Davis California. DroneCamp was designed for participants with little to no experience in drone technology, but who are interested in using drones for a variety of real world mapping applications. The goals of DroneCamp were to:
- Gain an broader understanding of the drone mapping workflow: including
- Goal setting, mission planning, data collection, data analysis, and communication & visualization
- Learn about the different types of UAV platforms and sensors, and match them to specific mission objectives;
- Get hands-on experience with flight operations, data processing, and data analysis; and
- Network with other drone-enthusiasts and build the California drone ecosystem.
The IGIS crew, including Sean Hogan, Andy Lyons, Maggi Kelly, Robert Johnson, Kelly Easterday, and Shane Feirer were on hand to help run the show. We also had three corporate sponsors: GreenValley Intl, Esri, and Pix4D. Each of these companies had a rep on hand to give presentations and interact with the participants.
Day 1 of #DroneCamp2017 covered some of the basics - why drone are an increasingly important part of our mapping and field equipment portfolio; different platforms and sensors (and there are so many!); software options; and examples. Brandon Stark gave a great overview of the Univ of California UAV Center of Excellence and regulations, and Andy Lyons got us all ready to take the 107 license test. We hope everyone here gets their license! We closed with an interactive panel of experienced drone users (Kelly Easterday, Jacob Flanagan, Brandon Stark, and Sean Hogan) who shared experiences planning missions, flying and traveling with drones, and project results. A quick evaluation of the day showed the the vast majority of people had learned something specific that they could use at work, which is great. Plus we had a cool flight simulator station for people to practice flying (and crashing).
Day 2 was a field day - we spent most of the day at the Davis hobbycraft airfield where we practiced taking off, landing, mission planning, and emergency maneuvers. We had an excellent lunch provided by the Street Cravings food truck. What a day! It was hot hot hot, but there was lots of shade, and a nice breeze. Anyway, we had a great day, with everyone getting their hands on the commands. Our Esri rep Mark Romero gave us a demo on Esri's Drone2Map software, and some of the lidar functionality in ArcGIS Pro.
Day 3 focused on data analysis. We had three workshops ready for the group to chose from, from forestry, agriculture, and rangelands. Prior to the workshops we had great talks from Jacob Flanagan and GreenValley Intl, and Ali Pourreza from Kearney Research and Extension Center. Ali is developing a drone-imagery-based database of the individual trees and vines at Kearney - he calls it the "Virtual Orchard". Jacob talked about the overall mission of GVI and how the company is moving into more comprehensive field and drone-based lidar mapping and software. Angad Singh from Pix4D gave us a master class in mapping from drones, covering georeferencing, the Pix4D workflow, and some of the checks produced for you a the end of processing.
One of our key goals of the DroneCamp was to jump start our California Drone Ecosystem concept. I talk about this in my CalAg Editorial. We are still in the early days of this emerging field, and we can learn a lot from each other as we develop best practices for workflows, platforms and sensors, software, outreach, etc. Our research and decision-making teams have become larger, more distributed, and multi-disciplinary; with experts and citizens working together, and these kinds of collaboratives are increasingly important. We need to collaborate on data collection, storage, & sharing; innovation, analysis, and solutions. If any of you out there want to join us in our California drone ecosystem, drop me a line.
Thanks to ANR for hosting us, thanks to the wonderful participants, and thanks especially to our sponsors (GreenValley Intl, Esri, and Pix4D). Specifically, thanks for:
- Mark Romero and Esri for showing us Drone2Map, and the ArcGIS Image repository and tools, and the trial licenses for ArcGIS;
- Angad Singh from Pix4D for explaining Pix4D, for providing licenses to the group; and
- Jacob Flanagan from GreenValley Intl for your insights into lidar collection and processing, and for all your help showcasing your amazing drones.
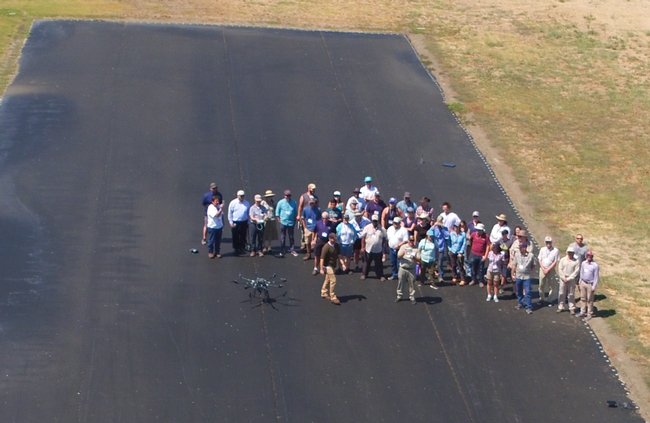
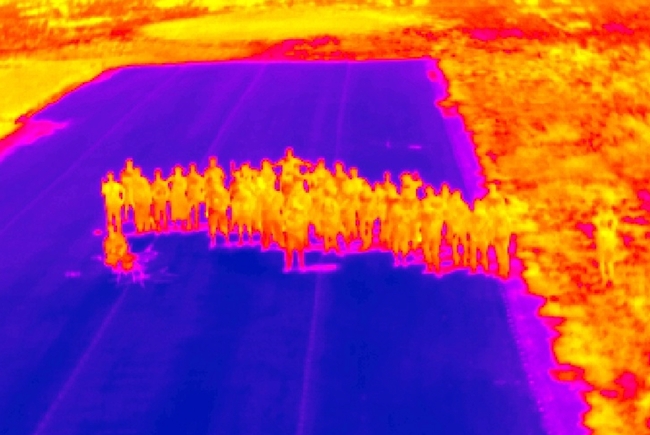
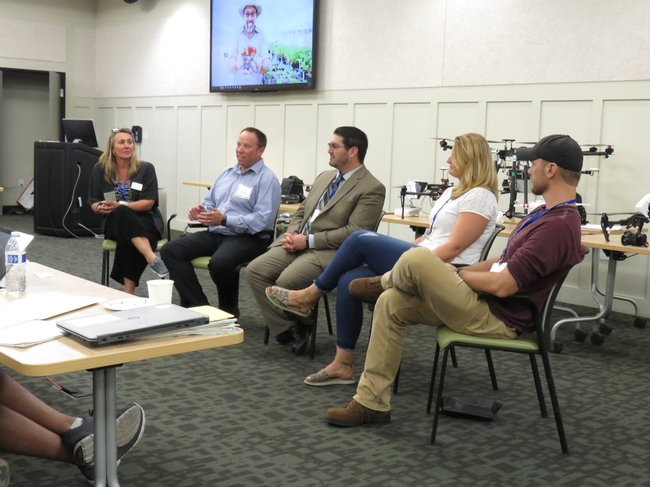
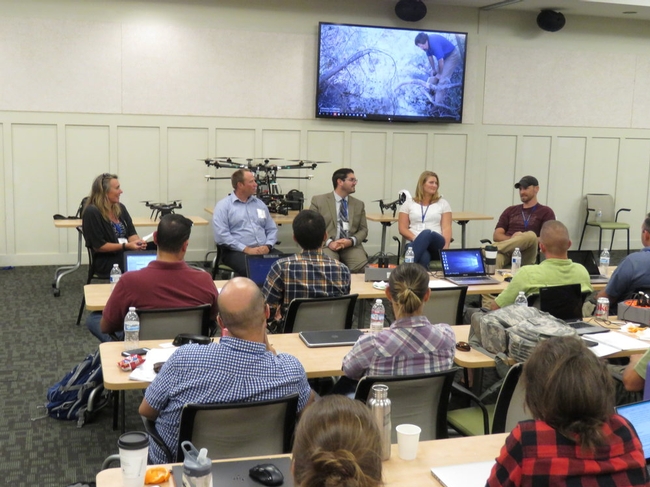
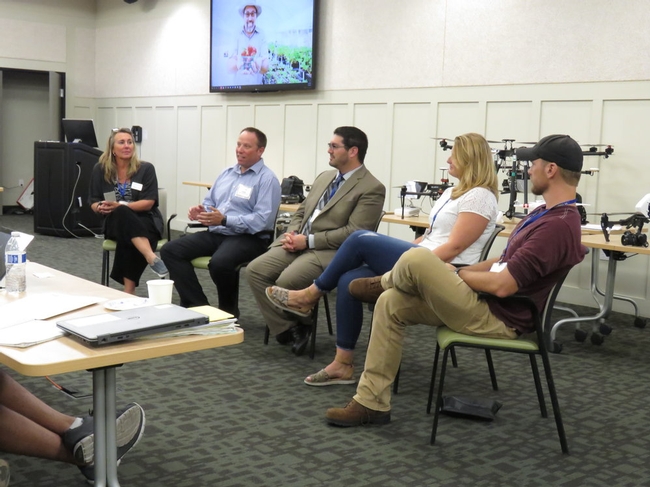
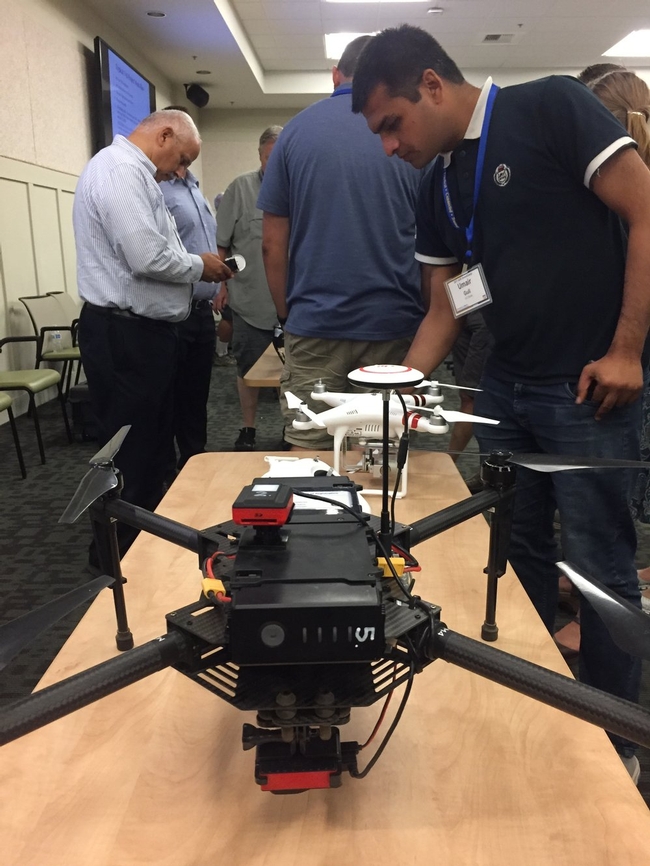
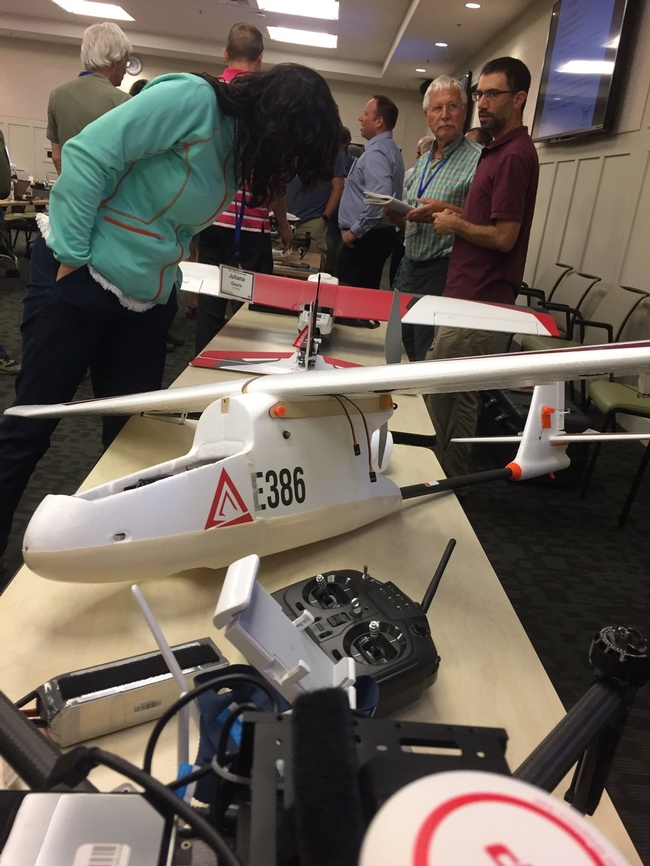
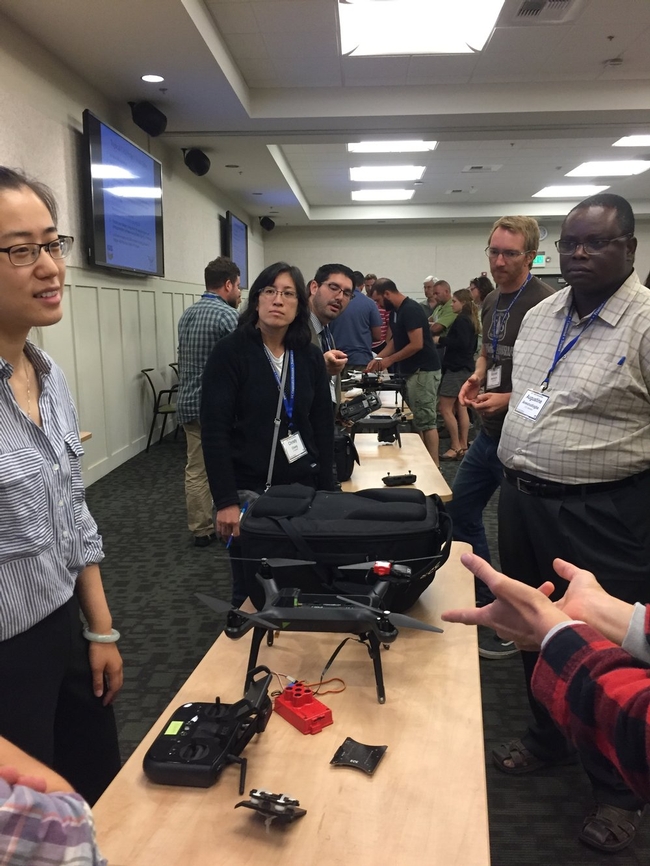
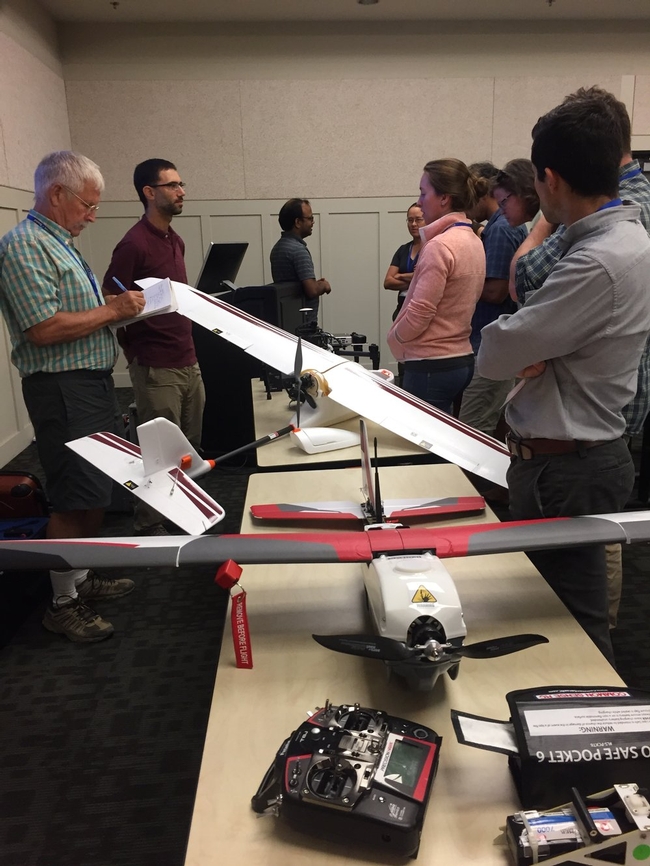
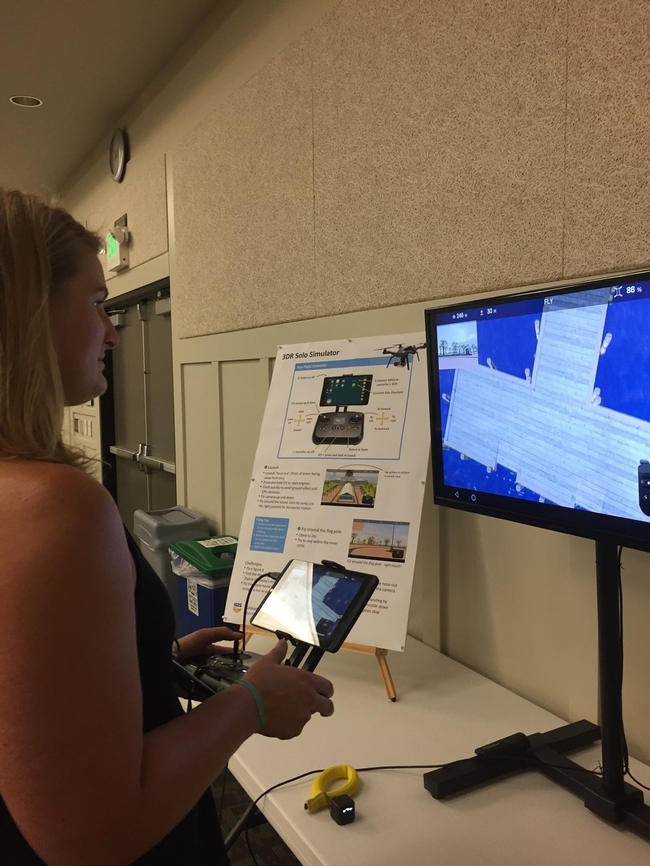
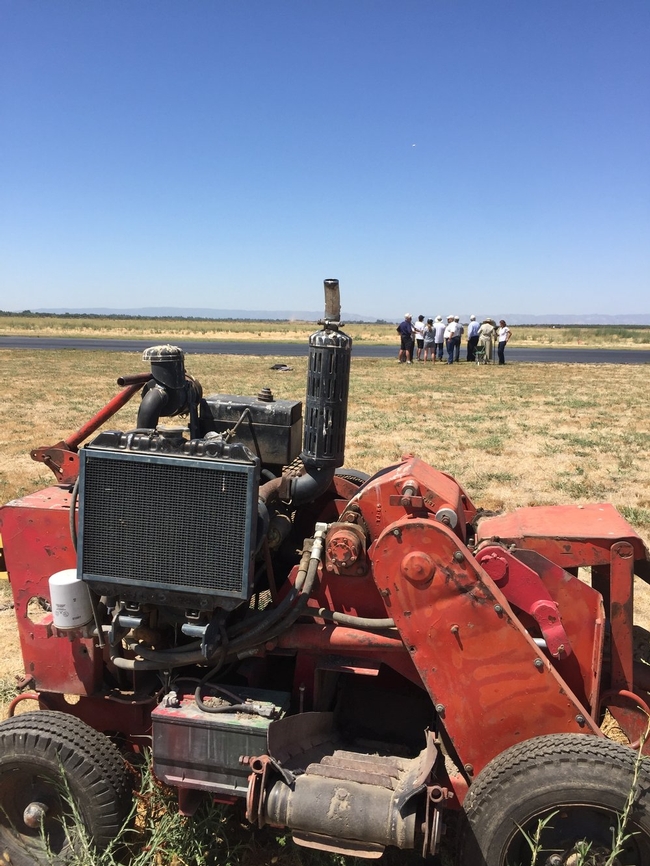
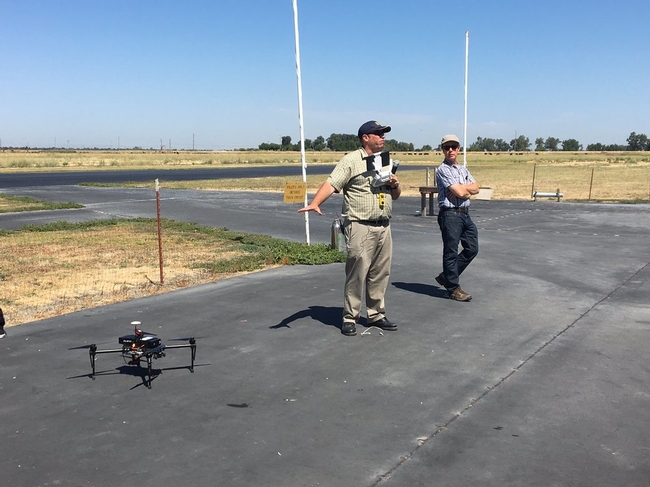
#KeepCalmAndDroneOn!
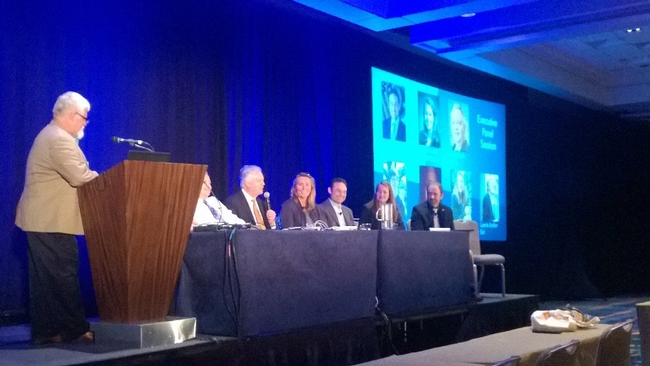
Esri has been holding these Imagery and Mapping Forum days prior to the main UC. I was here for the day, as an invited panelist for the Executive Panel and Closing Remarks session on Sunday. During the day Ihung out in the Imaging and Innovation Zone, in front of the Drone Zone (gotta get one of these for ANR).
Notes from the day: Saw demos from a range of vendors, including:
- Aldo Facchin from Leica gave a slideshow about the Leica Pegasus: Backpack. Their backpack unit workflow uses SLAM; challenges include fusion of indoor and outdoor environments (from transportation networks above and below ground). Main use cases were industrial, urban, infrastructure. http://leica-geosystems.com/en-us/products/mobile-sensor-platforms/capture-platforms/leica-pegasus-backpack
- Jamie Ritche from Urthecast talked about "Bringing Imagery to Life". He says our field is "a teenager that needs to be an adult". By this he means that in many cases businesses don't know what they need to know. Their solution is in apps- "the simple and the quick": quick, easy, disposable and useful. 4 themes: revisit, coverage, time, quality. Their portfolio includes DEIMOS 1, Theia, Iris, DEIMOIS-2, PanGeo + . Deimos-1 focuses on agriculture. UrtheDaily: 5m pixels, 20TB daily, (40x the Sentinel output); available in 2019. They see their constellation and products as very comparable to Sentinel, Landsat, RapidEye. They've been working with Land O Lakes as their main imagery delivery. Stressing the ability of apps and cloud image services to deliver quick, meaningful information to users. https://www.urthecast.com/
- Briton Vorhees from SenseFly gave an overview of: "senseFly's Drone Designed Sensors". They are owned by Parrot, and have a fleet of fixed wing drones (e.g. the eBee models); also drone optimized cameras, shock-proof, fixed lens, etc (e.g. SODA). These can be used as a fleet of sensors (gave an citizen-science example from Zanzibar (ahhh Zanzibar)). They also use Sequoia cameras on eBees for a range of applications. https://www.sensefly.com/drones/ebee.html
- Rebecca Lasica and Jarod Skulavik from Harris Geospatial Solutions: The Connected Desktop". They showcased their new ENVI workflow implemented in ArcGIS Pro. Through a Geospatial Services Framework that "lifts" ENVI off the desktop; and creates an ENVI Engine. They showed some interesting crop applications - they call it "Crop Science". This http://www.harrisgeospatial.com/
- Jeff Cozart and McCain McMurray from Juniper Unmanned shared "The Effectiveness of Drone-Based Lidar" and talked about the advantages of drone-based lidar for terrain mapping and other applications. They talked through a few projects, and wanted to demonstrate the economies for drone-based lidar. The main advantages are in the data, not in the economics per se. They partner with Reigl and YellowScan from France. Showcased an example in Colorado between lidar (DJI Matrice was platform) and survey - the cost was 1/24th as expensive as the field survey. They did a live demo of some of the ArcGIS tools: classification of ground, feature extraction, etc. http://juniperunmanned.com/
- Aerial Imaging Productions talked about their indoor scanning - this linking indoor to outdoor - making data truly geo - is a big theme here. Also OBJ is a data format. From Wikipedia: "The OBJ file format is a simple data-format that represents 3D geometry alone — namely, the position of each vertex, the UV position of each texture coordinate vertex, vertex normals, and the faces that make each polygon defined as a list of vertices, and texture vertices." Used for 3D graphics, but increasingly for indoor point clouds in our field.
- My-Linh Truong from Reigl talked about their new static, mobile, airborne, uav lidar platforms. They've designed some mini lidar sensors for smaller UAVas (3lbs; 100kHz; 250m range; ~40pts/m2). Their ESRI workflow is called LMAP, and it relies on some proprietary REIGL software processing at the front end, then transfer to ArcGIS Pro (I think). http://www.rieglusa.com/index.html
We wrapped up the day with a panel discussion, moderated by Esri's Kurt Schwoppe, and including Lawrie Jordan from Esri, Greg Koeln from MDA, Dustin Gard-Weiss from NGA, Amy Minnick from DigitalGlobe, Hobie Perry from USFS-FIA, David Day from PASCO, and me. We talked about the promise and barriers associated with remote sensing and image processing from all of our perspectives. Some fun things that came out of the panel discussion were:
- Lawrie Jordan started Erdas!
- Digital Globe launched their 30cm resolution WorldView-4. One key case study was a partnership with Associated Press to find a pirate fishing vessel in action in Indonesia. They found it, and busted it, and found on board 2,000 slaves.
- The FIA is increasingly working on understanding uncertainty in their product, and they are moving for an image-base to a raster-based method for stratification.
- Greg Koeln, from MDA (he of the rad tie) says: "I'm a fan of high resolution imagery...but the world is a big place".
- Multi=sensor triangulation (or georeferencing a stack of imagery from multiple sources to you and me) is a continual problem, and its going to get worse before it gets better with more imagery from UAVs. On that note, Esri bought the patent for "SIFT" an automated tool for relative registration of an image stack.
- Space Junk!
Notes and stray thoughts:
- Esri puts on a quality show always. San Diego always manages to feel simultaneously busy and fun, while not being crowded and claustrophobic. Must be the ocean or the air.
- Gotta get behind the ubiquitous "analytics" replacement of "analysis" in talks. I am not convinced everyone is using the term correctly, but hey, it's a thing now: https://en.wikipedia.org/wiki/Analytics#Analytics_vs._analysis
- 10 years ago I had a wonderful visitor to my lab from Spain - Francisco Javier Lozano - and we wrote a paper: http://www.sciencedirect.com/science/article/pii/S003442570700243X. He left to work at some crazy company called Deimos in Spain, and Lo and Behold, he is still there, and the company is going strong. The Deimos satellites are part of the UrtheCast fleet. Small world!
- The gender balance at the Imagery portion of the Esri UC is not. One presenter at a talk said to the audience with a pointed stare at me: "Thanks for coming Lady and Gentlemen".
Good fun! Now more from Shane and Robert at the week-long Esri UC!
