Volunteering Commitment Changes
Volunteers are essential to Cooperative Extension programs.
Over the past few years I have been reflecting on some challenges facing our office’s programs such as 4-H and Master Gardeners that have emerged since the Covid-19 Pandemic. It feels more difficult to rely on volunteers, and certainly our staff is working harder to make up for the reduced effort available that would have once been performed by our volunteers.
We are not alone. Many organizations utilize volunteers to extend their reach or their capacity.
To find out if there are larger trends, I’ve done some research into what could be going on.
Since the pandemic, most papers and reports I’ve reviewed start with some statement alluding to challenges finding volunteers. This plea from Meals on Wheels is characteristic. Our department is in a similar situation.
A 2023 report from the Do Good Institute at the University of Maryland School of Public Policy states that 46.8% of CEOs of volunteer organizations now say that recruiting sufficient volunteers is a “big problem” whereas in 2003 on 29% reported that challenge.
There are likely many causes involved. Common sentiments I’ve heard include “a change in priorities” or “taking a break.” While there was a burst of research initiated as a result of the pandemic and its highly consequential constriction of volunteerism opportunities, post-pandemic research on volunteerism is still emerging.
I am not a social scientist, so reading papers in that discipline comes with as much ease as I can get through a story written in German. But I can look at numbers to see if there is something interesting going on.
And it turns out there is something to see.
To investigate further, I downloaded harmonized microdata from IPUMS’s CPS and ATUS portals along with the appropriate weights, and ran descriptive statistics to find out more. For consistency I looked at odd-year data only as there were gaps in 2020 data, and from 2017 Census changed their methodology and timing to odd years only. I selected 2009 since that was the beginning our local Master Gardener program, and I wanted to consider the ramifications of volunteer changes in that context, post 2008’s Great Recession. (In a future post I will cover how you can investigate data like this on your own with a little help from AI tools.)
Every two years the Census Bureau in coordination with AmeriCorps now conducts the Current Population Survey Civic Engagement and Volunteer Supplement. Prior to that there was an annual survey conducted that included some volunteer data as well back to 2002. The data tell a story of a rebound in formal volunteering rates post-Covid, but not quite completely. Volunteering looks different now and that change has some surprising attributes.
First let’s look at volunteerism rates and how they have changed (Chart 1.) Rates were fairly steady pre-Covid, but unsurprisingly, they dropped during the pandemic. You’ll note that they have mostly recovered, but not fully. Only Millennials have exceeded pre-pandemic levels as a cohort. Volunteer rates are now better, but overall there are slightly fewer individuals formally volunteering through organizations or associations.
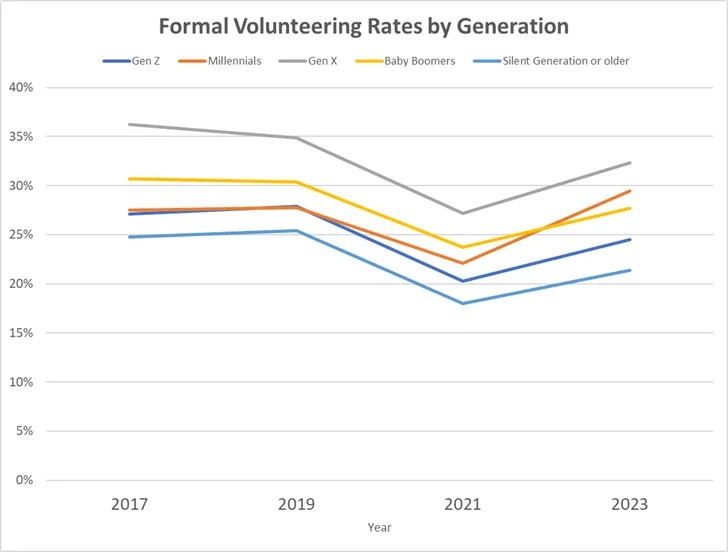
Chart 1. Formal Volunteering Rates by Generation. Data from AmeriCorps. Formal volunteering is any volunteer work done through an organization or association.
According to a 2024 Census Bureau report, volunteer and civic participation rates have largely rebounded. That rebound varies considerably by geography, but here I’m considering national data only. Nationally, participation rates by individuals have largely recovered with some variation by demographic. This means that there are volunteers out there to be recruited.
The other half of the volunteer equation, however, is the time served by each volunteer. Think of it as volunteer intensity or commitment, which has more significant long-term ramifications than the availability of volunteers during a one-off crisis. That’s not to say the pandemic wasn’t a critical component of the current volunteer trends. It certainly disrupted the flow of individuals who would gain organizational experience, then subsequently take on leadership roles. Eventually that impact should fade.
My original hypothesis was that since Covid-19 was so disruptive, certainly the inflection point for volunteerism changes must center around 2020. I know that as a manager of volunteers I can see a change in participation in all our local programs after the pandemic as compared to before. With that in mind I downloaded the data and compared pre- and post-Covid-19. To make that spread as far as possible I compared 2017 and 2023 data, which is the approach used in the Census report mentioned above. The histogram below (Chart 2) shows a clear shift to the left for all ranges of participation, representing a smaller time commitment for volunteers. There is a large spike at the lowest (leftmost) bucket which represents 0 to 25 hours of volunteer work. The blue bar at the right represents the most dedicated volunteers with more than 575 hours. You can see even the most dedicated volunteers reduced their commitment, shifting to 500-525 hours bucket.
It’s clearer with a table since 25 hours is above the median value of 2023 volunteer hours: over half of all the data points are below 25 hours. Table 1 shows, along with a large reduction in means from 96.5 to 70, the median values are much less. In fact every part of the percentile table has a smaller value. The data have always been highly skewed to the left, but it is now more extreme.
While the number of people volunteering has recovered, their intensity of participation has diminished substantially in that time. Essentially what this means is that if you were to measure the total volunteer output in the data (e.g. volunteers x hours) there is a large difference from 2017.
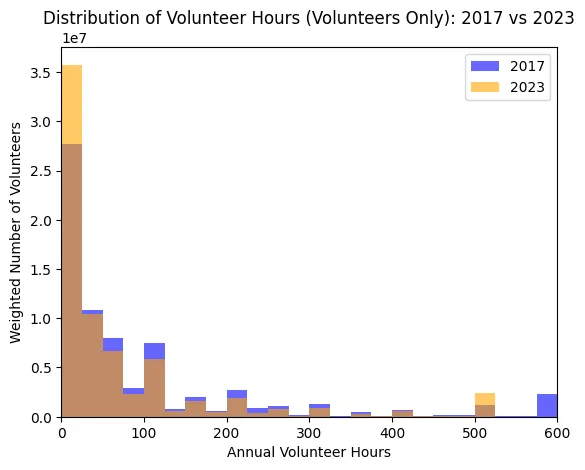
Chart 2. Distribution of volunteer hours: 2017 vs 2023, for those who volunteer. Volunteer units are millions.
Table 1. Weighted percentile table with means of annual volunteer hours among volunteers from Current Population Survey.
Year | P5 | P10 | P25 | Median | P75 | P90 | P95 | Mean |
|---|---|---|---|---|---|---|---|---|
2017 | 4 | 6 | 15 | 40 | 100 | 260 | 500 | 96.5 |
2023 | 3 | 4 | 10 | 24 | 80 | 200 | 312 | 70.0 |
Looking at a longer timescale reveals something fascinating. Chart 3 shows the changes in volunteer intensity actually began before Covid-19 and actually begins a stable period in 2019.

Chart 3. Decline in volunteer hours by volunteers begins before the Covid-19 lockdowns in 2020.
A similar review of the Bureau of Labor Statistics’ American Time Use Studies from the same year shows a similar pattern with very different methodology. See Table 2. There is definitely a large reduction in the 2021 data from the 2019 for % volunteering, but the time reduction (mean minutes/per day) aligns well with the Census/AmeriCorps means data.
Table 2. Weighted ATUS Results, 2009-2023
Year | Mean minutes/day (population) | % volunteering that day |
2009 | 9.10 | 7.18% |
2011 | 9.05 | 6.12% |
2013 | 8.50 | 6.12% |
2015 | 8.71 | 6.50% |
2017 | 9.24 | 6.08% |
2019 | 7.60 | 5.53% |
2021 | 5.41 | 4.05% |
2023 | 5.84 | 4.62% |
Essentially there appears to be 3 phases:
- a stable period from 2009 to 2015;
- a major transition centered around 2017;
- a more stable (but slightly declining) period from 2019 onward.
This result aligns with literature regarding a rise in “episodic volunteering” first identified by Nancy McDuff in 1990 with an excellent review of the topic here by Cnaan et al. (2022).
What does this mean? In short it seems reasonable based on these data that there have been underlying changes happening with volunteerism that are disconnected from the disruptions caused by Covid-19. If you’ve been feeling that it’s been harder to get the same output from volunteers than in the past, you’re not imagining things.
Potential causes appear to be complex and beyond our scope here. Reviewing the literature it’s not at all clear to me that anyone has landed on a single cause as an answer.
It seems clear that if these volunteer trends continue, then it may be important to consider changes to how we manage volunteer programs. For example, in California the Master Gardener and Master Food Preserver Programs both require 50 hours of service the first year and 25 thereafter, along with continuing education requirements. Both of those values exceed the median volunteer commitment, with 50 hours closer to the 69th percentile. (In other words, more committed than over 2/3 of all volunteers.)
Groups relying on volunteers will need to adapt to provide shorter service opportunities and excellent volunteer support and engagement.
The people are out there, they just are less free with donating their time.