Affordability Analysis of Bakersfield's Proposed 2026-2031 Sewer Rate Increases
Affordability Analysis of Bakersfield's Proposed 2026-2031 Sewer Rate Increases
Laljeet Sangha, Ph.D. UC Cooperative Extension Advisor– UCCE Kern
Key Takeaways
- Bakersfield needs to invest in its aging sewer system. That is not in question.
- At the proposed FY 2030-31 rate of $875/year, an estimated 33,700 households (24%) would exceed the EPA's 2.5% wastewater affordability threshold.
- Infrastructure investment and customer protections may both be necessary for the rate transition to succeed.
Background
The City of Bakersfield is proposing sewer rate increases over the next five years to fund critical infrastructure improvements, including the replacement of the Planz Road wastewater treatment plant built in the 1950s. The total investment needed is estimated at $500 to $600 million. These infrastructure needs are real, and this analysis does not dispute them. The proposed rate schedule raises the annual single-family residential sewer charge from $247 to $875 over five fiscal years.
Household-Level Affordability Analysis
The U.S. EPA's wastewater affordability guidance (USEPA 1997) establishes 2.5% of household income as the threshold above which wastewater costs represent a high financial burden. At the proposed FY 2030-31 rate of $875 per year, any household earning less than $35,000 annually would exceed this threshold.
The U.S. Census Bureau reports the number of households within 16 income ranges for each census tract (American Community Survey Table B19001, 2019-2023 5-Year Estimates). For each rate step, the income threshold below which sewer costs exceed 2.5% of income is calculated (for example, $35,000 at the $875/year rate). The number of households below that threshold is then estimated for each census tract by summing across income ranges and interpolating within the range that contains the threshold (Maxcy-Brown et al., 2024).
This estimate reflects sewer charges alone. It does not include drinking water, electricity, rent, or other household costs that also shape affordability. At the current rate of $247 per year, approximately 6,200 households (4.4%) exceed the affordability threshold. By FY 2030-31, that number reaches approximately 33,700 households, or 24.1% of estimated households in the sewer service area (Figure 1). About one in four households would spend more than 2.5% of their income on sewer charges alone, before accounting for water bills.

Figure 1 Estimated households with unaffordable sewer access under the proposed rate schedule
Figure 2 shows the geographic distribution of affordability impacts across the sewer service area at the proposed FY 30/31 rate. Census tracts with the highest share of affected households are concentrated in central and east Bakersfield.
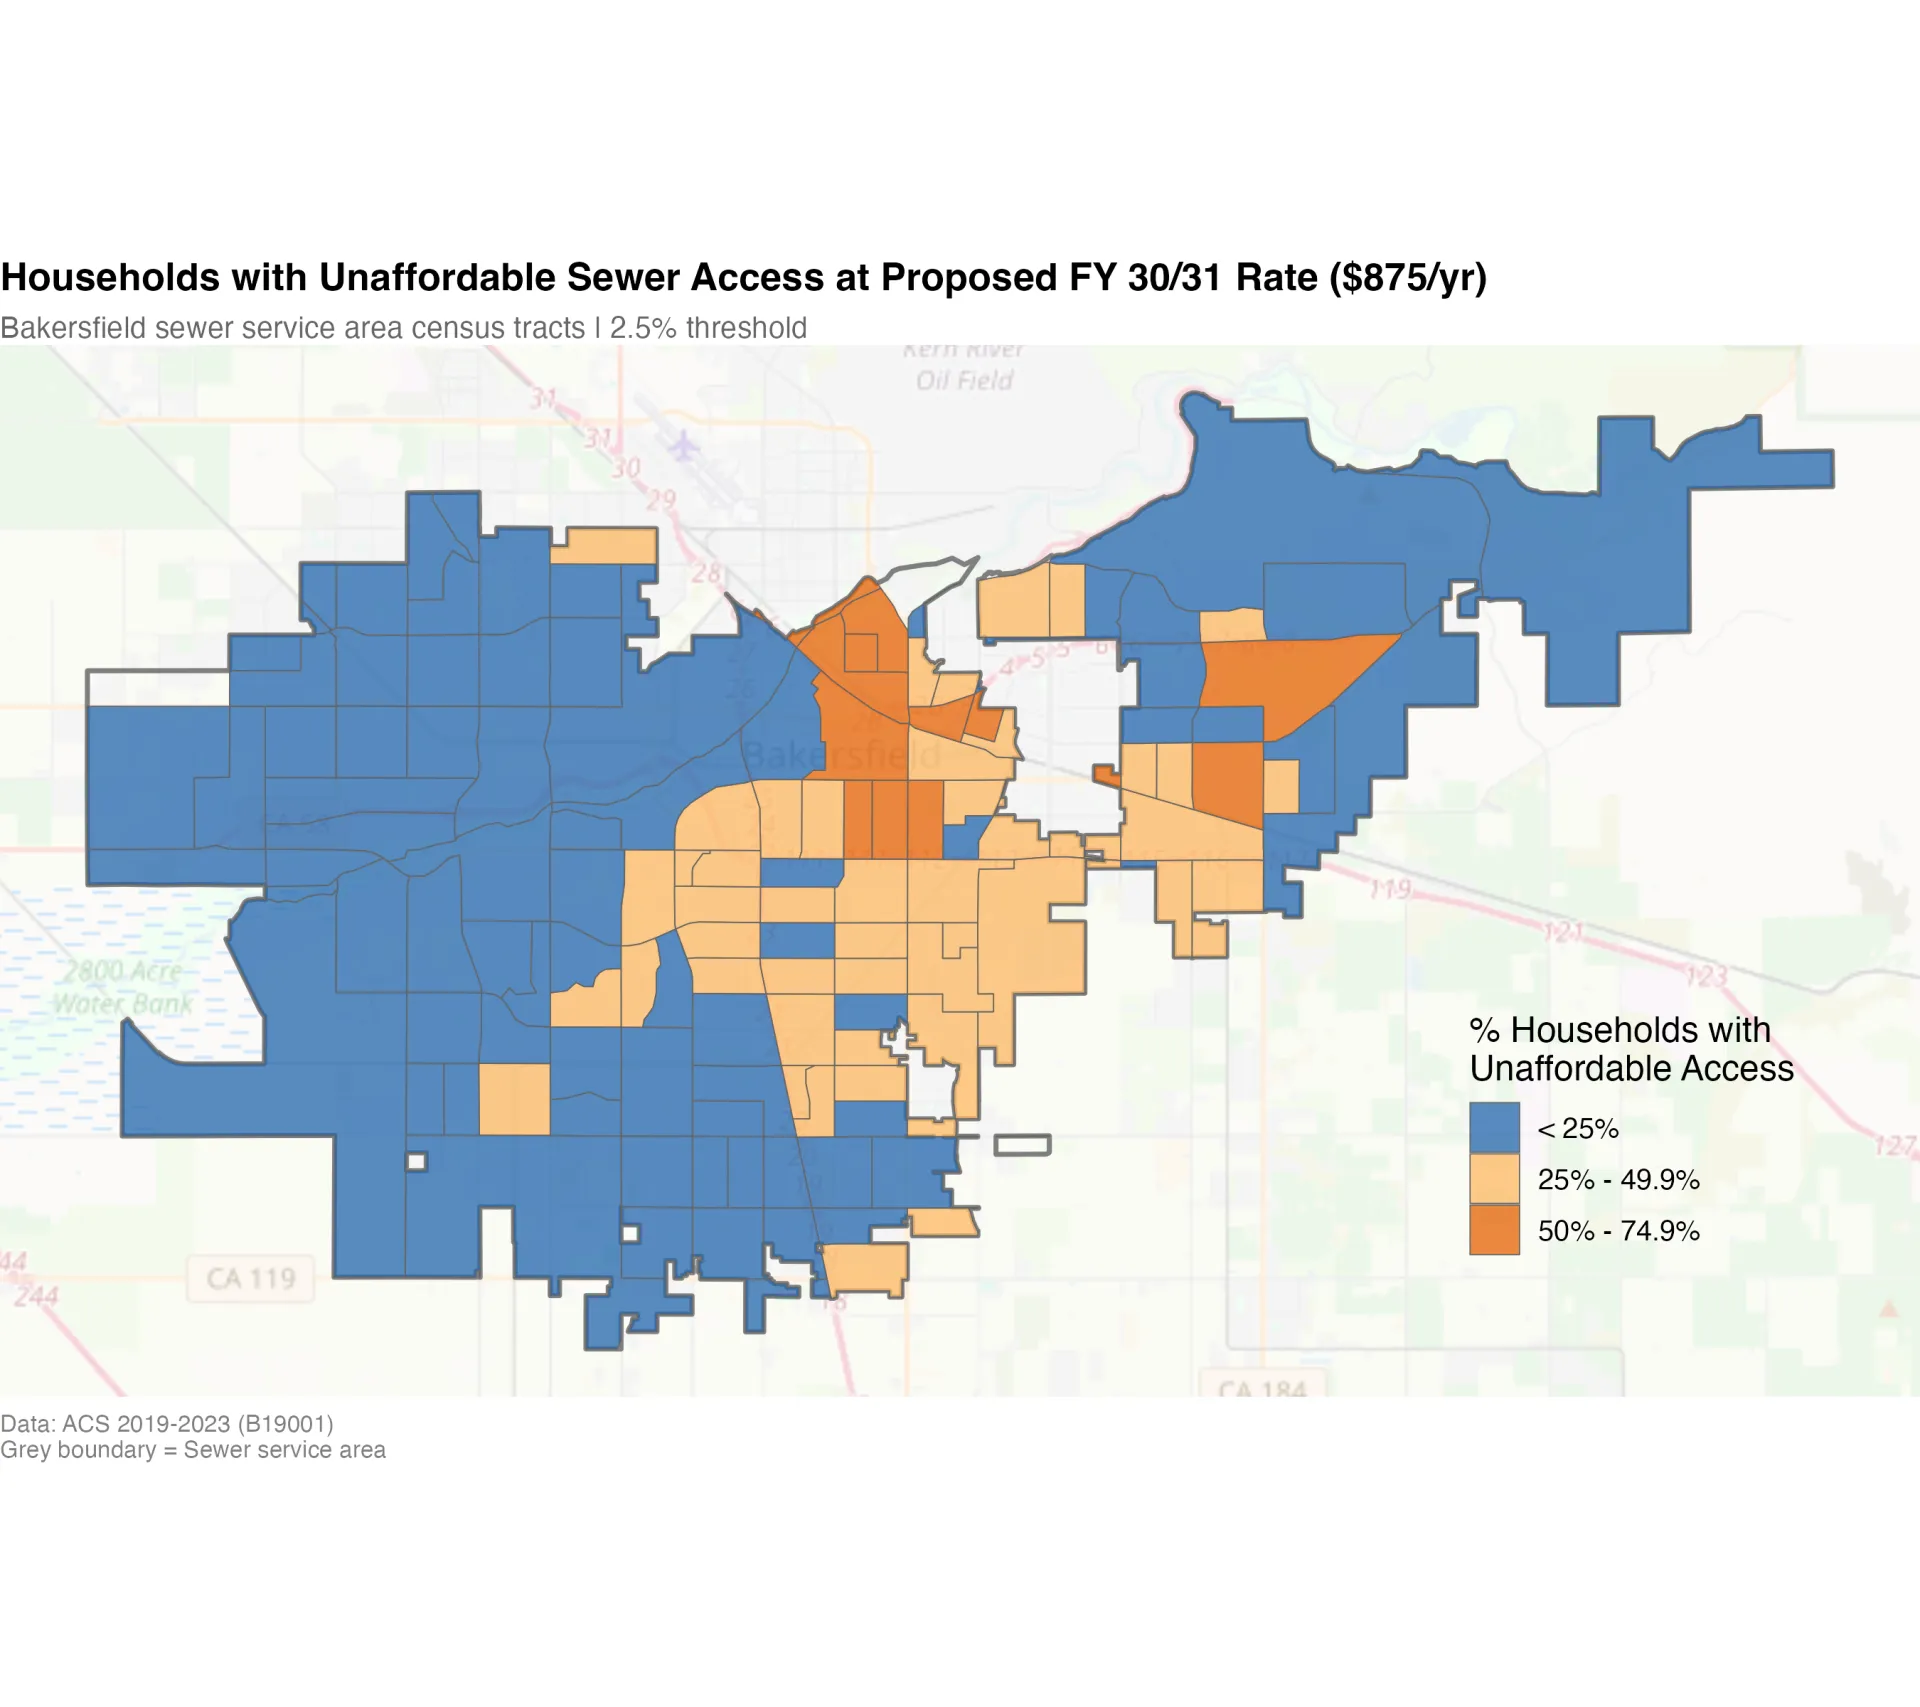
Figure 2 Geographic distribution of affordability impacts across the sewer service area
Income Growth and Rate Increases
The income data used in this analysis reflects the 2019-2023 period. One reasonable question is whether future income growth could offset some of the affordability impact by FY 2030-31. To test this, the analysis modeled four income growth scenarios: no growth, 2% per year (roughly inflation), 3% per year (moderate growth), and 5% per year (very optimistic for Bakersfield).
The proposed rate increase from $247 to $875 represents a 254% increase. Even at 5% annual income growth sustained over nine years, cumulative income growth would be approximately 55%. The rate increase outpaces even the most optimistic income growth assumption by a wide margin. We found that under a moderate 3% growth assumption, approximately 24,600 households (17.5%) would still exceed the affordability threshold by FY 2030-31. Even under the most optimistic scenario, nearly 20,000 households (14.2%) remain affected (Figure 3).
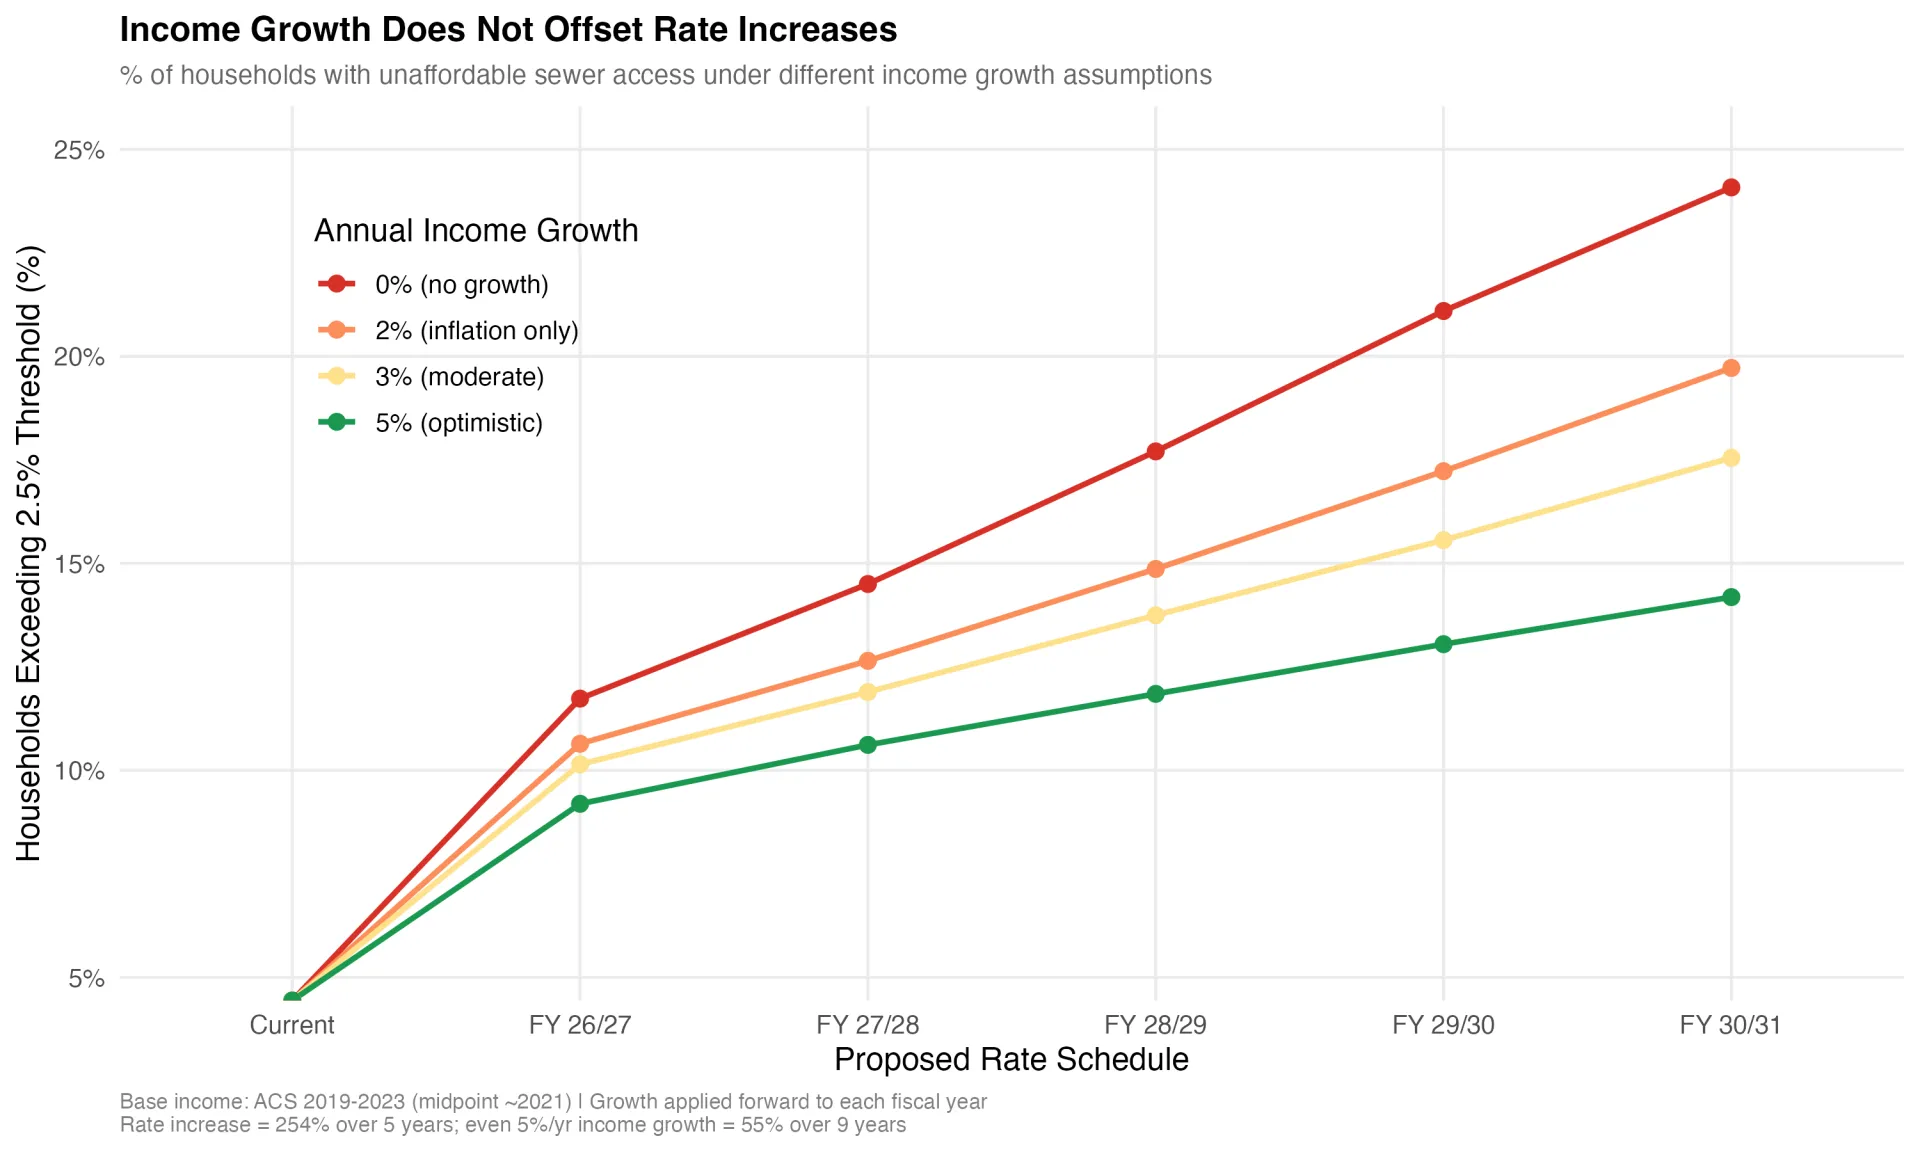
Figure 3 Comparison of income growth with sewer rate schedule
Putting Rates in Context
The preceding analysis uses household-level income data within the Bakersfield sewer service area. A similar household-level comparison across cities would require service area boundaries and tract-level income data for each city, which are not readily available. However, even a simpler comparison at the city scale illustrates why absolute dollar comparisons can be incomplete.
Comparing sewer rates across cities in absolute dollars does not account for differences in household income. A $900 sewer charge represents a different share of the household budget in a city where the median household income is $141,000 (San Jose) than in one where it is $77,000 (Bakersfield). Figure 4 compares the various cities but adds median household income from the U.S. Census Bureau (ACS 2019-2023 5-Year Estimates) and calculates the sewer charge as a share of income. At the proposed FY 30/31 rate, Bakersfield's sewer burden reaches 1.13% of MHI, surpassing Sacramento (0.99%) and matching Los Angeles (1.13%). Even after the first few rate steps, Bakersfield's burden matches and surpasses some of the bigger cities with higher income.
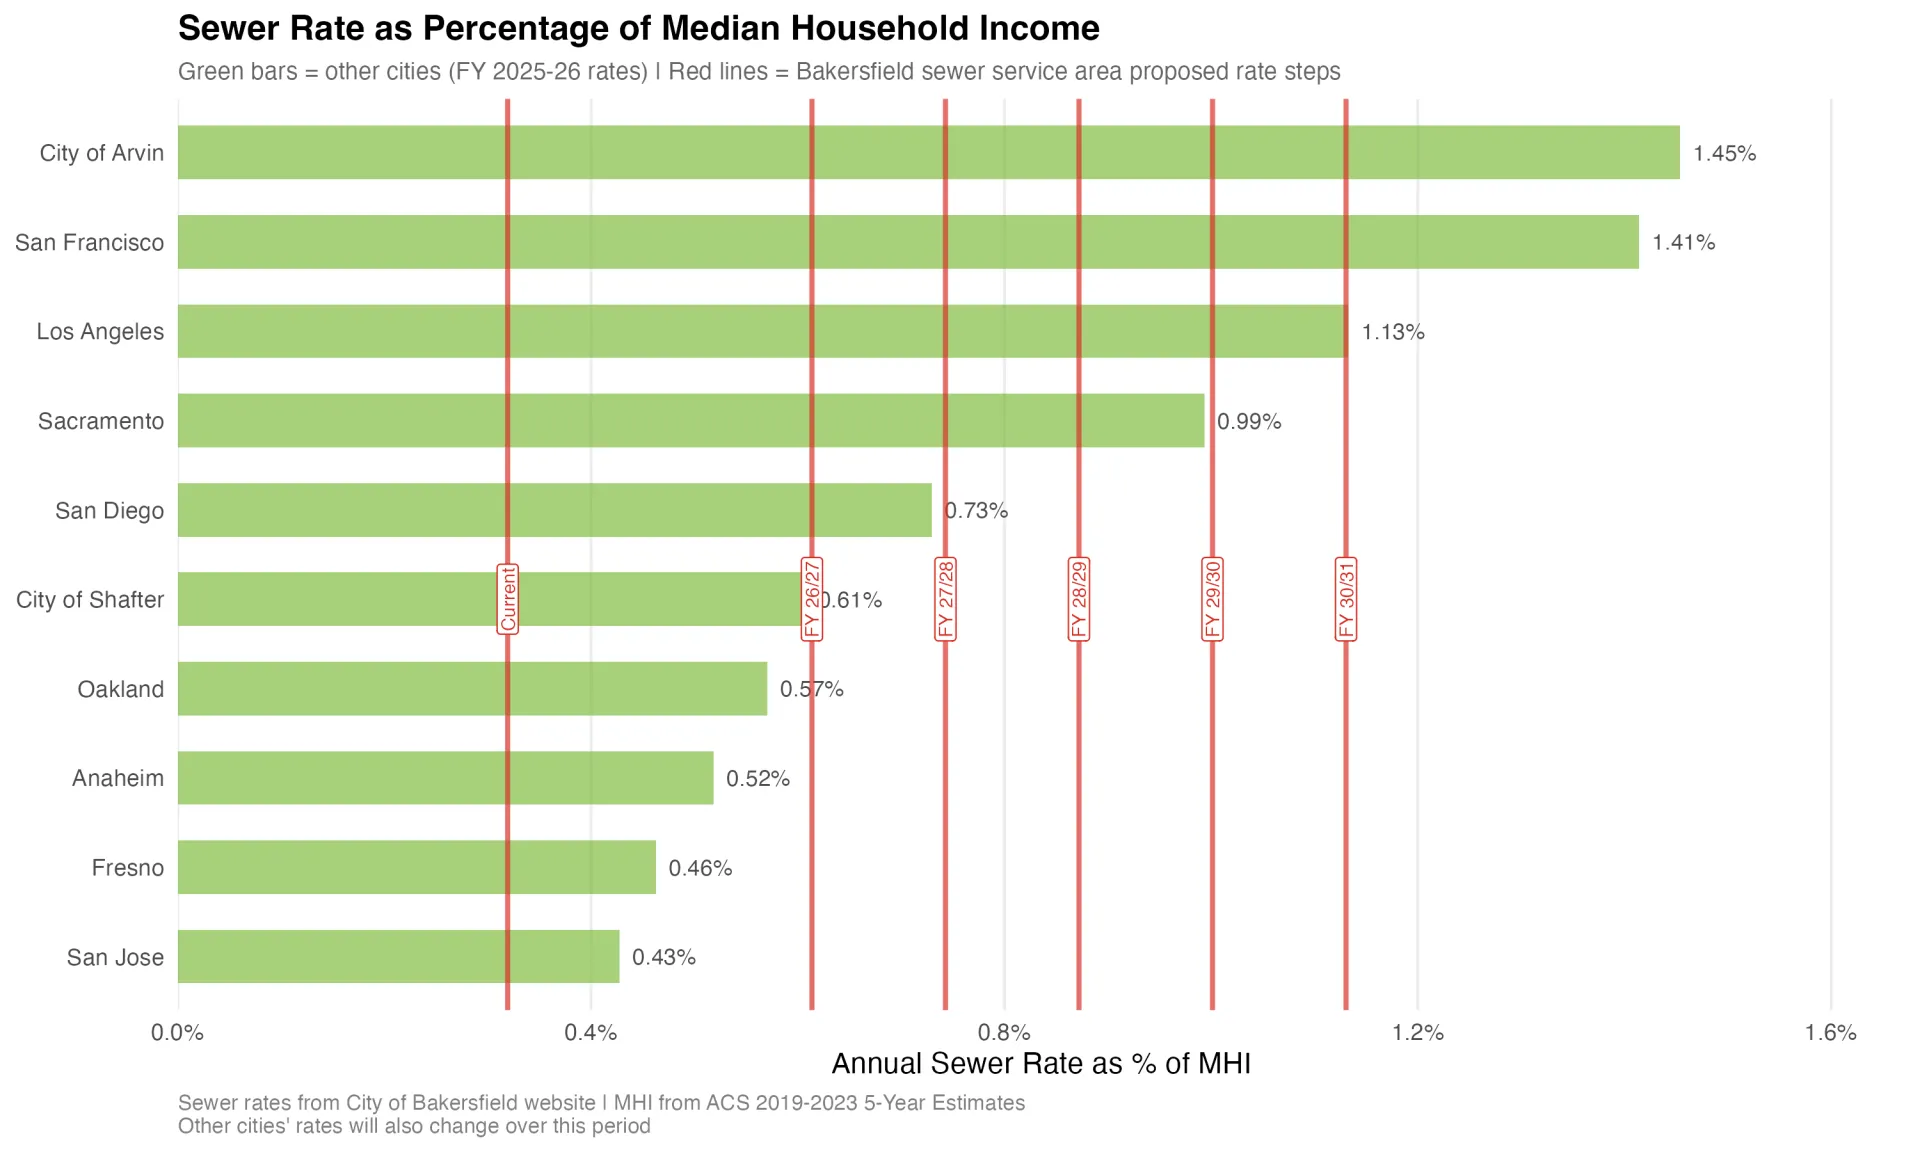
Figure 4 Comparison of Bakersfield sewer rates with other cities
Preparing for the Impact
This analysis supports the need for infrastructure investment. The sewer system must be upgraded. This analysis puts a number on how many households could be pushed past the EPA affordability threshold under the proposed sewer rates.
City leadership has already recognized that affordability is a concern. In public meetings, staff acknowledged that while state law requires uniform sewer rates for all ratepayers, the City Council could create assistance programs funded through general tax resources to help households struggling to pay. The city has also moved toward a more gradual rate phase-in after residents pushed back against the original proposal. These are positive steps.
Approximately 33,700 households, nearly one in four across the service area, will exceed the EPA's 2.5% affordability threshold by the end of the proposed rate schedule. That number gives the city a starting point for designing assistance programs that are sized to the scale of the problem and targeted to the households most likely to struggle.
Other California utilities have implemented programs that protect vulnerable customers without undermining financial sustainability (Maxcy-Brown et al., 2024). The Water Environment Federation's research shows that customer assistance programs typically affect only 1.0% to 1.5% of total gross revenue, while reducing delinquent accounts and administrative collection costs (Maxcy-Brown et al., 2024; Rothstein, 2006).
A household-level affordability assessment can help the city understand the full scale of the impact and plan accordingly. Infrastructure investment and customer protections may both be necessary for the rate transition to succeed.Doing both ensures that the sewer system upgrade succeeds financially and that the households it serves can afford to stay connected.
Data
This analysis uses publicly available U.S. Census Bureau American Community Survey data for census tracts in Kern County, including household income distributions and median household income estimates. These data were combined with a sewer service area boundary shapefile and the proposed Bakersfield sewer rate schedule to estimate wastewater affordability across the service area. The analysis used only aggregated public data and did not include any individual or household-level identifying information. All code created for this analysis is publicly available at: https://github.com/laljeet/BakWasteWater.
References
Maxcy-Brown, J., Elliott, M. A., Barnett, M. O., Krummen, K., & Christian, L. (2024). Evaluating Statewide Wastewater Affordability for Users of Sewer Systems and Onsite Wastewater Treatment Systems Based on Household Incomes at the Census Tract Level. Journal of Water Resources Planning and Management, 150(10), 04024040. https://doi.org/10.1061/JWRMD5.WRENG-6308
Rothstein, E. P. (2006). AFFORDABILITY OF WASTEWATER SERVICE: ASSESSMENT & OPTIONS FOR REGULATORY & PROGRAMMATIC RELIEF. 686–693. https://www.accesswater.org/publications/proceedings/-293040/affordability-of-wastewater-service--assessment---options-for-regulatory---programmatic-relief
