2021 Organic Acreage Trends Across California
Background
California has always been a leader in organic agriculture. Since 2002, when the USDA National Organic Program went into effect, market demand for organic products has driven a continuous expansion of certified organic acreage in California. As of 2024, California more than doubled the next leading state in total certified organic acreage, total organic farms and total organic production value1. Recently, organic agriculture has gained further traction through public grant programs at the state (e.g., California Department of Food and Agriculture (CDFA) Organic Transition Pilot Program2) and federal levels (e.g. US Department of Food and Agriculture (USDA) Transition to Organic Production Program3) as well as state sustainability targets that include increasing organic acreage (e.g. CA Air Resources Board 2022 Scoping Plan For Achieving Carbon Neutrality)4.
With such growing opportunities to continue expanding organic agriculture in California, there is a need to better understand trends in organic production across the state. Here, we present an analysis of harvested acreage data from 2021 made available by the CDFA State Organic Program (SOP) as well as county-level statistical data reported through the USDA National Agricultural Statistics Service (NASS). The goal of this analysis was to characterize geographic and crop-specific trends in organic production. Improved understanding of the current distribution of organic agriculture – as well as the relative share of organic at the county and crop level – can help guide the development of more targeted strategies to ensure technical assistance, outreach, and financial incentives are relevant and accessible for organic producers.
Key Findings – Certain Crops and Counties Trend Towards Organic
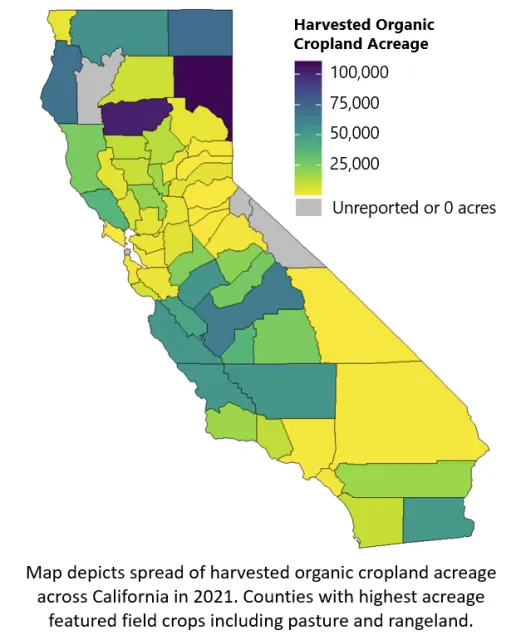
Results from this analysis showcase the wide diversity of organic agriculture present across California – and highlights key regions and cropping systems where organic production is more (or less) common. For the year 2021, 4.4% of the total cropland harvested in California was certified organic. Organic agriculture can be found throughout California, with 54 of the 58 counties reporting harvested organic acreage in 2021. Counties that did not report any organic acreage included Alpine, Mono, San Francisco, and Trinity Counties.
The top five counites in harvested certified organic acreage (Lassen, Tehama, Modoc, Humboldt, and Fresno) accounted for 36% of the total statewide harvested organic acreage. The top counties for harvested organic acreage heavily featured field crop, pasture, and rangeland systems with Fresno County in the 5th spot featuring a wide range of cropping systems. Given that these field crop and animal agricultural systems require extensive land to operate profitably, this may help explain why 4 of the 5 top counties ended up as leaders in total harvested organic acreage. In contrast, the top counties for total harvested acreage overall (Kern, Tulare, Monterey, Inyo, and Mono) accounted for 28%.
Almonds and wine grapes were leaders for both total harvested acreage and total organic acreage. Other crops – such as spinach, carrots, and seed crops – were leaders for total harvested organic acreage, but overall represented a lower share of total harvested acreage, suggesting there may be an organic niche for these crops.
Similar to some of the crop-level trends, there were multiple counties that had a high level of both total harvested acreage as well as total organic acreage. This included Fresno, Monterey, Kern, Merced, and Tehama counties. This may not be surprising, though, given that these counties (especially Fresno, Monterey, and Kern Counties) produce a significant amount of specialty crop commodities exported from California generally and are in the top ten counties for agricultural sales nationwide5.
In contrast, some counties such as Humboldt, San Luis Obispo, Imperial, San Benito, and Sonoma had comparatively lower total harvested cropland acreage but were leaders in terms of total harvested organic cropland acreage, suggesting that organic production may have a unique niche in these regions. Finally, when considering organic as a proportion of the total harvested acreage in a county, the top two leading counties were Santa Cruz and San Luis Obispo (with >50%) followed by Sutter, Marin, Imperial and Modoc counties (12-17%). Crops including spinach, all other berries excluding strawberries, carrots, lettuce, celery and broccoli were all leaders with >20% of statewide acres under organic production.
Project Limitations – Dataset Comparability Challenges
While this analysis revealed some interesting trends for organic agriculture in California, substantial differences in data collection methodologies between the CDFA SOP organic acreage and NASS total acreage datasets made it difficult to infer trends for certain crops and regions. For instance, a category called “Sum of Others” is used to maintain the privacy of producers when a county has a small number of producers for a specific crop category in the NASS total harvested acreage dataset. This results, in some cases, in a large proportion of a crop category not having a geographic location associated with it. For example, 57% of the carrots crop data is reported as “Sum of Others” – meaning that 57% of reported harvested acreage for carrots did not have a county assigned to the data to maintain producer anonymity. This made it difficult to infer any county-level trends for crop categories with high proportions of acreage reported as “Sum of Others”. Furthermore, animal production was incomparable because CDFA SOP data presented animal production categories in terms of total acreage and lumped rangeland and pasture in as field crops. Contrastingly, NASS datasets presented animal production in terms of units (e.g. head of cattle) and rangeland and pasture as their own acreage categories. As such, this analysis focused only on harvested cropland acreage. Finally, differences in data collection resulted in notable discrepancies for some crop categories and counties in California.
Downloadable project documents
Do you have a question or would like more information? Please contact Krista Marshall (knmarshall@ucanr.edu)
Citations
USDA Organic Survey Highlights 2023 – U.S. Department of Agriculture, National Agricultural Statistics Service. (2023, January).2022Organicsurveyhighlights. https://www.nass.usda.gov/Publications/Highlights/2022/2022_Organic_Highlights.pdf
CDFA – California Department of Food and Agriculture. Organic Transition Pilot Program. https://www.cdfa.ca.gov/oars/otp/
USDA – U.S. Department of Agriculture. Transition to Organic Partnership Program. https://www.organictransition.org/
CARB – California Air Resources Board. 2022 Scoping Plan For Achieving Carbon Neutrality. https://ww2.arb.ca.gov/sites/default/files/2023-04/2022-sp.pdf
CDFA – California Department of Food and Agriculture. (2024, May 7). California’s organic agriculture breaks records in 2022 [Blog post]. Planting Seeds Blog. https://plantingseedsblog.cdfa.ca.gov/wordpress/?p=27335