


All Issues
Point- and reach-scale measurements are important for determining accurate seepage rates in controlled flow channels
Publication Information
California Agriculture 75(2):74-82. https://doi.org/10.3733/ca.2021a0013
Published online August 04, 2021
PDF | Citation | Permissions
NALT Keywords
Abstract
A critical component of water-resources management in the irrigated agriculture landscape, particularly those landscapes dependent on groundwater availability, is determining groundwater recharge rates from streams and other channels. In California, flows in many such channels are “controlled” by upstream reservoir releases to meet downstream urban, irrigation and environmental water requirements. Seepage volumes from these channels and how they might vary during controlled release periods is a key component of meeting downstream riparian and groundwater-pumping needs. Understanding annual seepage from streamflow channels is also important in developing water budgets as part of the management of groundwater resources under the Sustainable Groundwater Management Act (SGMA) in California. However, direct measurements of channel seepage rates are infrequent or unavailable, and these rates, or associated volumes, are most often only estimated. Here we describe direct point- and reach-scale field measurements of channel seepage rates in Lower Putah Creek (Solano County) and in distribution lateral channels of the Oakdale Irrigation District on the east side of the San Joaquin Valley (San Joaquin and Stanislaus counties). We measured overall average seepage rates of about 2 feet (610 mm) per day at both locations and determined how these rates varied spatially and temporally during the summer when channel flows are controlled for downstream requirements.
Full text
In many semi-arid and arid regions, irrigated agriculture is the largest water user across the landscape. Irrigation has a profound impact on water allocations for other uses critical to civilization (e.g., urban supplies, industrial supplies and hydropower) as well as on local riparian environments (Lankford 2013). However, water diversions in earthen channels used in the irrigation process can result in substantial seepage to shallow groundwater storage. Seepage volumes vary depending in part on the water levels (flows) within streams or diversion channels and in part on field irrigation water-management; both are central to assessment of groundwater recharge rates. Several studies that employ soil-water balance and other methods have estimated rates of groundwater recharge for several irrigated crops and conditions in California (e.g., Grismer et al. 2000; Grismer 2012; Grismer and Asato 2012; Platts and Grismer 2014; Zikalala et al. 2019). Only recently have studies begun considering the effects of groundwater augmentation, particularly the flooding of cropped fields and orchards during winter rainy periods. These studies continue to rely on soil-water-balance methodologies even though they include some direct measurements of changes in shallow groundwater levels associated with recharge (e.g., Dahlke et al. 2018).
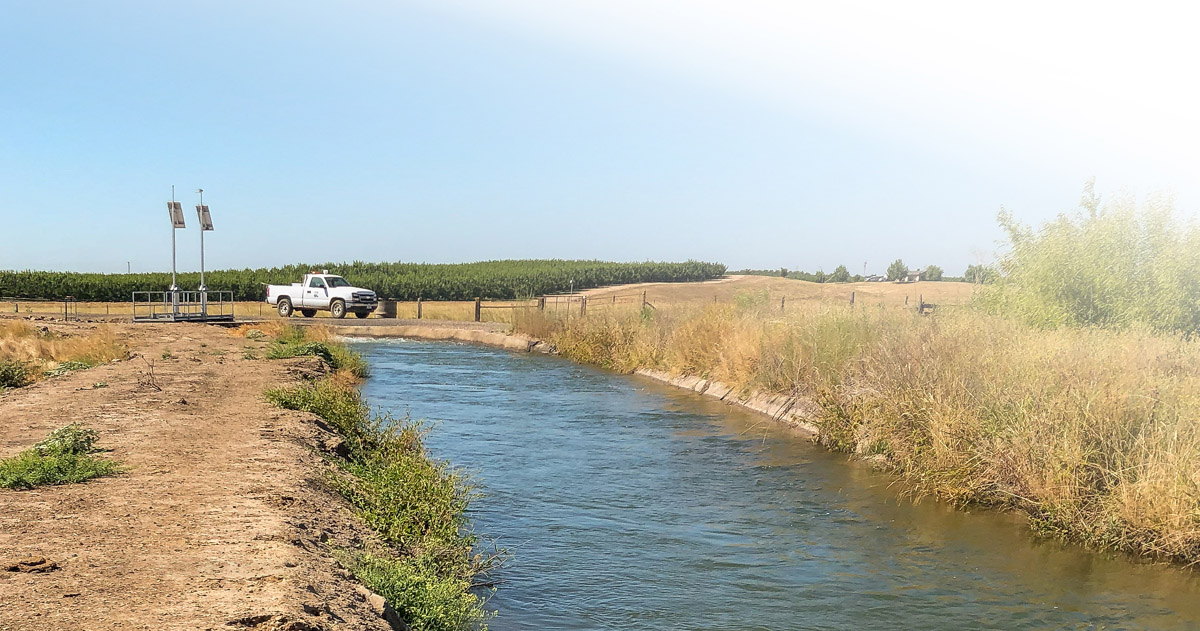
An irrigation canal in the San Joaquin Valley. Quantifying possible groundwater recharge from streams and earthen channels is important in developing water budgets under the Sustainable Groundwater Management Act. Photo: AJ Borba.
Groundwater recharge practices may become an important management tool in irrigated basins subject to periodic drought, adding some resiliency to the landscape hydrology. Though efforts have been made to identify likely streamflow-groundwater recharge areas across the state (Dahlke and Kocis 2018), estimations of seepage rates in the stream channels or canals in these areas are usually based on underlying soil texture. Few, if any, direct measurements of channel seepage are available for use in surface-to-groundwater modeling efforts required for developing local groundwater sustainability management plans under the Sustainable Groundwater Management Act (SGMA).
Similarly, a key element of integrated water resources management both locally and at watershed scales is an assessment of net seepage volumes to groundwater from canals, streams, lakes and the deep percolation (and associated lag times) from excess rain or irrigation, all of which enable quantification of a basin in water-balance terms. In most groundwater basins under consideration for management plans, such quantification has relied on modeling efforts where annual basin seepage quantities are determined as closure terms in the water balance. This is because direct measurement of seepage rates at the regional, or watershed, scale is problematic.
Typically, local seepage rates from ponds and canals in irrigated regions were measured directly (if at all) and, in some cases, deep percolation rates below irrigated lands were estimated from subsurface drainage flow rates (Grismer et al. 1988; Grismer and Tod 1991; Tod and Grismer 1991). Grismer and McCullough-Sanden (1988) and later Grismer and McCullough-Sanden (1989) determined seepage rates from subsurface drain-water collection ponds in the San Joaquin Valley using a combination of direct infiltrometer seepage measurements, lab-measured hydraulic conductivities of soil cores and water-balance calculations. They found that seepage rates from multiple infiltrometers set in the pond for several weeks were relatively small, approximately 0.04 to 0.4 inches (1 to 10 millimeters [mm]) per day, and that the seepage was log-normally distributed spatially in the clay loam soils comprising the base of most ponds. Somewhat surprisingly, the log-normal mean of the hydraulic conductivity of the matching soil cores taken from the infiltrometers was six to seven times smaller than the average seepage rates measured using the infiltrometers and determined from water-balance calculations. In Iraq, Mohsen and Mohammed (2016) also used direct infiltrometer measurements, finding canal seepage losses of roughly 1.3 feet (0.4 meters [m]) per day in lined distribution channels and 13.1 feet (4.0 m) per day in unlined channels.
Sonnichsen (1993) summarized historical results of canal seepage studies in the United States and created figure 1, which illustrates the log-normal and grain-size dependence of measured seepage rates from lined and unlined canals. Consistent with the infiltrometer results above, seepage rates in these studies ranged from about 0.09 feet (30 mm) per day for concrete-lined canals to about 1.9 feet (600 mm) per day for canals having sandy-gravel bottoms. In all these studies, however, seepage rates estimated from grain-size distributions had greater variabilities and so were of limited value in predicting actual seepage rates. Such results indicate the complexity of estimating seepage volumes to groundwater based on soil-textural information. Moreover, these studies determined seepage rates only in the top roughly one foot of bed materials. Though it was assumed that seepage eventually reached shallow groundwater within the next 10 to 300 feet (3 to 100 m) depths, it is possible that much seepage was distributed laterally, augmenting stream flows or appearing as downslope seeps.
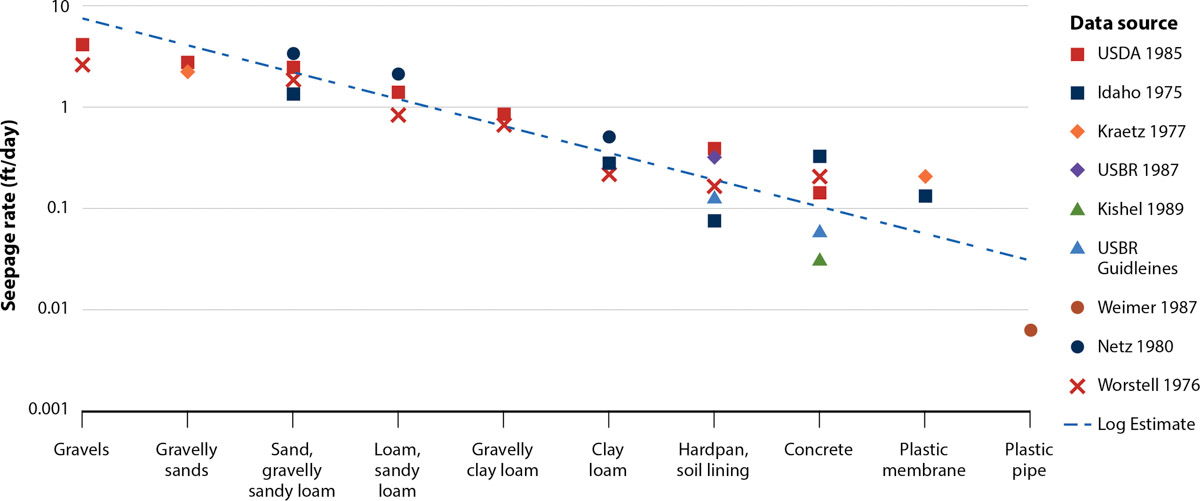
FIG. 1. Historically measured canal seepage rates from unlined canals and typical linings in the United States (from Sonnichsen 1993). Canal seepage rates decrease by orders of magnitude with decreasing grain size of bed materials, or replacement by liners.
Aside from the studies noted above, few contemporary direct measurements of seepage rates or volumes exist in the literature, and this remains a large gap in understanding the irrigated hydrological landscape as well as in developing hydrology management plans like those associated with SGMA in California.
Using a combination of field-measurement and water-balance calculations, we measured channel seepage in two locations in California: at the point scale for Lower Putah Creek (LPC) in Solano County and at reach scales in several delivery laterals of the Oakdale Irrigation District (OID) in Stanislaus and San Joaquin counties. We also examined the effects of channel water levels (flowrates) on measured seepage rates to gain insight into how manipulation of channel flows may change channel groundwater recharge rates. In both cases, quantifying possible groundwater recharge from the channels is important in SGMA related groundwater planning in both Solano and Stanislaus counties.

A water temperature sensor visible in the water, near an automated gate (background). Photo: AJ Borba.
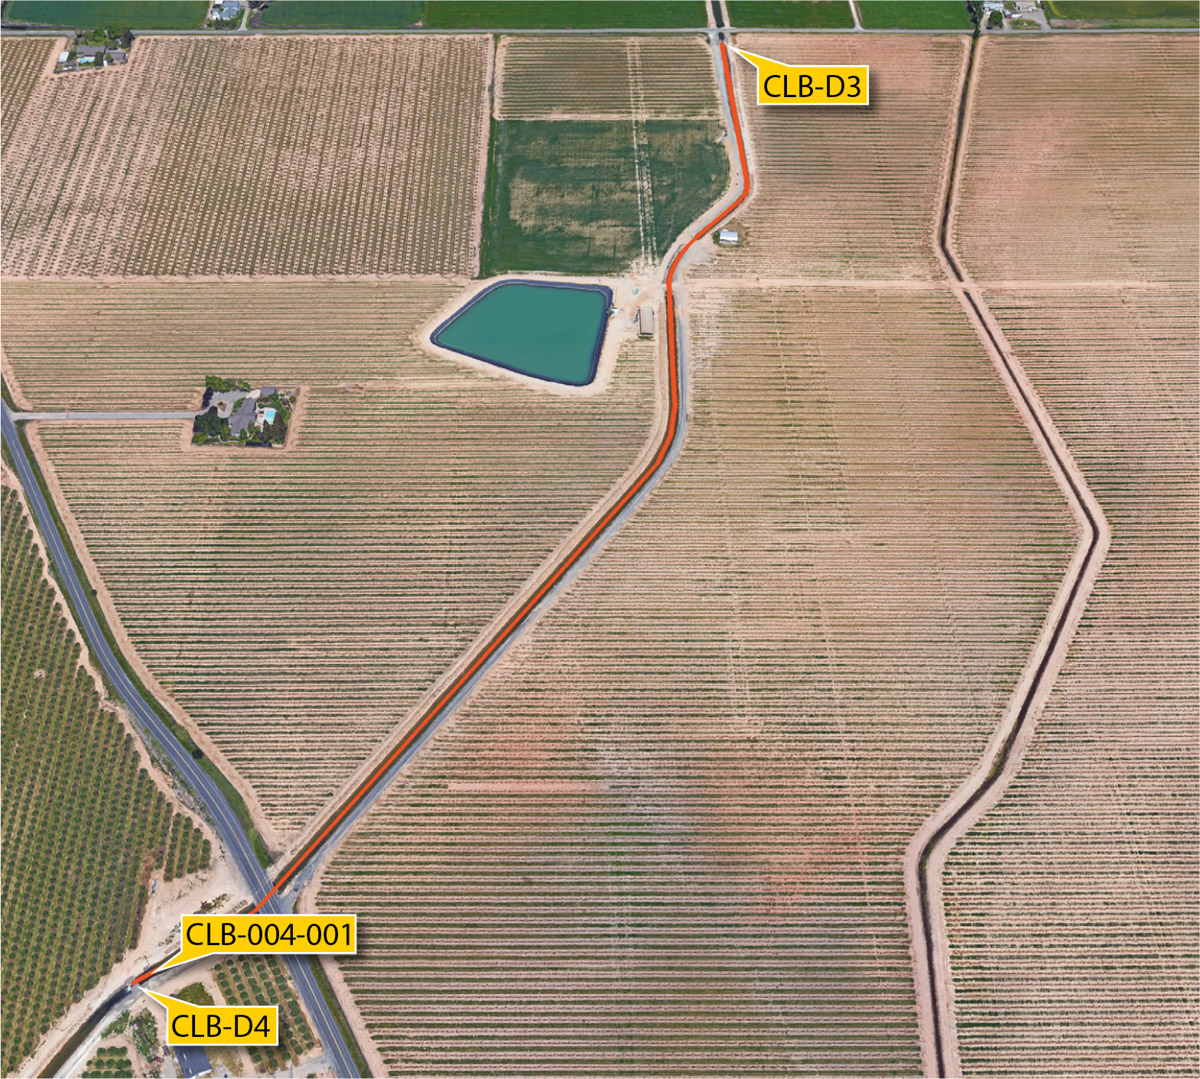
Aerial image of OID Claribel reach, with approximate location of automatic gates (CLB-D3, CLB-D4) and WL sensor (CLB-004-001). Photo: AJ Borba.
Site descriptions and methodology
Both project sites are in California's Central Valley, one (LPC) on the west side near the Sacramento-San Joaquin River delta, the other (OID) on the east side at the western edge of the Sierra Nevada foothills. At both sites, channel reaches — sections of the stream or river — pass through agricultural regions of moderate relief that have similar topography and similar elevations, from near sea level to roughly 300 feet (100 m) above sea level. The sites also share similar Mediterranean climates, including daily temperatures and evapotranspiration rates, though the LPC area receives slightly more average annual rainfall (approximately 24 inches [610 mm] per year compared to roughly 21 inches per year at Oakdale). Prevailing soil textures at both sites ranged from silty to sandy-gravel loam, though at the LPC infiltrometer sites we encountered relatively dense clay layers within the top several inches below the streambed, likely resulting from extensive gravel mining within the creek over the past several decades. Shallow groundwater levels or water tables in both regions during the summer months are 10 to 100 feet (3 to 30 m) below ground surface but rise during winter rainy periods and spring flooding to near-surface levels.
The LPC serves as the boundary between Yolo and Solano counties, while the OID straddles the Stanislaus River, which supplies the district canals within Stanislaus and San Joaquin counties. Solano County Water Agency (SCWA) controls summer flows into the roughly 12.4 miles (20 kilometers [km]) of the LPC that originate west of Winters at the Lake Solano Putah Diversion Dam and continue toward Davis to meet downstream user and contractual requirements as well as to sustain some riparian habitat. At perhaps a larger scale, the OID, one of the older water districts in the state, manages over 300 miles (500 km) of channels across a roughly 88,000-acre (35,300-hectare [ha]) service area surrounding the town of Oakdale. About 90% of the OID service area is located in Stanislaus County.
Lower Putah Creek
Due to limited access across private properties and the inability to restrict Putah Creek flows as required for reach-scale measurements, we used infiltrometers to obtain point seepage rates from several locations along the low-flow creek channel, from west of Winters to the Russell Ranch area west of Davis. We conducted streambed infiltration rate studies and associated computed hydraulic conductivity (K) measurements at four sites along the LPC; two were located roughly at 3 miles (5 km) upstream (west) of Winters, at Winters Putah Creek Park, and two were roughly 5 to 6 miles (8 to 10 km) east of Winters.
The four infiltrometers were constructed as described by Grismer and McCullough-Sanden (1988) from 5-foot (1.5-m) lengths of 6-inch (150-mm) diameter Schedule 40 (white) PVC pipe. We beveled the pipe edges of one end of each infiltrometer for ease of sediment penetration and outfitted each with an external clear nylon tube for direct measurement of water levels (WLs) within the pipe during infiltration tests (fig. 2). We carefully pushed the infiltrometers into the streambed sediment to an average depth of 0.5 feet ± 1.3 feet (0.17 m ± 0.4 m) at each location. Adjacent stream-water depths ranged from 0.25 to 1.5 feet (0.1 to 0.45 m) and water temperatures during the tests averaged 61°F (16°C) at the most westerly site and about 64°F (18°C) at all other sites further downstream. Air temperatures ranged from 70°F to 100°F (20°C to 38°C) during the infiltrometer tests, and evaporation from the infiltrometers was assumed negligible during the duration of each test (less than 60 minutes).

FIG. 2. Infiltrometer installed in a typical cobble/gravel Lower Putah Creek streambed under the shallow flow conditions found at most sites.
After we installed the infiltrometers, we filled them with creek water to about 3 feet (1 m) over the stream water level and allowed them to infiltrate for 15 to 30 minutes. We then refilled them, recorded the initial full-water level and then measured declining water levels within the columns every few minutes until water levels fell about 3 feet (1 m), or after about 60 minutes had elapsed. Replicated infiltrometer tests at five locations revealed that rates of water-level decline were nearly the same as those of the initial test. With water temperatures near 68°F (20°C), we made no temperature corrections on viscosity or density when computing the K values.
We analyzed the infiltrometer WL fall-rate data to determine K values, solving the Darcy equation for transient (falling-head permeameter) or quasi–steady state conditions. We assumed that the infiltrometer-enclosed sediment was part of a much longer column of saturated homogeneous soil. The transient-flow Darcy equation is formulated as a simple first-order rate equation that, when integrated over the time-period Δt = t1 – t0 when the infiltrometer WL falls from H0 to Ht, results in a natural-log solution for the hydraulic conductivity (Kv), designated here as
Kv = [L/(tt − t0)]In(H0/Ht)
where L is the sediment thickness, H0 is the initial WL in the infiltrometer at time zero, t0, and Ht is the infiltrometer WL at time tt. This transient solution suggests that there is an exponentially decreasing rate of WL decline within the infiltrometer during the measurements. The steady-state solution of the Darcy equation for Ks assumes that the total head, Ht, on the top of the sediment core of length, L, contained within the infiltrometer is given by the infiltrometer WL, while Hs, representing the lower-boundary condition total head, is the stream water level. These boundary conditions applied as long as the enclosed core remained saturated and as long as the local water table was located at least several times the core thickness, L, below the base of the infiltrometer. Computing the average flux, qavg, as the average rate of WL decline in the infiltrometer during the test, we determined the hydraulic conductivity as
Ks = qavg/[(Ht − Hs/L)]
Oak Irrigation District
The OID installed automated-gate (WL) control structures along several key distribution laterals within the OID canals in 2019. We took advantage of these structures to develop reach-scale water balances to determine reach seepage rates within three channel sections located north to south across the district. The automated structures were designed to maintain nearly constant upstream WLs during the irrigation season (May to October), so we were able to obtain direct, instantaneous measurements of flow rates and reach WLs in each section. The control gates adjusted flows depending on delivery requirements, from one-minute intervals to roughly 60-minute intervals. This enabled us to compute seepage rates for each time interval. We determined seepage rates, W (L/T; e.g., inches per day [in/day]), for each interval each day for each channel reach from a simple mass balance (with appropriate unit conversions) given by
W =[(Qin − Qout − Qdiv − Evap∗As)Δt − ΔWL∗As]/(Au∗Δt),
where
Qin = inflow rate to channel reach (L3/T; e.g., cubic feet per second [cfs]),
Qout = outflow rate from channel reach (L3/T, e.g., cfs),
Qdiv = diversion flow rate from channel reach (L3/T; e.g., cfs),
Evap = Rohwer (1931) equation or CIMIS evaporation rate (L/T; e.g., in/day)
As = reach surface area (L2; e.g., square feet [ft2]),
Au = water surface area of unlined reach section (L2; e.g., ft2),
ΔWL = change in reach water level during time Δt (L, e.g., inches), and
Δt = time interval between measurements of flowrates and WLs (T; e.g., minutes).
We assumed in this water-balance equation that the water-surface area, AU, was equal to the vertical projection of the channel soil-surface area as the channels had nearly rectangular cross-sections. That is, we effectively assumed that there was only vertical infiltration from the channel, or, lateral infiltration rates were insignificant. In the OID channel reaches that we studied, the channel side-slopes, while not vertical, were fairly steep, often greater than 45 degrees (1:1 horizontal to vertical), such that using the water-surface area AU underpredicts the actual soil surface area by more than 7%. We deployed thermocouples with dataloggers to collect water temperatures every 30 minutes at each end of two reaches in the one lateral canal (Cometa) on the north side of the district and one lateral canal (Claribel) on the south side to estimate reach evaporation rates in conjunction with weather data (collected at the centrally located CIMIS micro-meteorological station in Oakdale). We determined reach water-surface areas from as-built canal survey drawings, and we assumed that the areas remained constant, as WLs varied by less than 0.4 inches (10 mm) within time intervals Δt, and by no more than 2.4 inches (60 mm) overall from day-to-day. We calculated seepage rates for each time interval Δt, and, following the analysis outlined below, averaged the seepage rates associated with time intervals Δt of 10 minutes and greater to determine the daily seepage rate each day from June 1 to mid-October 2019.
Analyzing point seepage measurements at LPC
We outline the LPC infiltrometer test results first (table 1), and then consider the reach-scale seepage measurements at OID, before discussing how the results relate to possible groundwater recharge. The infiltrometer tests were relatively straightforward in the field, with the only practical issue being the presence at some locations of a shallow, hard clay layer within a few inches of the sediment surface, which made it difficult to drive the infiltrometers into the streambed. In nearly all tests, the infiltrometer WL (Ht) fell at a steady rate, as illustrated by the results from a set of three tests at the site furthest downstream (fig. 3). This steady rate of Ht decline in the infiltrometers as the test progressed was equivalent to a steady infiltration, or seepage rate, regardless of the declining gradient across the sediment core. This observation is inconsistent with the fundamental assumptions associated with the steady-state and transient solutions of the Darcy equation above.
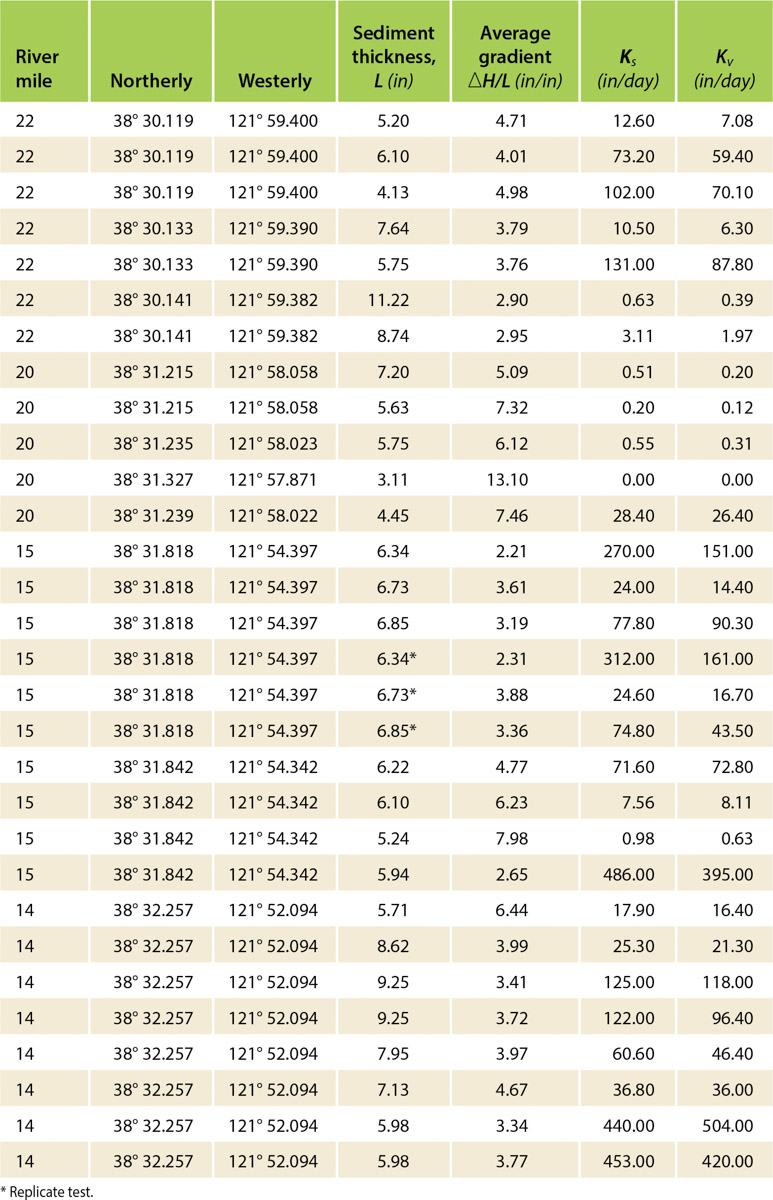
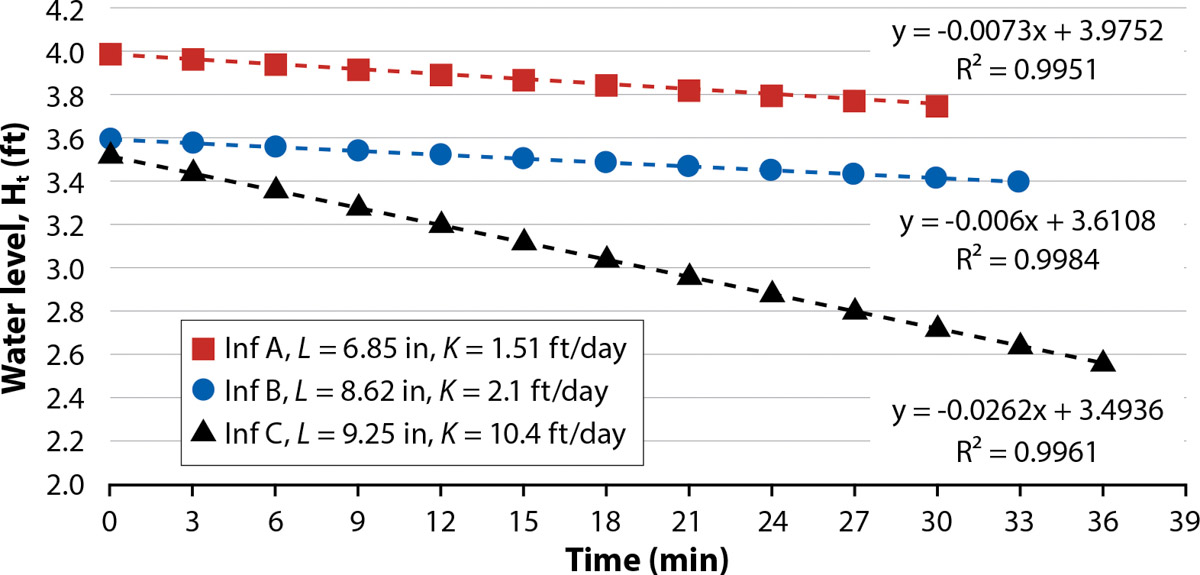
FIG. 3. Example infiltrometer test results from location RM 14 in Lower Putah Creek illustrating reproducibility of the method. Note the constant infiltration rate (line slope) with declining infiltrometer water level (Ht) in contrast to the log decay expected theoretically.
The steady infiltrometer WL decline suggests that small changes in hydraulic gradient had little effect on measured seepage rates and that the steady-state solution is likely a better fit to the measured data to determine K than the falling-head solution. Nonetheless, for comparison purposes, values of Ks as well as those for the falling-head test, Kv, are listed in table 1. Across all 30 tests, the arithmetic average K was a relatively small value of about 8 feet (2.5 m) per day, but values ranged across five orders of magnitude, from <0.001 to 36 feet (11 m) per day, with a log-normal mean of ∼2 feet (∼660 mm) per day. Landon et al. (2001) obtained similar seepage results for several sandy-bottom creeks in Nebraska with log-normal means on the order of 4 inches (100 mm) per day.
The test hydraulic gradients, ΔH/L, ranged from 3 to 7, with an average of 4.7, a value within the range of what might occur under regular summer flow conditions. Reflecting the log-normal distribution, about one-third of the tests yielded K values <0.3 feet (<0.10 m) per day, the next third between 0.3 and 3.2 feet (0.10 to 1.0 m) per day, and the remaining third between 3.2 and 36 feet (1.0 to 11 m) per day. Replicated tests (repeated immediately following the first trial) yielded K values similar to those of the initial value, with computed Ks values. Overall, Ks values averaged about 15% more than Kv values. Because the measured infiltrometer data were inconsistent with the required assumptions for calculation of Kv values, the following discussion focuses on the Ks values.
The variation in Ks values was largely dependent on location along the river, while variation found in test results at each site was less than the overall variation except for that at the Winters Park site (river mile [RM] 20) at the town of Winters. Streambed sediments captured within the infiltrometers at all sites were comprised of sands, silts, gravel and clay, and all sites had some cover of smooth cobble 1 to 3 inches (2 to 6 cm) in diameter (e.g., fig. 2), though there was much less surface gravel at the uppermost river site. The defining sediment feature with respect to the infiltrometer test results was the capture of dense clay at depths less than about 6 inches (152 mm) in several cases within the infiltrometer core. Table 2 summarizes the infiltrometer test-result averages for each of the LPC sites. While mean K values were greater at the two downstream sites (RMs 15 and 14) than those at RM 22, they did not differ at a significant level (>95%). Mean gradients and sediment thicknesses at these three sites also did not differ significantly (>95%). However, at the Winters Park site (RM 20), the average gradient and mean K value were significantly greater and smaller, respectively. These significant differences at the Winters Park site were directly associated with the dense, sticky clay found immediately below the riverbed sand/gravel mix.

Relative to values measured at other, similar streams across the country, the average K within the range 3 to 10 feet (1 to 3 m) per day is relatively small, but not unreasonable. At the Winters Park and other river sites subject to historical in-channel mining, from the town of Winters upstream, the shallow, dense clay layer severely reduces channel permeability, suggesting that at these locations there may be very limited channel seepage. Such limited seepage upstream of Winters may have frustrated groundwater recharge efforts associated with increased streamflows during the recent drought period that failed to support riparian trees (Grismer 2018). However, we determined streambed material permeability only to the top 4 to 9 inches (10 to 20 cm) of sediment. Additional clay layers may be present at greater depths along the river that limit seepage to shallow groundwater tables during the summer when local water tables fall far below the channel low-flow water level. Reach-scale measurements of seepage are likely required to further evaluate the streamflow-groundwater interactions along the LPC riparian area.
Analyzing reach seepage measurements at OID
While reach-scale seepage measurements were not immediately possible at LPC, we were able to complete three reach-scale measurements of channel seepage in similar-size channels in the OID. We conducted this work along two key water distribution laterals south (Claribel) and north (Cometa) of the town of Oakdale. Both distribution laterals are operated with downstream WL control using the automated gates mentioned earlier in place of the traditional manually adjusted weir board drop structures. The automated gates have WL sensors and gate position encoders that enable continuous flow measurement, real-time monitoring, automated control and data acquisition through a telemetry system. The reaches we selected within these automated distribution laterals were roughly 3,300 to 6,500 feet (1 to 2 km) long and 2.5 to 5 acres (1 to 2 ha) in surface area. The Claribel and Cometa D3-4 canal reaches had one diversion, or turnout, within the reach, and there were no diversions within the Cometa D1-2 reach. Flowrates across the reaches ranged from 20 to 150 cfs (0.6 to 4.3 cubic meters per second [m3/s]) during the four-month monitoring period. Table 3 summarizes the reach locations and characteristics. We made roughly 100 seepage determinations from reach water balances every day at time intervals of 10 to nearly 70 minutes between changes in gate flows and slight changes in reach WLs. We anticipated that the estimated seepage rates from the more frequent (>1,000) and smaller time-interval water-balance calculations each day would be more variable than those from longer periods, and we assumed that reach evaporation would have minimal effect on computed seepage rates. We tested both concepts first using the daily data from Claribel, the smallest of the reaches considered here.

We calculated hourly evaporation rates for the water-balance determinations of seepage rates using both the Rohwer equation and from the unadjusted reference evapotranspiration (ETo) measured at the Oakdale CIMIS station. The Rohwer equation for water-surface evaporation includes wind speed, humidity and the water-vapor pressure difference between that of the directly measured reach water temperature and that measured in the air (CIMIS station). We found that daily calculated water evaporation in the Claribel reach was much smaller than daily CIMIS values and that peak calculated evaporation rates during June and July surprisingly occurred in the early morning hours as compared to peak ETo rates, which occurred at midday (fig. 4). Ultimately, while we included evaporation losses in our calculations, net evaporation volumes during the sampling time intervals of 10 to 60 minutes had negligible effect on the estimated seepage rates for the Claribel reach.
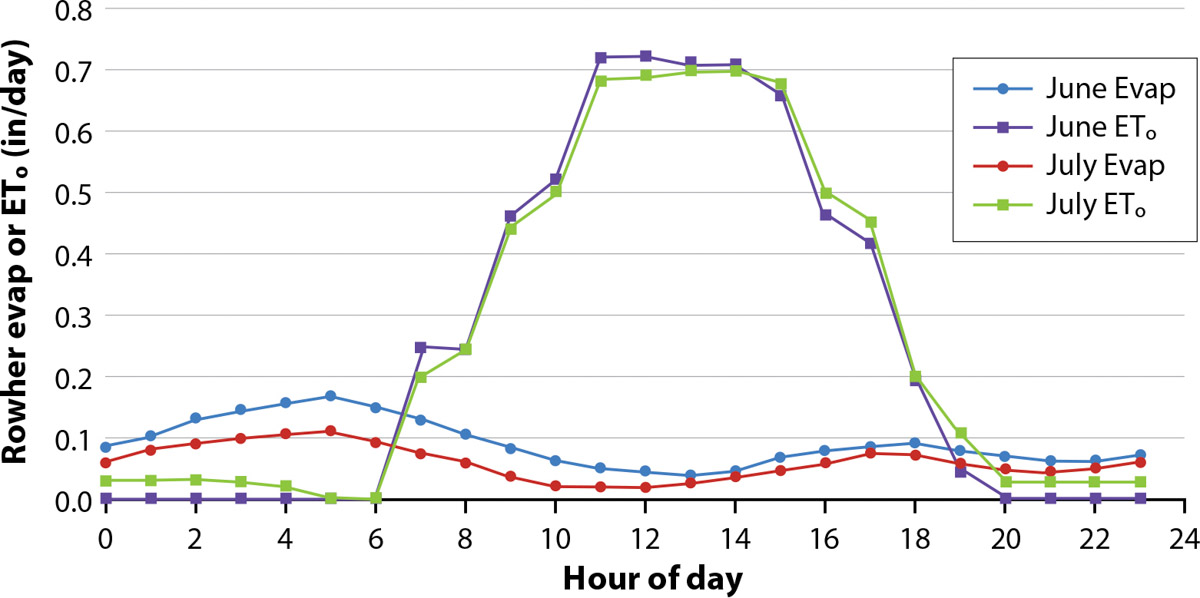
FIG. 4. Estimated hourly average evaporation rates during June and July 2019 for the Claribel canal reach illustrating substantial differences between ETo and Rohwer equation approaches to calculation.
We anticipated decreasing variability in estimated seepage rates as sampling intervals (Δt) increased, and we were uncertain as to how this would affect mean seepage estimates. Based on all the data from the Claribel channel reach, we found that evaporation losses had negligible effects on mean seepage rates for each time interval. There was no change in seepage estimates when using the Rohwer evaporation rates, and there was an occasional reduction in seepage rates by ∼1% using the CIMIS ETo values, though we questioned their applicability given the observations shown in figure 4.
The effects of sampling interval, Δt, on mean seepage rates and their variability in the Claribel canal reach are shown in figure 5; there was a slight but nonsignificant decreasing trend in the mean seepage rates, but variability clearly decreased with increasing Δt. For sampling intervals greater than about 10 minutes, there was little significant decrease in variability and mean seepage rates; therefore, in all further analyses, we focused on determining daily seepage rates for sampling intervals greater than 10 minutes. We found similar trends between sampling interval and seepage variation for the other two OID reaches considered. Time intervals of 10 to 20 minutes also corresponded roughly with the average travel time required for water to flow across the length of the reach during the June-to-October period.
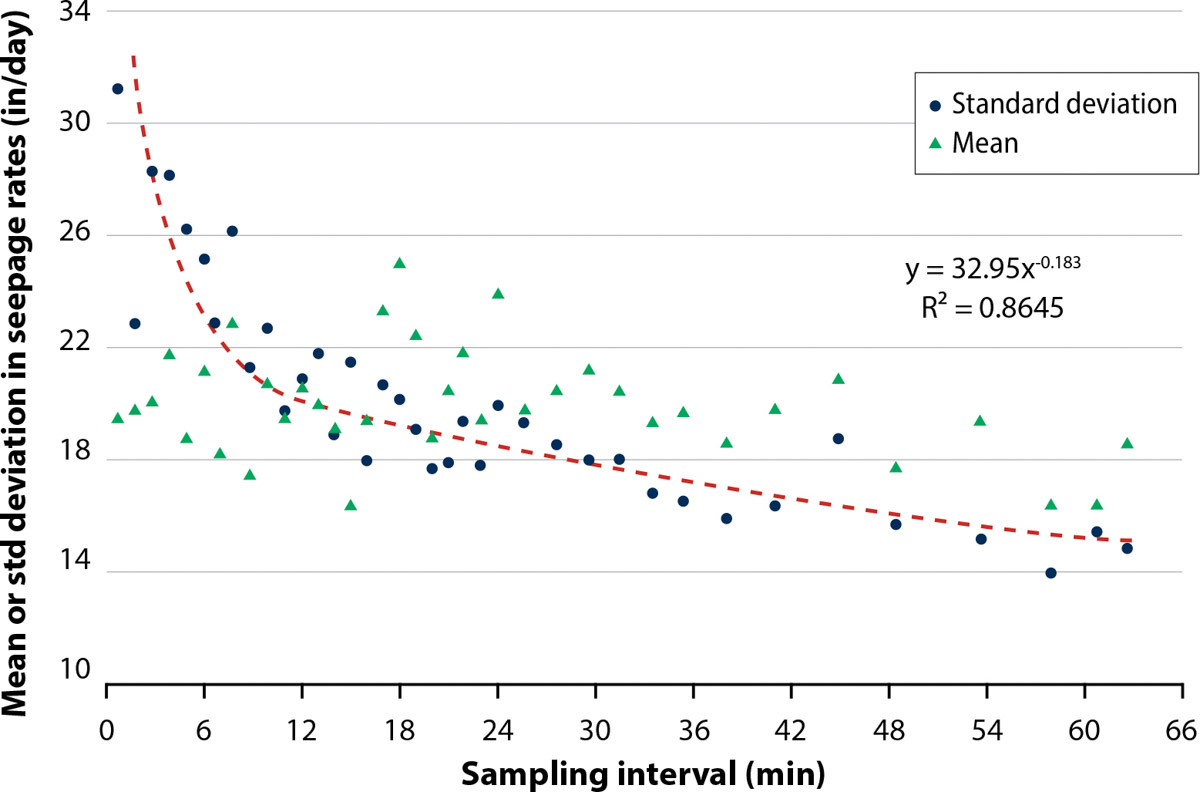
FIG. 5. Mean seepage rates and their variability during summer 2019 for the Claribel canal reach depend on water-balance sampling interval time. Higher deviations and slightly decreasing infiltration rates with increased sampling time suggest that a sampling interval of >20 min is appropriate for this reach.
Mean daily seepage rates from the Claribel reach varied more-or-less randomly during the four-month measurement period, and we found similar decreasing trends at the Cometa reaches, particularly after mid-September (day 100) (fig. 6). Decreasing seepage rates were associated with decreasing average daily flowrates and reach WLs later in the season. For example, at Cometa D1-2, the mean seepage rate during the first 100 days after June 1, of 0.71 inches (18 mm) per hour, fell to 0.23 inches (5.9 mm) per hour for the last 42 days of record. This decrease was associated with declining water depth and associated declining average daily flow rates, which fell from 116 cfs (3.28 m3/s) to 63 cfs (1.78 m3/s) after 100 days. Table 4 summarizes the mean and standard deviations of the daily mean sampling intervals, counts and seepage rates from each canal reach. The overall daily means at all three reaches differed significantly at the 99% confidence level.

FIG. 6. Mean daily seepage rates at all three Oakdale Irrigation District (OID) sites show progressively decreasing values during summer 2019, especially during the early fall period when canal flowrates (water levels) decrease.

Average seepage rates across all three OID channel sections during the 100-day period encompassing June through mid-September were 2 feet (605 m) per day, or about 1% less than the log-normal mean seepage rate from LPC, which was 2.16 feet (660 mm) per day. The Cometa and Claribel laterals are just a small part of the roughly 200-mile (322-km) lateral canal system below the main canals within OID. However, a total of 28 miles (45 km) of these smaller lateral canals now have automated downstream WL control systems. We assume that standard operations with the traditional weir board drop structures provide less head and opportunity time for groundwater recharge because the reaches are only checked when water deliveries are occurring in the reach immediately upstream.
OID is undertaking a phasing-in expansion of automated gate controls on other distribution laterals but does not anticipate implementation of such controls on smaller canals. Currently, there is a combined total unlined surface area of approximately 52 acres (25 ha) in automated control reaches across the district. Assuming that the average Cometa and Claribel reach seepage rate (2 feet [605 mm] per day) is representative of all other gate-controlled lateral canals, the possible groundwater recharge from the system is equivalent to about 123 acres per foot per day (15 hectare-meter [ha-m] per day). Thus, the combined seepage volume for the 100-day summer period accounts for more than one-third of the estimated annual seepage from OID's distribution system (over 12,000 acres per foot) and is likely a valuable component of the regional groundwater balance, particularly in the northern part of the district nearest to the over-drafted Eastern San Joaquin Groundwater Subbasin. With more detailed assessment of the LPC channel geometry and geology, the point-measured seepage rates could be similarly used to determine groundwater recharge volumes to the Solano and Yolo groundwater basins during the summer low-flow period.
Summary and conclusions
Quantification of seepage from channels subject to controlled flows from upstream reservoirs is an important but challenging aspect of water-resources planning across the irrigated agricultural landscapes common in California. By measuring deep percolation or groundwater recharge rates/volumes from such channels and determining their dependence on the managed flowrates, water resources planners will be better able to allocate limited water supplies to downstream needs, including riparian forests, irrigation and the augmentation of groundwater storage. Lacking direct measurements of channel seepage rates, planners and watershed modelers rely on soil-texture–implied seepage rates or those determined from closures of regional water balances. The in-channel infiltrometer point measurements we made along the LPC revealed the large spatial variability in likely seepage rates as estimated from K values and suggest that such measurements are too fine-scale to determine channel reach–seepage volumes. However, results from those measurements provided insight into that variability and suggested that typical stream WL changes have very limited effects on locally measured seepage rates. At the reach scale, the water-balance estimates of seepage rates and their changes during the summer at OID yielded direct assessment of likely groundwater recharge volumes important in water-resources planning associated with SGMA requirements in the region. Co-incidentally, overall average seepage rates at both sites were similar — about 2 feet (610 mm) per day — across a range of soil textures.
Point- and reach-scale measurements are important for determining accurate seepage rates in controlled flow channels

