


All Issues
Soil type, crop and irrigation technique affect nitrogen leaching to groundwater
Publication Information
California Agriculture 67(4):231-241. https://doi.org/10.3733/ca.E.v067n04p231
Published online October 01, 2013
NALT Keywords
Abstract
Many groundwater resource in California are degraded by high concentrations of nitrate, most of which was transported to the groundwater in water percolating below the root zone of agricultural fields. Factors that affect the rate of water percolation — including soil type, crop and irrigation — along with nitrogen application influence the probability of this type of groundwater degradation. UC scientists have developed several useful tools, including the Nitrogen Hazard Index (NHI) and the ENVIRO-GRO (E-G) model, for use in developing best management practices (BMPs) to achieve high crop yields while minimizing groundwater degradation. We report the results of E-G simulations that quantify the effects of irrigation, soil type and organic and inorganic nitrogen (N) application amounts to corn yield and the amount of leached N. Simulation results indicate that a nitrate management strategy that also includes water management will be more effective in reducing N loading to groundwater. The research findings are discussed in the context of the track and report concept in comparison to the BMP approach.
Full text
The downward percolation of nitrate-laden water from agricultural fields is a major contributor to the high levels of the contaminant found in many California groundwater resources (Viers et al. 2012). Many assume that this condition results from the excessive application of nitrogen (N) fertilizer to crops.
The word “excessive” can have any of several connotations, and because the term usually is not clearly defined in this context it can be taken by any number of people to mean any number of things. Excessive application could mean that more N is applied to the soil than can be removed by the crop, and there is no question that most agricultural applications could be included in this definition. Another definition would say that excessive application means that more fertilizer is applied than would be required to achieve high yields and maximum profits.

The ENVIRO-GRO model simulates the consequences of irrigation water salinity and management practices on crop yield and nitrate leaching. Simulations indicate that strategies to minimize groundwater degradation must also include water management practices to be effective.
High yields and maximum profits almost always require the application of more N to the soil than is removed by the crop. Whether growers have historically applied more N than was necessary to obtain maximum profits is not clear and probably cannot be determined.
Other management factors (e.g., irrigation) have a great impact on the relationships between the amount of fertilizer applied, the crop yield, and the deep percolation of nitrate. Strategies that are intended to reduce nitrate degradation of groundwater but that ignore complex dynamic relationships with other management factors are likely to fail.
Nitrate reaches groundwater only by being transported by water that percolates through the soil, a factor often disregarded when assessing the relationship between fertilizer application and nitrate degradation of groundwater. Every crop requires sufficient water to meet its evapotranspiration (ET) needs, and any irrigation or precipitation that exceeds the soil's water-holding capacity in the root zone will cause soluble chemicals, including nitrate, to leach into deeper groundwater. The amount of N that is leached varies with time and with the amount of water flow and the N concentration in the soil water at the time leaching occurs.
The rate of N uptake by a crop varies with its growth stage and, in cases of N deficiency, may also depend on the N concentration in the soil water. Total plant dry matter production usually has a linear relationship to ET. Therefore, if plant growth is reduced because there is too little water, too much salinity, or too little N, the plants will have less dry matter production and less ET, which means that any given irrigation regime will result in more leaching (Pang and Letey 1999).
Both positive and negative feedback loops between plant growth and soil condition can be observed, depending on circumstances. For example, if salinity in the soil reduces plant growth, the reduction in plant growth will reduce ET, resulting in greater leaching of salts, which will to some degree remedy the salinity problem. This is a positive feedback mechanism. However, if both plant growth and ET are reduced by a lack of adequate N or by other factors, leaching of nitrate will increase, further reducing the nitrate content of the root zone, thereby intensifying the problem. One consequence of this negative feedback mechanism is that any attempt to decrease nitrate leaching by reducing N applications may be counterproductive if the reduced N input further reduces plant growth, which would in turn increase N leaching. Groundwater degradation by nitrate is related both to time-dependent fertilizer and to water management.
N results from grower field studies
Based on extensive field research during the 1970s, it is fair to say that the optimal (i.e., profit-maximizing) amount for N application is dictated by the amount of precipitation and irrigation. That research focused on a total of 55 fields drained by tile systems and 31 naturally drained fields that did not have a shallow water table (Letey et al. 1977, 1979). By looking at the rate at which water discharged into the tile systems and the nitrate concentration of water samples collected in the tile systems, researchers were able to calculate how much nitrate in total was discharged into the tile systems. For the natural drainage studies, researchers drilled into the soil and analyzed samples from various depths, usually reaching to a depth of 50 feet. Procedures were then developed to calculate the rate of water flow through the soil profile. This water flow rate, multiplied by the nitrate concentration, provided an estimate of the nitrate leached below the root zone. Researchers obtained information on fertilizer application from the growers.
Results were similar for both systems: the correlation coefficient between the amount of N leached and the drainage volume was greater than the coefficient for the amount of N applied. This suggests that irrigation management is at least equal in importance to, and possibly of greater importance than, fertilizer application in affecting the leaching of nitrate. As expected, the highest correlation coefficient was between the amount of nitrate leached and a combination of drainage volume and fertilizer application, indicating that both factors are important.
Importantly, there was no significant correlation between the nitrate concentration of the drainage water and either the amount of fertilizer applied or the drainage volume. The linear regression analysis for all the tile systems resulted in the equation

where C is the average nitrate-nitrogen concentration (mg/L) and N is the amount of fertilizer N applied (kg/ha) (Letey et al. 1977). Usually only the concentration is measured and there is no measurement of the water flow, making it impossible to calculate the discharge load. By itself, the numerical value of the concentration is of little value, and it may even lead one to make erroneous conclusions.
Growers are very observant when it comes to crop behavior. They may not know the amount of drainage volume from a given field, but they will know the crop yield. Our researchers hypothesized that growers would be likely to apply more N to fields that were N-deficient because the fields had a high drainage volume. Indeed, the experimental data supported this hypothesis. A linear regression analysis for naturally drained fields resulted in the equation

where N is the fertilizer applied (kg/ha/yr) and W is the amount of drainage water (cm/yr). The tile drain systems yielded

Greater drainage flows, therefore, induced growers to increase their N applications.
From the past to the future
If we simply assume that the large quantities of nitrate that migrated to groundwater decades ago were the exclusive result of excessive N applications, we may not be correct. The cause is just as likely to be related to irrigation management as to fertilizer management. Irrigation at the time in question was almost entirely applied as gravity flow rather than through pressurized irrigation systems. With gravity flow, the irrigator has little control over how much water infiltrates the soil, because the infiltration opportunity time (the amount of time when water is flowing over the soil) within the furrow and the hydraulic properties of the soil can vary so much. Pressurized irrigation systems allow more precise control over the amount and uniformity of water application and partially negate the effects of some soil properties, such as infiltration rate.
Another reason growers might purposely apply excess water is that they might be concerned that they could salinate the soil. Historical accounts of growers salinating soils in irrigated, semi-arid regions of the world are well known. Growers were educated about the need to leach salts from the root zone, and they considered this when setting up their irrigation practices. The leaching of destructive salts, though, also leaches out beneficial nitrate. Less efficient irrigation systems and the perceived need to leach salts contributed to high leaching of N and the resultant requirement for additional N application.
One reason to conclude that growers apply more N than is required for high crop yield is the common belief that growers typically apply more N than is recommended by universities and other research organizations. However, because those recommendations are commonly based on research done on small plots with carefully controlled irrigation, they may not apply so readily to the real-world conditions in many growers' fields. According to the results reported above, growers do tend to apply more N on a field that has a higher drainage volume. This supports the conclusion that growers do base their N applications at least partly on their field observations on yield.
Many growers and researchers may not have considered that converting gravity flow systems to pressurized systems provides an opportunity to reduce deep percolation and even reduce the amount of fertilizer applied without reducing crop yield. Field observation can show where too little N has been applied, but for most crops you cannot visually detect signs of excess application.
The availability of soluble commercial N fertilizer has been cited as a cause for the high levels of nitrate that have historically reached groundwater. Some maintain that organic forms of N have less potential to migrate below the root zone than inorganic forms. As will be demonstrated later, this is not always the case, and if the cause of a problem is mis-diagnosed, the prescribed cure may not be effective.
If we were to assume, for instance, that the huge, long-term buildup of nitrate in groundwater is a result of a history of excessive N applications rather than a history of excessive water applications, we would be inclined to take poor, and possibly counterproductive, actions in an attempt to improve the situation. Regulations that attempt to reduce groundwater degradation by focusing strictly on the amount of N applied, without consideration for the interactions between the amounts and timing of both fertilizer and water applications, most likely will not achieve their desired goal. Furthermore, each individual crop, soil and irrigation technology comes with its own challenges and opportunities that must be assessed.
The Nitrogen Hazard Index (NHI) was developed by UC scientists and is available online at http://ciwr.ucanr.edu/Tools/Nitrogen_Hazard_Index/ . A farm manager who uses this online tool to input his or her crop, soil and irrigation technology will receive a report that estimates the probability that nitrate will degrade groundwater in the field. The report also ranks the relative significance of effects from the crop, the soil and the irrigation system in terms of their contribution to the overall hazard, so the grower can focus management efforts toward those factors that are doing the most harm. The website also presents guidelines for management practices that minimize degradation according to the specific crop, soil and irrigation technology.
The California State Water Resources Control Board (SWRCB) recently submitted a report to the California Legislature with recommendations that address nitrate problems in groundwater (SWRCB 2013). The report emphasized the quantity of nitrogen applied but gave little recognition to the influence of irrigation management. The report specified high-risk areas for nitrate problems, but identified those areas only on the basis of hydrogeological conditions.
Regulations that focus only on the amount of N applied without considering the interactions between the amounts and timing of fertilizer and water applications may not be successful.
The report's authors cite a map that identifies areas at high risk for groundwater contamination with MTBE (methyl tertiary-butyl ether, a now-banned gasoline additive), which reached groundwater through leakage from underground storage tanks, and go on to assume that areas vulnerable to MTBE are also vulnerable to nitrate. This assumption, however, ignores all of the dynamic interactions that occur in the root zone and control the movement of nitrate below the root zone. Only after the nitrate has migrated below the root zone can its movement be affected by the hydrogeological features that affect the movement of MTBE. If only a small amount of nitrate migrates below the root zone, the risk that significant quantities of nitrate will move through the groundwater is small. The real probability of risk is related to the crop, soil and irrigation system as assessed using the NHI, and that is the proper means for determining likely problem areas.
Farm-level management is the most effective mechanism for reducing the continued degradation of groundwater from nitrate. A more useful report to the Legislature would have focused on best management practices (BMPs) and would have provided a plan by which they would be implemented on the farm. Management factors that influence both the yield of a specific crop and N leaching include irrigation events and the amount and timing of organic or inorganic N applications. There are other significant factors, such as soil hydraulic properties and rainfall, but those cannot be specifically managed.
Objectives
A major objective of this paper is to present scientific factors concerning the dynamic interactions between soil, crop and irrigation on crop yield and the leaching of nitrate.
ENVIRO-GRO (E-G), a model developed by UC scientists, simulates the consequences of various management factors on crop yield and nitrate movement below the root zone. In this paper, we use E-G to illustrate the effects of organic and inorganic N application amounts, rainfall amounts and irrigation amounts on crop yield and nitrate leaching on two soil types. The effects of soil temperature on the dynamic rate of organic matter mineralization and the implications of this on potential N leaching represent new findings. We discuss these findings as they relate to the NHI and BMP concepts as well as to the proposed track and report system.
The model
The E-G model (Pang and Letey 1998) was developed to simulate (1) water, salt and nitrate movement through soil with a growing plant; (2) plant response to stresses associated with matric water potential, salinity and N deficiency; (3) water, salt and nitrate leaching below the root zone; (4) cumulative relative transpiration and N uptake and (5) consequent crop yields as compared with those of an unstressed crop. The E-G model does not account for denitrification or N immobilization. The model allows us to simulate the consequences of irrigation water salinity and management practices on crop yield and nitrate leaching.
The E-G model has recently been re-programmed to make it more efficient. Modifications include the addition of compensation for N uptake, a two-pool model for organic matter decay, mass balance calculations, comprehensive output routines and improvements to the transport calculations for salt and nitrate. The E-G program and user manual are available online for free at http://ciwr.ucanr.edu/Tools/ENVIRO-GRO . Running the model does require an understanding of using such models and is not useful for the general practitioner.
When you use the tool, you first input certain information: the potential ET as a function of time, the amount and timing of water addition (irrigation or precipitation), the potential N uptake of the crop as a function of time, the amount and timing of N applications, and soil and plant characteristics. The time and amount of application is sufficient for soluble inorganic N, but not for organic forms of N, since they are not immediately available for plant uptake. For organic N, the model also requires its rate of mineralization into inorganic N. One purpose of this paper is to evaluate factors, including soil temperature, that affect the dynamic rate of organic N mineralization.
Organic material mineralization
Pratt et al. (1973) proposed that one could characterize the mineralization of organic materials applied to soil in terms of a decay series, a sequence of numbers representing the fraction of the current organic N amount that can be expected to mineralize in successive years. For example, the decay series [0.40, 0.20, 0.10, 0.05] would indicate that 40% of the organic N would mineralize the first year, 20% of the remaining organic N would mineralize the second year, and so forth. The decay series is an important practical tool for estimating multiyear N mineralization for manure, compost or other organic N materials (Cusick et al. 2006).
Applications of organic N material should be timed to provide mineralized N when it will be needed by the crop, a condition that is hard to evaluate using decay series. A better choice in this case is a continuous decay function that predicts the production of plant-available nitrogen (PAN). It is this function that is required for models such as E-G that have variable time-stepping with intervals that are usually shorter than one day. The upgraded E-G model includes a two-pool decay model that is represented as

The initial organic N applied is N0 (kg/ha), which is divided into a fraction ?N0 that is assigned to a slow-decay pool and a remaining fraction (1 − ?)N0 that is assigned to a fast pool (P. Vaughan, unpublished manuscript). The decay coefficients are ?1 and ?s for the fast and slow pools, respectively. Numerical values for these coefficients and fraction can be obtained using the decay series.
The relationship between the decay series and equation 1 can be viewed as data points of the decay series and a continuous function that can be fitted to these points. Yearly remaining organic N (Nr) can be calculated from the decay series if one assumes an initial applied amount. The resulting sequence of Nr values can be extended to 10 years under the assumption that decay rates after the final year of the explicit decay series are determined exclusively by the slow pool. The presumed decay coefficient of the slow pool is 0.0101, representing the decay rate of 1% per year that is commonly accepted for soil organic matter (Meisinger et al. 2008). By taking the curve that passes through the Nr values for exclusively slow-pool decay and extrapolating it backward to the application time, one can obtain the value of ?. The remaining unknown, ?1, can be determined by curve-fitting equation 1 to all Nr values using a nonlinear least-squares algorithm.
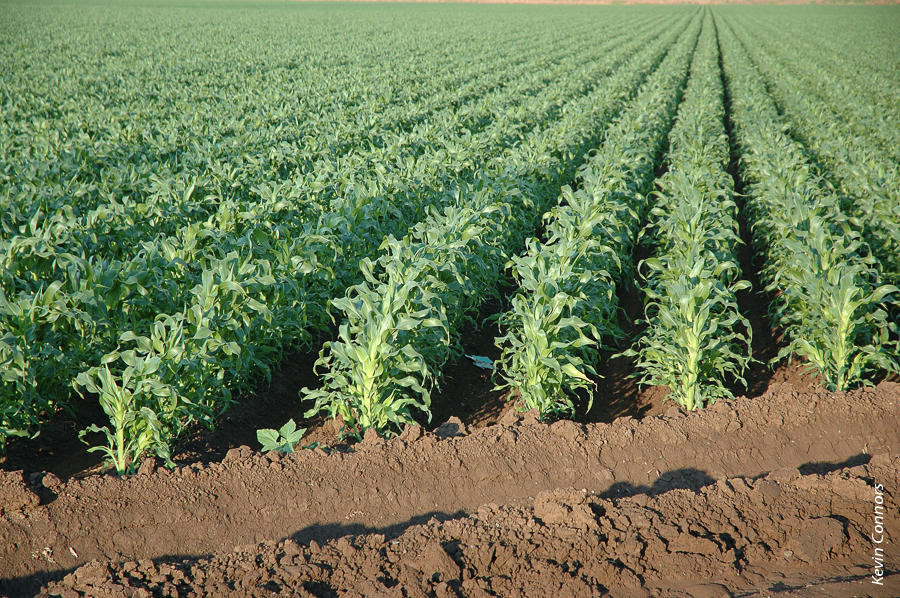
Although mineralization is known to be a temperature-dependent reaction, the effects of temperature variations have not generally been considered in the estimation of mineralization rates. For our work, we averaged the California Irrigation Management Information System (CIMIS) soil temperature data for 2000 through 2011 at Madera, California (site #145), to obtain daily values and then fitted these data to a sine function (fig. 1). Note that there is a great difference in soil temperature between winter and summer. One would expect this temperature difference to impact the temporal rate of mineralization. Vigil and Kissel (1995) proposed an exponential function to describe mineralization rate in the temperature range of 5°C to 30°C:

where TF is the temperature factor and Ts (°C) is soil temperature. These factors were input data for calculating temperature-dependent decay rates in E-G.
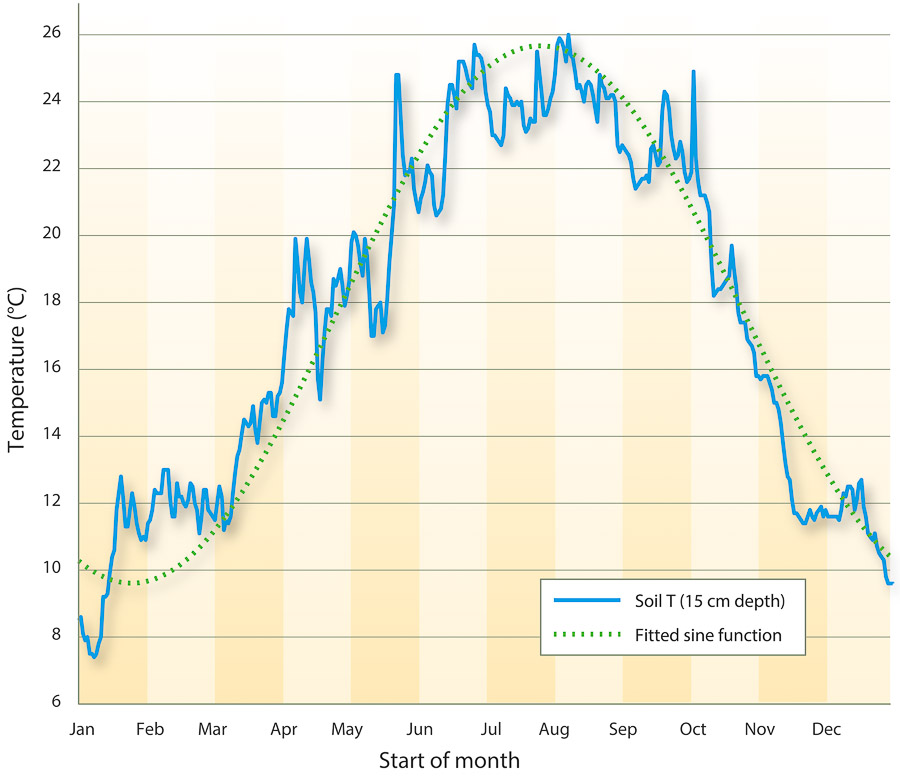
Fig. 1. Daily average CIMIS soil temperature at the 15 cm depth from 2000 through 2011 at Madera, site #145.
Crop and organic material demonstration
Corn (Zea mays) was selected as the crop for demonstration because a comparison had already been made between simulated (E-G) results and actual, observed experimental cornfield results. Pang and Letey (1998) compared the simulated results from E-G with field data reported by Broadbent and Carlton (1979) that included three water application treatments and four nitrogen application amounts. The mean relative yield for all observed treatments was 0.69, and 0.64 for simulated treatments. The mean N uptake was 158 kg/ha (observed) and 159 kg/ha (simulated). The poorest agreement between observed and simulated results involved extreme irrigation treatments that would not ordinarily be applied on a working farm. The E-G simulations were also compared to a cornfield experiment in Israel that included four irrigation water salinities and four irrigation intervals, though no N data were available (Feng et al. 2003). The mean relative yields were 0.68 (observed) and 0.70 (simulated). Overall, the model has been shown to produce values that are comparable to real-world values for corn crops.
The required model input information for a cornfield is also available from a study in the San Joaquin Valley. The total N uptake was measured as a function of time for 3 years (Feng et al. 2005). Based on these data, the potential N uptake rate as a function of time was computed as 300 kg/ha total.
Ninety percent of the organic material selected for illustration mineralized in 1 year and the other 10%, in the slow pool, mineralized at a rate of 1% per year. This approximates the results that Pratt et al. (1973) reported for chicken manure, with a decay series of 0.90, 0.10, 0.05. An organic N fertilizer that is known to mineralize almost entirely in 1 year was chosen in order to avoid large carryovers of unmineralized N in successive years that would continue to accumulate and require complex multiyear simulations.
The cumulative N uptake by corn and the cumulative amount of mineralized N from an application of manure that contained 370 kg/ha of N were computed as a function of time for manure applications on Jan. 1, April 1, May 15 or Oct. 1. Only the October and April applications are represented in figure 2. The mineralization amounts illustrated are adjusted for temperature-dependent effects (TD) or presented with the assumption of constant temperature (CT). Note that an Oct. 1 application allows enough N to be mineralized before the crop period to satisfy its N requirement. However, whatever mineralized N exceeds the crop uptake is subject to leaching during that time period. Application on April 1 does not allow time for mineralization of enough N to meet crop requirements during the first year, but it may do so in following years if the N is not leached. Note that the temperature adjustment alters the time sequence for mineralization.
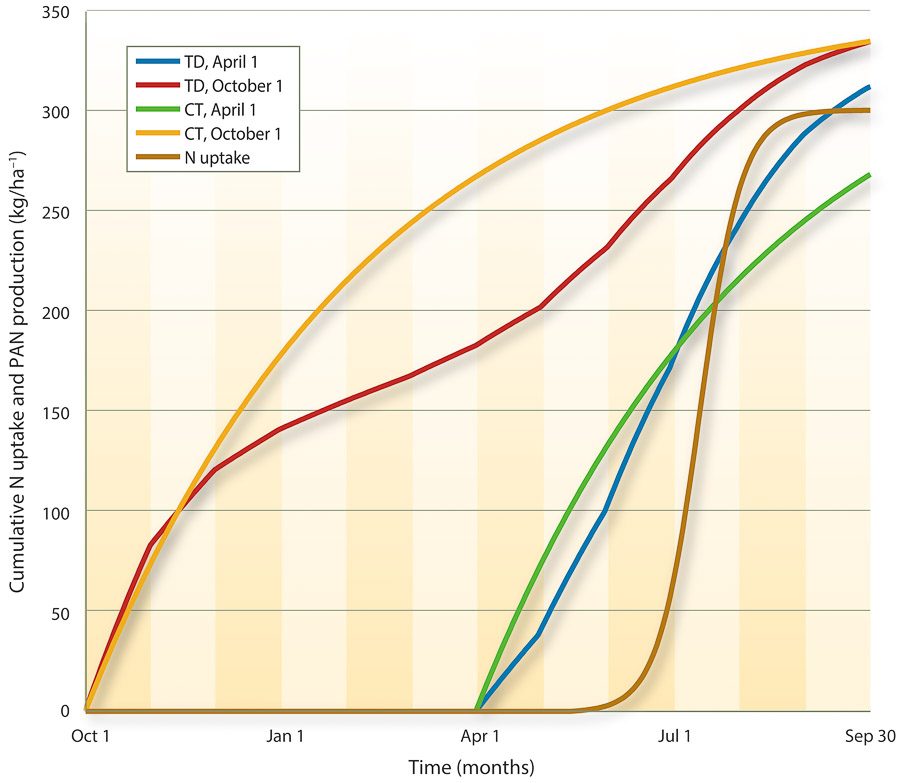
Fig. 2. Cumulative crop N uptake and the cumulative amount of plant-available nitrogen (PAN) production for organic material applied on April 1 or Oct. 1. The temperature is assumed constant (CT) for one set of data, and for the second set mineralization is adjusted for temperature dependence (TD) at different times of the year.
Variables for simulations
The organic material data had two application dates and variables for adjustment for temperature (TD) or no such adjustment (CT). Inorganic N was applied one time, between the preplant irrigation and planting. A clay loam soil and a sandy loam soil that differ in hydraulic properties and water-holding capacity were selected. Two ratios of uniform irrigation amount (AW) to potential ET (PET) equal to 1.1 and 1.42 were applied. These would cause expected leaching fractions for a nonstressed crop of 9% and 30%, respectively.
The first annual results are highly dependent on the initial soil conditions at the beginning of the simulation and may not accurately reflect the long-term effects of the treatment. For example, Broadbent and Carlton (1979) found that for the first year, crop N uptake on the plot that received no N application was approximately 75% of what was taken up from the plot that received the highest N application. This ratio dropped to about 25% after about 3 years of treatment. These results emphasize the importance of multiyear field experiments in terms of getting an accurate picture of treatment effects. We ran simulations for 10 consecutive years. The effects of the initial soil conditions were dissipated after the first 2 years, but only the 10-year results are reported. However, one asset of the model is that it allows the effects of changing management to be determined on an annual basis.
The crop was seeded on May 15 and harvested on Sept. 28. Irrigation was applied biweekly on the clay loam and weekly on the sandy loam because of its lower water-holding capacity. The soil profile was not recharged with water at the end of the growing season, but a sufficient amount of water to recharge the profile was applied as a preplant irrigation the next season. The time and amount of rainfall during the fallow season were those recorded at CIMIS station #145, Madera, California, during the calendar year 2006, a relatively wet year that recorded 29 cm (11.4 in) total precipitation; the 10-year average for station #145 was 22 cm (8.7 in). The individual rain event numbers are reported below, in the Results section.
We chose a range of N input amounts for each combination of variables in order to determine how much N would be required to achieve maximum yield and what the relationship was between yield and application amount. The annual amount of N leached was computed for each case. The direction (upward or downward) and rate of water flow and N concentration in the soil water at the 100 cm depth, which represented the bottom of the root zone, were computed and plotted as functions of time. By combining water flow and N concentration, we were able to calculate the cumulative leaching amount at given times and the total amount of N leached during the year.
Results
The results from the organic N addition to the clay loam soil will be presented first. The relative yield (RY) and annual amounts of leached N are plotted as a function of the applied amount of organic N in figure 3 for AW/PET = 1.1 and in figure 4 for AW/PET = 1.42. Note that for higher water application rates, much greater applications of organic N are needed to achieve a given RY. The higher water application level resulted in more leaching of N (as depicted in figs. 3 and 4) and thus the fields required higher N applications in order to achieve a given yield. The grower is primarily interested in yields, but the amount of N leached is an important number when we are looking to prevent potential groundwater degradation from nitrate.
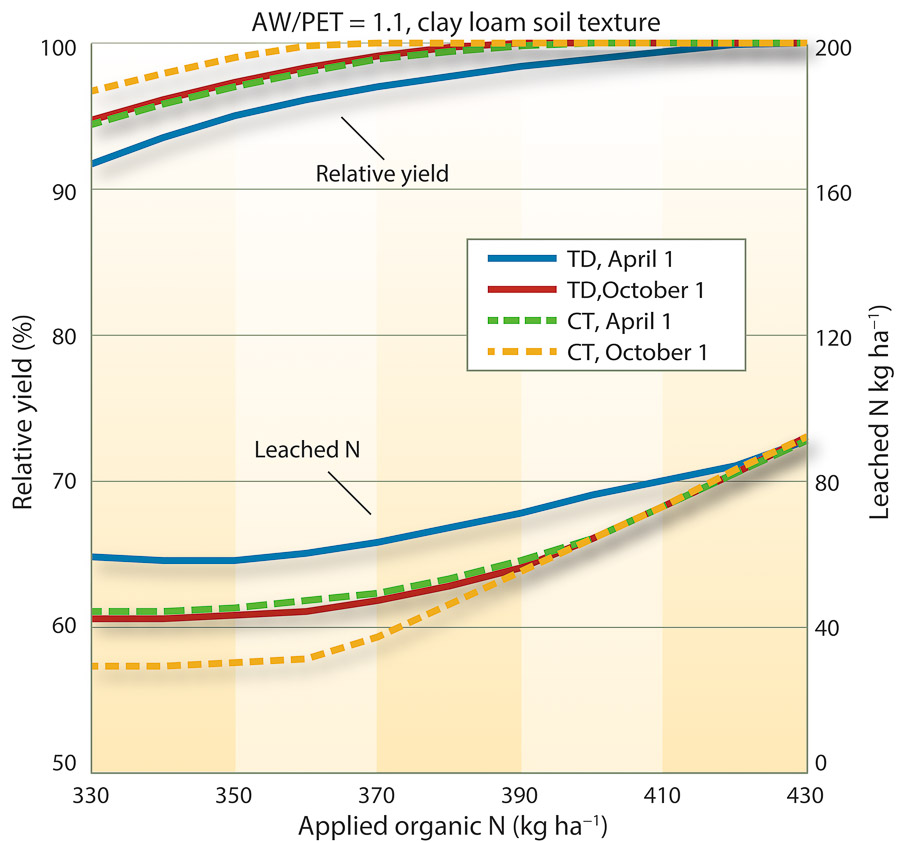
Fig. 3. Relative crop yield and amount of leached N for different amounts of organic N applied on April 1 or Oct. 1; results for the clay loam soil and AW/PET = 1.1. The temperature is assumed constant (CT) for one set of data, and for the second set adjusted for temperature dependence (TD) for different times of the year.
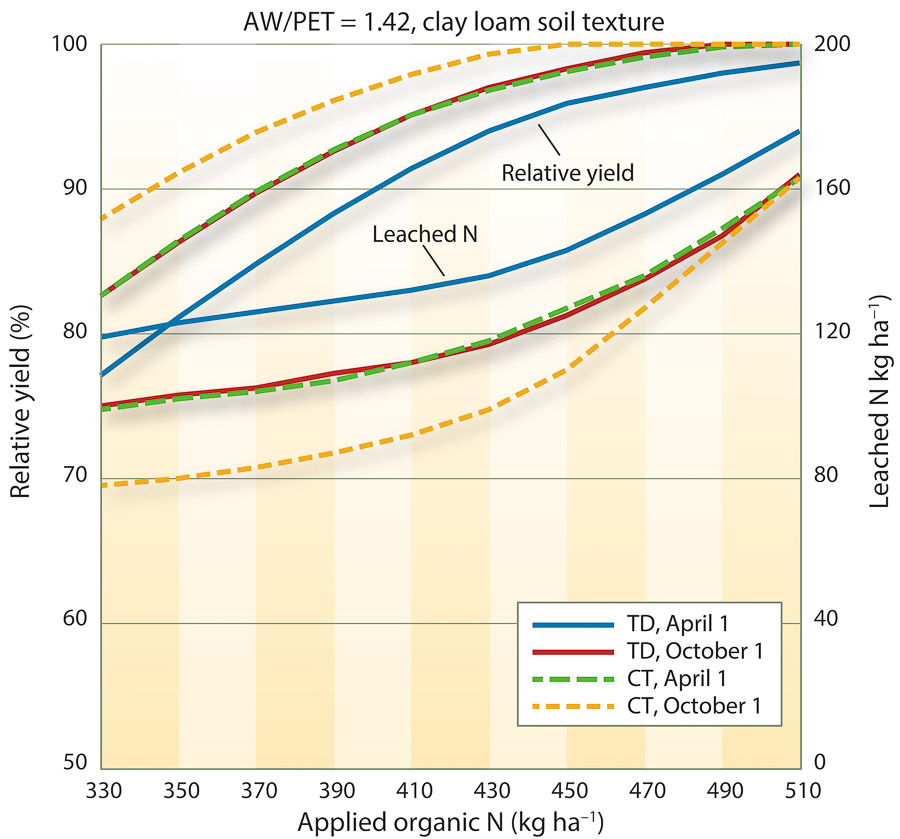
Fig. 4. Relative crop yield and amount of leached N for different amounts of organic N applied on April 1 or Oct. 1; results for the clay loam soil and AW/PET = 1.42. The temperature is assumed constant (CT) for one set of data, and for the second set adjusted for temperature dependence (TD) for different times of the year.
The model does not compute yield per se, but computes the relative N uptake (RNup) — relative, that is, to the potential uptake of a plant that does not experience N deficiency. We then need to establish a relationship between RNup and RY in order to convert our results to relative yield. Based on the results of Broadbent and Carlton (1979), this relationship for corn grown in the San Joaquin Valley is

Because the relationship between yield and N uptake is not linear, the RNup is less than RY for a given application.
Except for conditions of maximum yield, a reduction in the amount of N applied does not induce an equal reduction in the amount of N leached. For example, for AW/PET = 1.1, reducing N application below 360 kg/ha did not reduce the leaching amount at all (fig. 3). For AW/PET = 1.42, a reduction of 100 kg/ha from 430 to 330 kg/ha in N application caused a reduction of only 20 kg/ha in leached N (fig. 4). Two factors contribute to this relationship. First, the reduction in N uptake from a given application is greater than the corresponding reduction in corn yield. The reduction in uptake increases the amount of N available for leaching. Second, and more important, the reduction in yield causes a reduction in ET, resulting in an increase of deep percolation, which is a major contributing factor in N leaching. This result emphasizes the importance of a proper understanding of the meaning of the phrase “excess N application” in this context. If “excess” is defined as application of more N than is removed from the root zone by the crop, without consideration of yield, a reduction in N application will not result in an equal reduction in the amount of N leached from the root zone. Indeed, there might be very little or no resulting reduction in leaching.
The date of application of organic N and whether or not any temperature effect adjustment is made to the rate of mineralization are important factors affecting the results. For the clay loam soil, application in October produced higher yields than application in April, and correcting for temperature effects resulted in lower yields (fig. 3). The greater time for mineralization from October to April made more mineralized N available for the crop season. However, this N would be subject to leaching from winter rains. As will be reported later, the rainfall pattern did not cause deep water percolation on this soil. The lack of consideration for the effects of low winter temperatures on mineralization resulted in an overestimate of yield and an underestimate of leaching in this case.
Results from the sandy loam soil are illustrated in figures 5 and 6. Note that the scale for leached N in sandy loam soil (figs. 5 and 6, ranging from 0 to 400 kg/ha) is twice that used for the clay loam soil (figs. 3 and 4, ranging from 0 to 200 kg/ha) and that the amounts applied to achieve maximum yield are greater. Organic N that was applied in April produced higher yields than that applied in October on the sandy soil, the opposite of the case with clay loam soil applications. This result reflects the greater degree of winter leaching on the sandy soil as compared to that of the clay loam soil. Coincidentally, temperature had very little effect on results on the sandy soil.
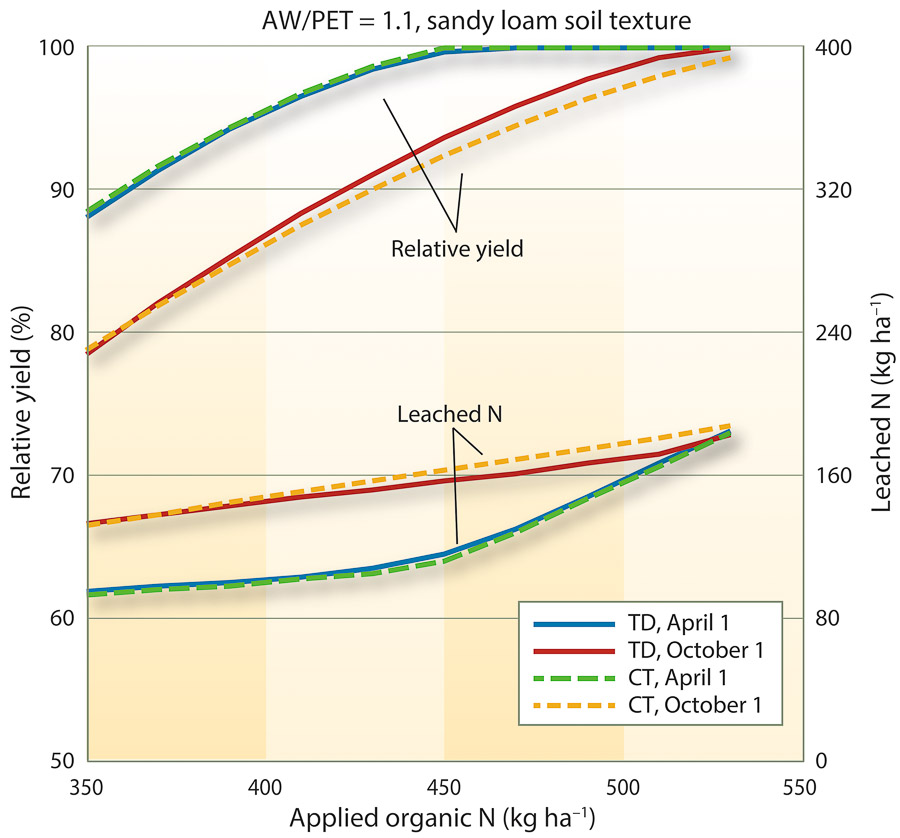
Fig. 5. Relative crop yield and amount of leached N for different amounts of organic N applied on April 1 or Oct. 1; results for the sandy loam soil and AW/PET = 1.1. The temperature is assumed constant (CT) for one set of data, and for the second set adjusted for temperature dependence (TD) for different times of the year.

Fig. 6. Relative crop yield and amount of leached N for different amounts of organic N applied on April 1 or Oct. 1; results for the sandy loam soil and AW/PET = 1.42. The temperature is assumed constant (CT) for one set of data, and for the second set adjusted for temperature dependence (TD) for different times of the year.
Figure 7 illustrates the effects of changes in the amount of water application on the N concentration and water flow at the bottom of the root zone at different times for the 370 kg/ha application of organic N on the clay loam soil. The same relationships are illustrated in figure 8 for the sandy loam soil. A negative water flux represents downward flow and a positive flux represents an upward flow at the bottom of the root zone (100 cm depth).
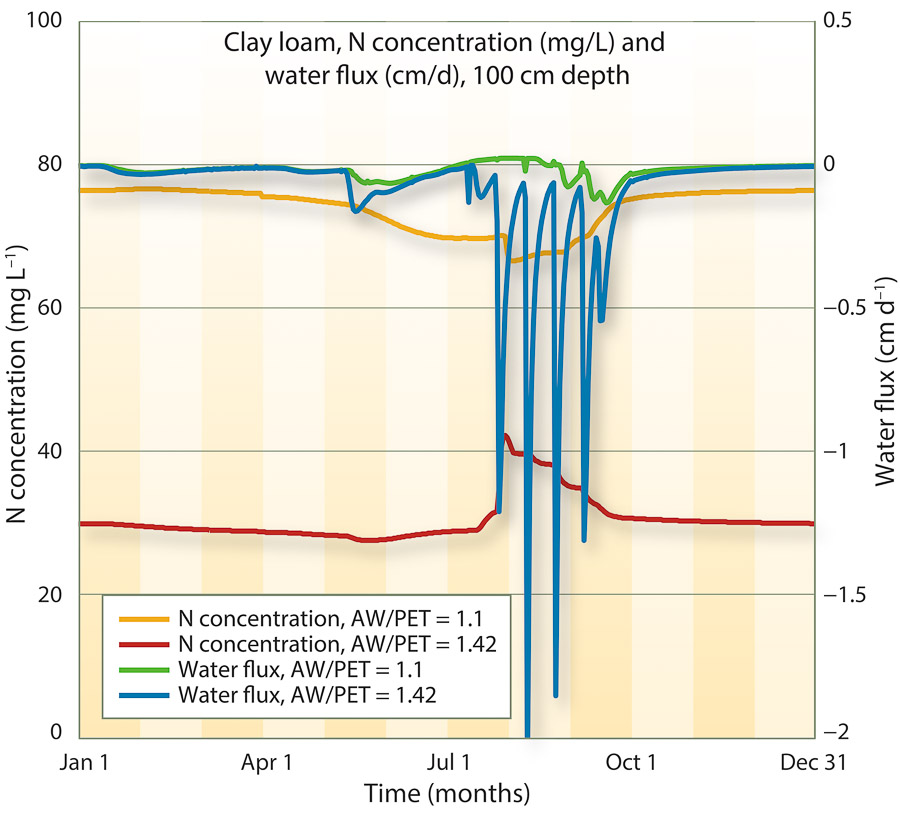
Fig. 7. N concentration and water flux in the clay loam soil at the bottom of the root zone at different times of year for the two water treatments. The results are for application of 370 kg/ha of organic N on April 1 (TD). A negative water flux represents downward water flow.
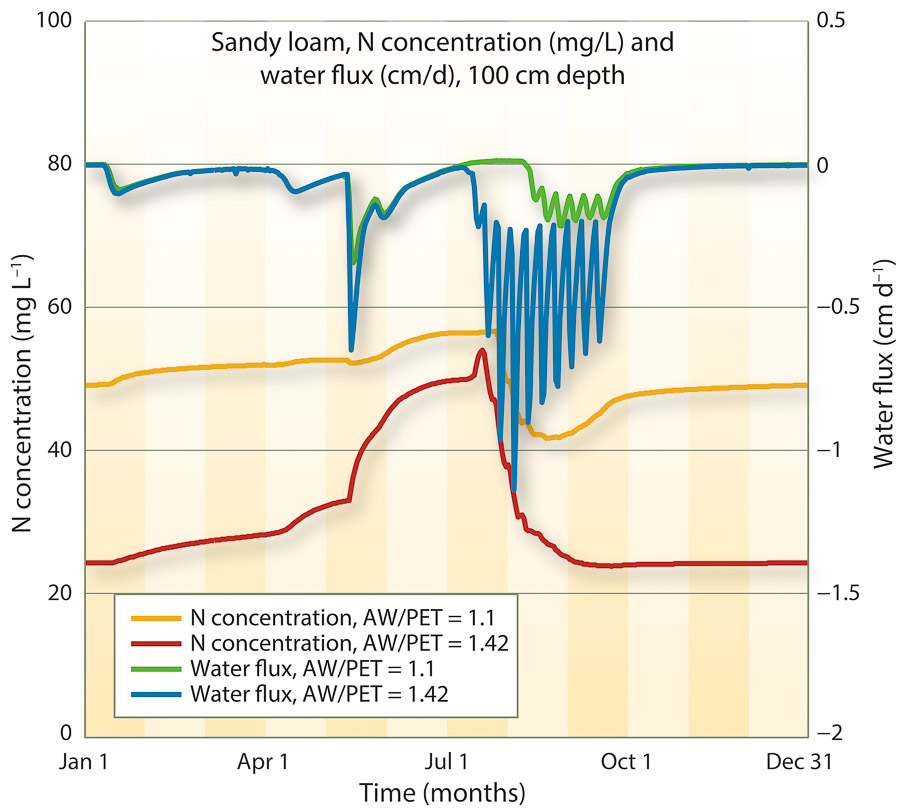
Fig. 8. N concentration and water flux in the sandy loam soil at the bottom of the root zone at different times of year for the two water treatments. The results are for application of 370 kg/ha of organic N on April 1 (TD). A negative water flux represents downward water flow.
Considering the clay loam soil first, water flow at the 100 cm depth during the noncrop season is very low for both irrigation treatments. The AW/PET = 1.1 treatment caused only very low downward flow after preplant irrigation and at the latter part of the growing season. As expected, the AW/PET = 1.42 treatment resulted in more water flow at the bottom of the root zone. However, the flux was quite small until after about Aug. 1. Thereafter, peak flows were simulated biweekly, consistent with the dates of irrigation. The N concentration was fairly constant at all times, but was about 2.5 times higher for the AW/PET = 1.1 treatment than for the AW/PET = 1.42. Conversely, the amount of annual N leaching was about half as much for the AW/PET = 1.1 as for the AW/PET = 1.42 treatment because there was less leachate. These results clearly demonstrate the problem with monitoring only the N concentration at the bottom of the root zone as an indicator that N is being leached from the crop. Besides being an expensive method, it can lead to erroneous conclusions.
The water flow pattern on the sandy soil differed from that on the clay loam soil, particularly in the non-crop season. The lower water-holding capacity of the sandy soil allowed the rain to penetrate deeper and create a downward flux at the 100 cm depth. This explains why the October application was less effective at producing yield than the April application. There is potential for a large amount of leaching to occur during the noncrop season. The amount of N leaching during the noncrop season is dictated by the soil properties, the total amount and distribution pattern of precipitation, and the depth of soil being considered, which is based on crop rooting patterns. The E-G model can be used to simulate leaching under any combination of these factors.
Because the sandy soil required weekly irrigation, the water fluxes during the latter part of the growing season reflect that irrigation schedule. As in the clay loam soil, N concentrations in the sandy soil remained fairly constant and were higher when there was less irrigation. In contrast, the amount of leached N was greater when there was more irrigation.
The cumulative amount of leached N and the amounts of irrigation or precipitation are shown in figure 9 for the case illustrated in figure 7. The rainfall pattern represents numerous small rain events during the winter, with the exception of two rains near Jan. 1 and one on May 21. The 7.2 cm event on May 8 was the preplant irrigation. The leaching pattern for both cases is chronologically consistent with the N concentrations and water fluxes shown in figure 7. The rate of N leaching was relatively low for AW/PET = 1.42 until the end of July, after which point the rate increased. This was concurrent with a period of high water flow. The N leaching was higher for the lower water application rate between Jan. 1 and Aug. 1. This was the result of higher N concentration in the soil water at the bottom of the root zone during that time period. Most of the yearly N leaching for AW/PET = 1.42 occurred during August and September, when large water flux events occurred and N concentrations were significantly lower than for AW/PET = 1.1.
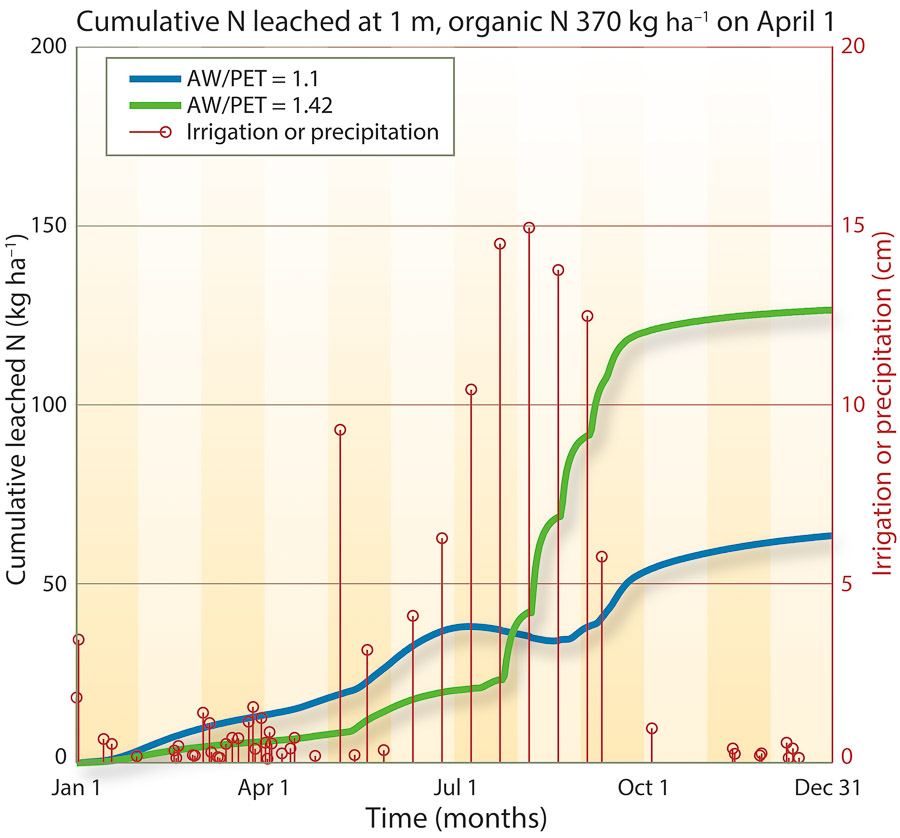
Fig. 9. Cumulative leached N and precipitation or irrigation amounts at different times of the year for the two water treatments. The results are for application of 370 kg/ha organic N on April 1 (TD).
Even though significantly more water was applied than lost through ET for the AW/PET = 1.42 treatment, the water flow at the bottom of the root zone was very low until the end of July. This result, though not anticipated, could be explained after observation. Note that in figure 9 the PET, and therefore the AW, continually increased until about Aug. 1. The amount of AW was intended to recharge the soil, based on potential ET since the previous irrigation. The “excess” water application prior to Aug. 1 would have been removed from the soil via ET (as shown by the higher ET numbers) after irrigation and would not have reached the 100 cm depth. After Aug. 1, the ET decreases with time, at which point the “excess” water would flow beyond the 100 cm depth and promote leaching, as observed.
All of the inorganic N treatment was applied on the seeding date of May 15, following the May 8 preplant irrigation. The RY and annual leached N results are graphed in figure 10. Far less inorganic N had to be applied to achieve maximum yield than was the case for organic N, and the smaller inorganic N application also resulted in less N leaching. Higher inorganic N applications were required to achieve maximum crop yield on the clay loam soil than on the sandy soil, and a higher level of leaching resulted. Higher applications and greater leaching were found for the larger water application on both soils. Detailed data on the water fluxes and concentrations are not presented here, but we noted that the soil concentrations were lower for the inorganic application than for the organic and the concentration was lower for the larger water application than for the smaller.
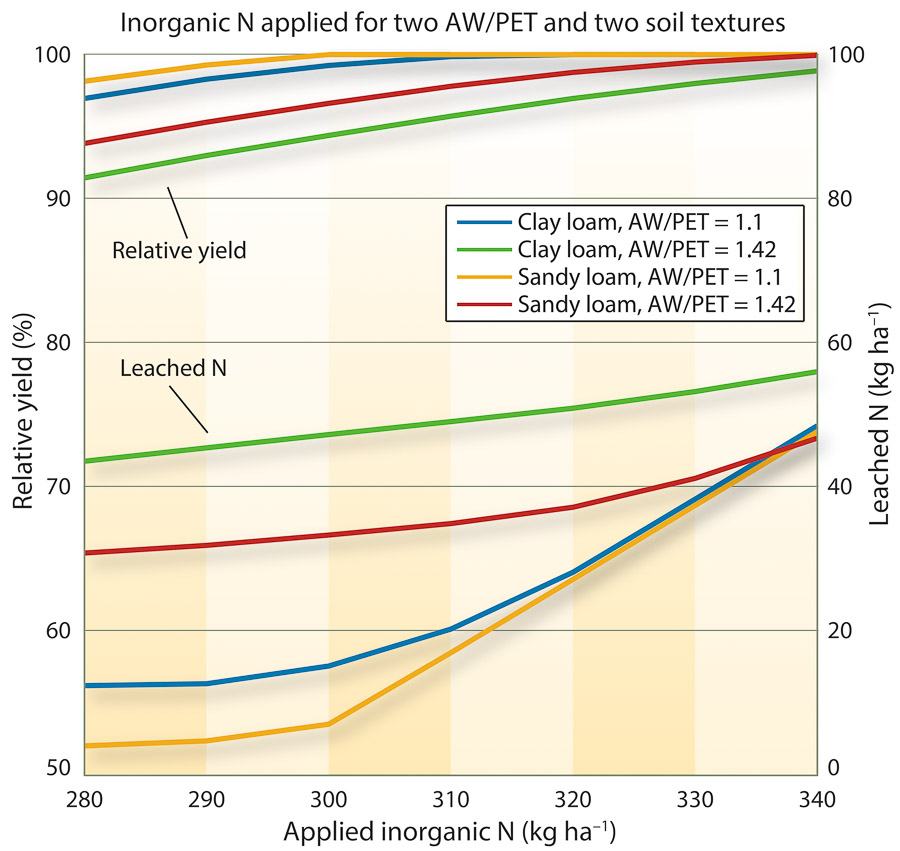
Fig. 10. Relative crop yield and amount of leached N for different amounts of inorganic N application for the two soils and two water treatments.
Unlike the organic treatment, which continues to produce mineral N after application, the inorganic N was applied near the surface each year only on the seeding date, and became entirely available to the plants then. Water percolating through the soil at that point would transport the N downward. However, corn takes up a large amount of N during the first half of the growing season, and in that way extracts the N from the soil and removes most of it before it can reach the bottom of the root zone. The smaller, more frequent water applications on the sandy soil would have reduced the depth of water penetration on the sandy soil and made the N more available to the crop. This could account for the sandy soil having less leached N than the clay loam soil.
Clearly, many complex interacting factors contribute to crop yield and the leaching of N from a field. The timing of water and N application and their amounts greatly affect the results. Proper management of organic N applications requires knowledge of the timing of mineralization, not just the total amount that will be mineralized during a given time period. Our results demonstrate the importance of converting the conventional data (decay series mineralization) into rate of mineralization as a function of time. We have also shown the importance of making adjustments to account for temperature.
Discussion of scientific findings as related to NHI
The Nitrogen Hazard Index (NHI) considers the crop, soil and irrigation system as critical factors in assessing the relative risk of groundwater degradation by nitrate. The following discussion of our results is in the context of these three factors.
The results we report here for corn differ in detail from the results one would see from other crops. Corn has an exceedingly high rate of N uptake over a short period of time and almost no uptake during the latter part of the season, when the crop still has a high transpiration rate and so requires irrigation (fig. 2). A crop with such a high maximum N uptake rate cannot possibly be fertilized solely with organic N if the goal is to meet peak demand without leaving excessive N in the soil before and after crop N uptake. Pang and Letey (2000) compared simulations of wheat and corn fertilization with organic N and found that wheat had higher yields and less leached N than corn. Even though both crops required the same total amount of N over the season, the N uptake for wheat extended over a longer period than for corn, and with lower peak rates. Crops with a low, continual N uptake demand are better suited to organic N fertilizers. Growing other plants in the field during the noncrop season facilitates the capture of the mineralized N that continues to enter the soil through the decay process. Feng et al. (2005) reported that a grass crop grown during the winter effectively reduced the leaching of N after a corn crop that had been grown on the same field and had been fertilized with dairy liquid waste.
The deep root system of corn is a positive feature, for our purposes. The crop can extract N over a considerable depth of soil before it leaves the root zone en route to groundwater. The rapid N uptake can be a positive feature for inorganic fertilizers that can be applied at high amounts near the soil surface. In that case, the N is rapidly taken up early in the crop season, leaving little in the soil for leaching later on. Corn has both positive and negative qualities with regard to potential groundwater degradation from nitrate, so we assigned the crop an intermediate hazard index number of 3. More important than the NHI number, though, is an understanding of the dynamic interactions that occur in a corn field.
Soil type significantly affects a field's potential for groundwater degradation. Under the conditions of the simulations reported here, the main effect of the sandy soil was to increase N leaching during the winter. The sandy soil's low water-holding capacity allowed precipitation water to move beyond the root zone, whereas the more capacious clay loam retained the precipitation water within its root zone depth.
Another major impact of soil type was not entirely manifested in the simulations. Soil type dictates how much water will infiltrate the soil using a surface irrigation system. Sandy soils have a high infiltration rate and commonly experience more water infiltration, whether the water comes from rainfall or a surface irrigation system. Our simulations used water scheduling so that the two AW/PET values would be the same for both soils. The AW/PET = 1.42 condition is far more likely to occur on sandy soils than on finer-textured soils. In every case, the higher AW/PET treatments induced lower yields and higher amounts of leached N than did the lower AW/PET treatments. This increased probability of N leaching is greater for the sandy soil than the clay loam, but we partially mitigated this factor by altering the irrigation schedule to apply smaller and more frequent irrigations in the sandy soil simulations than in the clay loam. This adaptation demonstrates that the impacts of soil type, when understood, can be compensated for through adjustments to management. The model does not include a provision for denitrification. Therefore, the leached N values represent the worst-case scenario for any soils that may induce denitrification. In a real-world situation, less denitrification would be expected on the sandy soil. The clay loam soil would be assigned an index number of 3 and the sandy loam soil a number of 5.

Converting gravity flow systems to pressurized systems provides an opportunity to reduce deep water percolation and even the amount of fertilizer applied.
The irrigation system is the third factor included in the NHI. Surface irrigation systems allow little control over the amount and uniformity of irrigation. All pressurized systems allow control over the amount of application. Microirrigation systems also have potential for good uniformity. For our simulations, we assumed uniform irrigation. The uniform AW/PET = 1.1 can probably only be achieved with a well-designed and managed microirrigation system. Without fertigation, as simulated in this study, the index number would be 2. The AW/PET = 1.42 would be typical of surface irrigation that has an index number of 5.
Uniform irrigation (meaning that the same amount of water infiltration occurs at all locations in the field) is essential to accomplishing both high yield and low groundwater degradation. The extreme choices when irrigating a field with nonuniform water application are to overirrigate or underirrigate the entire field. Overirrigation causes groundwater degradation and underirrigation causes poor yields. An intermediate trade-off between the two is necessary. In principle, uniform irrigation allows both goals to be achieved.
The findings in this simulation study are completely consistent with measurements made on 86 farm fields (Letey et al. 1977; Letey et al. 1979), which attests to the validity of the model. First, we see that the amount of N leached is more closely related to the amount of water percolating beyond the root zone than on the amount of N applied. Second, we see no correlation between the amount of N leached and the concentration of N in the water. The scientific evidence overwhelmingly indicates that the irrigation management decisions dictate what nitrogen management options are available for achieving high yield with low groundwater degradation.
Results in the context of track and report
None of the recommendations made by the State Water Resources Control Board (SWRCB) to the California Legislature with regard to nitrate in groundwater identifies water management as a potential controlling factor. The Board's recommendations emphasize development and implementation of an N mass balance tracking and reporting system to manage application of N fertilizer materials.
The law of conservation of mass specifies that, in one sense of the term, there is always mass balance. However, in a transient dynamic system in which there are several pools for N, the term “mass balance” lacks clear meaning. There are continual additions and deletions from each pool. If the identical management is continually followed, as is the case for our simulations, a steady-state condition develops when the cycle repeats itself on a temporal basis. Implicit in some usages of the term “mass balance” with regard to farm fields is the notion of a balance between the N added and the N removed by the crop. Sometimes N balance is defined as the ratio of N removed by the crop to the amount of N applied. This narrow definition ignores the several other pools and reactions present for N in the soil. For example, denitrification losses can be significant. In direct measurements in California agricultural fields, Ryden et al. (1979) found that in one field 51 kg/ha denitrified over a 123-day span when 335 kg/ha were applied (15% denitrified). Similarly, denitrification losses at seven study sites from three fields under vegetable production ranged from 95 to 223 kg N/ha/yr, or 14% to 52% of the applied N (Ryden and Lund 1979).
A reduction of leached N equal to the reduction of N application is a common assumption, by virtue of “mass balance.” This assumption holds true if the higher N application is greater than is necessary to get maximum production, but it will not hold true if the reduced N application induces a reduction in crop yield. Indeed, reductions in N application can in some cases cause only very small reductions in the amount of N leached. Ignoring crop yield represents a major deficiency in the track and report approach that can lead to erroneous conclusions.
Tracking requires measurement. Because leaching of N is the culprit in this scenario, measuring the rate of leaching is vital. To accomplish this, one must measure the N concentration in the soil solution and the rate of water flow at the bottom of the root zone. An accurate measurement of this water flow at any particular time, however, is impossible. Furthermore, the flow rate can fluctuate greatly with time, as illustrated in figures 7 and 8. Because of all this, the leaching numbers are affected primarily by the water flow rate rather than by the concentration. Indeed, as it turned out, higher leaching of N was commonly associated with a lower soil solution concentration.
The measurement of nitrate concentrations in groundwater bodies provides valuable information. Concentrations measured today actually manifest the consequence of actions that took place decades ago. Whether the very high numbers we see are a result of excessive N application or of excessive irrigation is not important, though. What is important is that we improve present management practices in a way that will reduce future nitrate loads to the groundwater. It is true that a management change that decreases the load will not be manifest in groundwater concentrations for decades, but keeping water percolation beyond the root zone to a minimum is the most effective way to reduce the N load to groundwater. This decades-long feedback cycle keeps groundwater monitoring from being a reliable indicator of the effectiveness of present-day management practices. Still, proper irrigation management is essential to the effective implementation of more beneficial N management practices. Not only will a tracking and reporting system not achieve the goal, it could easily lead to the adoption of costly, ineffective management practices. In fact, tracking and reporting is only an attempt to monitor what is happening and has little immediate impact on reducing N loads.
Conclusions
The development of BMPs rather than a tracking and reporting regime is the effective, rational approach to reducing N loads. The NHI concept was proposed by the Nutrient Technical Advisory Committee (TAC), appointed in 1994 by the SWRCB as a resource for developing BMPs. Importantly, TAC proposed that fields with a low NHI number, which pose a low threat to groundwater degradation, should be exempt from a formal BMP so that resources could be focused instead on cases where they would more effectively reduce degradation. Additionally, the NHI identifies whether the major threat for each field comes from the soil, crop or irrigation system, or a combination of these. Using this approach, we would formulate a BPM tailor-made for each specific field's conditions. Although the SWRCB accepted the TAC report, the lack of available index numbers for the various soils and crops meant that the TAC recommendation was never implemented. Those index numbers are available today for many soils and crops, so it is time that the TAC recommendation and the SWRCB action of 1994 be reviewed.
Citations
Soil type, crop and irrigation technique affect nitrogen leaching to groundwater

