


All Issues
Vegetables, fruits and nuts account for 95% of organic sales in California
Publication Information
California Agriculture 50(6):9-13. https://doi.org/10.3733/ca.v050n06p9
Published November 01, 1996
Abstract
A total of 1,159 organic farmers sold over 70 individual commodities, grossing $75.4 million from 45,493 producing (physical) acres in 1992–93. All but 5% of the growers raised some fruit, nut or vegetable crop. Organic production in California is highly concentrated: The largest 7% of organic farms claimed three-fourths of the total gross sales, while half of the farms were smaller than 5 acres with annual sales of under $7,500.
Full text
The California Organic Foods Act (COFA) was signed into law in 1990. COFA's primary goal was to provide assurance to producers, processors, handlers and consumers that foods produced and marketed as organic would indeed be as claimed. Standards and procedures were put into place in 1992 to regulate the production, processing, handling and labeling of organic products.
COFA requires all growers and/or businesses that choose to market, handle and/or process organic products within the state to register with the California Department of Food and Agriculture (CDFA) Organic Program on a yearly basis. For growers, this means filling out a form that asks for farm location and acreage farmed organically. The form also has a table asking for a listing of commodities grown, including the commodity type and gross sales for each commodity grown and marketed as organic. As a result, data is available from the registration forms to statistically characterize California's organic agriculture for the first time. This analysis will focus on industry size, commodities that are produced and sold as organic, regional distribution of production, and size concentration. Data has been aggregated to avoid revealing confidential information about individual farming operations.
The level of detail possible in this report is limited by the inconsistent reporting by growers of “commodity” and “type” on the registration forms. For example, consider three growers of navel oranges. When asked to report the commodity and type grown, one grower might list “oranges/navel,” another might list “citrus/oranges,” while yet another grower might only list “fruit.” Still others gave detailed listings of the commodities grown, but only one encompassing sales figure. To avoid these ambiguities in the future, CDFA has developed a list of commodities and types from which growers will select.
Producers were divided into major commodity groups: field crops; fruit and nut crops; livestock; combined fruit, nut and vegetable crops; nursery and flower; and vegetable crops. The combined fruit, nut and vegetable category was necessary because a number of growers reported their production under the broad heading “fruits and vegetables,” making it impossible to separate acreage or gross sales into the other commodity groups. Other growers reported crops that fell into more than one principal commodity group. For example, a number of growers reported separate sales in both the field crop and vegetable crop commodity group categories. As a result, the actual number of growers (1,159) and the total number of observations in the commodity groups (1,277) are not equal. In other words, many growers reported sales in more than one of the major commodity groups, which is referred to as the mixed commodity group in the analysis.

Growers were also divided into eight geographic regions based primarily on climate conditions. The map in figure 1 shows the counties in each region.
Industry size
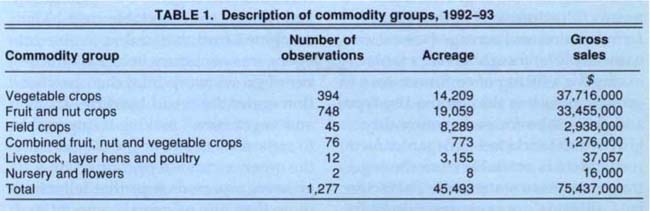
A total of 1,159 organic farmers sold more than 70 individual commodities. Gross sales for organically grown commodities were reported to be $75.4 million from 45,493 producing (physical) acres in 1992–93 (table 1). To put this in perspective, organic agriculture represented approximately 0.5% of the total gross sales and farmed acres for all growers in the state in 1992–93, excluding dairy and livestock.
These numbers should be interpreted with some caution. Land that was double or multiple cropped was counted as one physical acre. As a result, the number of harvested acres is undoubtedly higher than the physical acres.
Industry experts estimate that gross sales for 1992–93 were close to $85 million, but unfortunately, this number cannot be substantiated. The reported gross sales of $75.4 million is thought to be low due to limitations of the data. Most importantly, growers are not obligated to report to CDFA sales in excess of $5 million, so total sales may be underreported. Further, it is reasonable to assume some underreporting of sales because registration fees are levied by CDFA and are based on a grower's total gross sales. Undoubtedly, some growers did not register at all in the first year of required registration but rather took a wait-and-see attitude. These unregistered growers would contribute to the underreporting of sales as well as an underestimate of the number of growers and number of acres in organic production.
Organic commodities
Because the inconsistent reporting of commodity types by growers made it impossible to determine gross sales for individual commodities, aggregated commodity groups were used instead. However, it is informative to note the variety of commodities mentioned in reporting forms for every major commodity group (table 2). Virtually every major commodity in California is represented on the 1992–93 list with the notable exception of dairy. (The 1996 registration does include a few dairies.) The list illustrates the breadth and potential of the industry.
In the aggregated commodity groups, fruit and nut crops and vegetable crops combined represented 96% of the gross sales on 75% of all acreage (table 1, fig. 2). Breaking out the two major commodity groups, fruit and nuts comprised the largest share of acreage, but followed vegetables in gross sales. In contrast, field crops had a small percentage of sales, but a significant share of the acreage. Specifically, fruit and nut crops account for almost half (42%) of the total organic-producing acres for the state; vegetable crops about one-third (31%); and field crops one-fifth (18%) of the acreage.
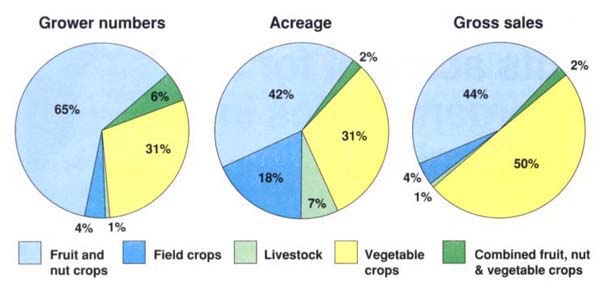
Fruit and nut crops and vegetable crops made comparable contributions to total gross sales. Vegetable crops were the highest value commodity group for the state, with $37.7 million, representing 50% of the total gross sales (table 1, fig. 2). Fruit and nut crops generated $33.5 million, or 44% of the state's total gross sales, while field crops totaled only $2.9 million, or 4% of the total gross sales.
Distribution of production
The San Joaquin Valley region had the highest number of organically farmed acres in the state for 1992–93, with about one-third of the total organic acres (table 3). The organic acreage was split between fruit and nuts (55%) and vegetables (40%). In fact, fruit and nut crops in the San Joaquin Valley showed the largest acreage (16%) for any region and commodity group; only 2% of the acreage was in organic field crops.
In contrast, the Sacramento Valley, with about one-fourth of the state's acreage, planted almost three-fourths to field crops, one-fifth to fruits and nuts and only one-tenth to vegetables. The division of acreage into commodity groups in the Central Coast region, which encompassed about one-tenth of the total acreage, was similar to the commodity break down for the San Joaquin Valley.
The county with the greatest number of acres registered as organic was Kern in the San Joaquin Valley (13% of total organic acres); second was Fresno, also in the San Joaquin Valley (8% of total organic acres). Both of these counties show acreage split between fruit and nut crops, and vegetable crops.
The San Joaquin Valley accounted for more than one-third of the gross sales for the state. The Central Coast growers generated one-fifth of the sales and the South Coast almost another fifth. Kern County growers, with the greatest number of acres under organic production for a single county, also have the highest gross sales, $18 million, with about one-fourth of the state's total organic sales. Two-thirds of that income was from fruit and nut crops and the other third was from vegetable crops, with a relatively small contribution from field crops. Monterey County was the second highest grossing county with $9 million (12%), virtually all from vegetable crops. Ventura County was third with $5 million (7%), also dominated by vegetable crops.

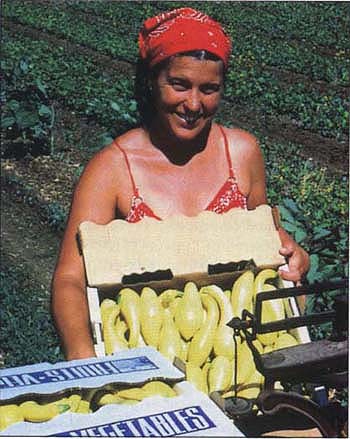

Vegetable crops account for 31% of the state's organic acreage and reap $37.7 million, representing 50% of the total gross organic sales.
Farm profiles by commodity
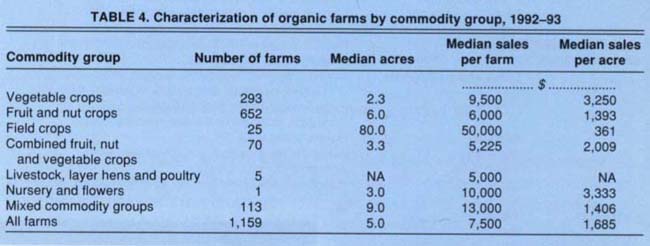
Vegetable crops and fruit and nut crops combined dominate the industry with respect to numbers of farms or growers (table 4, fig. 2). All but 5% of the growers produced some fruit, nut or vegetable crop. Almost three-fourths of the growers produced fruit and nuts, about one-third reported vegetable crops and only 4% grew field crops.
The characteristics of the median farm in each commodity group explains the relative importance of the group to the organic industry as a whole, with respect to acreage and gross sales. The median is used instead of the average because of the high concentration of small farms.
Field crops had the largest median size farm at 80 acres. Half of the farms growing field crops cultivated between 40 and 350 acres. Only the largest 10% farmed more than 600 acres. In marked contrast, the median vegetable crop and fruit and nut crop operations were very small with only 2.3 acres and 6 acres, respectively. Three-fourths of the vegetable growers had fewer than 12 acres and only 10% had more than 60 acres. Similarly, three-fourths of the fruit and nut farms produced on less than 20 acres, only 10% on more than 60 acres.
Nursery and flowers showed the highest median gross return per acre ($3,333 per acre) followed by vegetable crops ($3,250 per acre), with fruit and nut crops significantly lower ($1,393 per acre). The median gross return per acre for field crops reflected the lowest value of any commodity group ($361 per acre). Farms producing field crops showed the highest median annual gross sales ($50,000) followed by mixed commodities ($13,000) and nursery and flowers ($10,000). Two-thirds of the vegetable crops and three-fourths of the fruit and nut crops farms reported annual sales less than $17,000, while three-fourths of the field crop farms reported over $15,000. This suggests that most of the producers of organic fruit, nuts and vegetables are supplemented by some other income, and field-crop producers are more likely to be full-time farmers. This result is not surprising considering the high investment costs required for field-crop production.
Vegetable-crop production is characterized by a large number of small growers showing relatively high returns per acre. Fruit and nut production accounts for three-fourths of the growers on small farms and lower returns per acre than the vegetable crop growers. The relatively small number of field-crop producers manage larger farms than the other crop producers for modest net returns per acre, but the highest sales per farm.
Looking at all farms, the median organic farm has 5 acres and total sales of $7,500 annually. Half of the farms are between 2 and 20 acres and gross between $2,400 and $24,000 a year. About 20% of the growers grossed over $40,000 and 14% grossed over $100,000 for the year. This suggests an industry with a predominance of part-time growers, but undoubtedly a substantial number of full-time farmers. Organic farming is likely to be a means of supplementing other income for small growers, while larger growers have established sizable organic markets and operate on a commercial scale.
Farm profiles by region
More than one-fourth of organic farms or growers (28%) were found in the South Coast region of the state (table 3). The North Coast was the region with the second highest number of growers (21 %), followed by the Central Coast (14%). The three counties recording the highest number of organic growers were: San Diego (253 or 22%), followed by Mendocino (96 or 8%) and Sonoma (87 or 8%). Alpine, Mariposa, Modoc, Mono, Plumas and Sierra counties did not have any farmers registered in the state organic program.
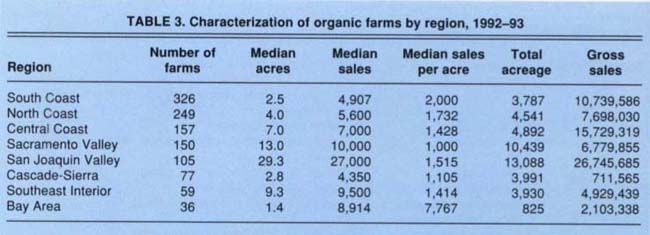
Half of the organic farms in the San Joaquin Valley had less than 29 acres. One-fourth were less than 5 acres and one-fourth were more than 75 acres, with only 10% of the farms more than 200 acres. The second-largest median farm size was in the Sacramento Valley, 13 acres. There, half of the farms were between 3 and 13 acres with 10% of the farms more than 100 acres. The median-size farms in the other regions were all smaller than 10 acres.
Due at least in part to the relatively large farms, the San Joaquin Valley had the highest median annual sales at $27,000. One-fourth of the farms grossed below $9,000 while the upper one-fourth grossed over $118,000 per year, reflecting the region's tremendous range in scale. The median sales in the Sacramento Valley, the Southeast Interior and Bay Area were all about $9,000 to $10,000 per year.
The median sales per acre were between $1,000 and $2,000, with the no-table exception of the Bay Area, where half of the growers grossed just under $8,000 per acre — attributable to the concentration in high-value, intensive vegetable production and proximity to high-end markets. In comparison, only 10% of the growers in the Sacramento Valley, South Coast and San Joaquin Valley received over $6,000 per acre; and 10% of the North Coast and Central Coast growers grossed over $7,000 per acre.
Concentration
Organic production in California is highly concentrated. The largest 2% of farms, those grossing more than $500,000 dollars, claimed half of the total gross sales in 1992–93. Farms with gross sales between $165,000 and $500,000 (5% of all farms) received another 25% of the total gross sales. Smaller farms, with sales between $10,000 and $165,000 (30% of all farms) garnered 21% of gross sales. The remaining 4% of sales was divided among the growers (64%) who realized $10,000 or less in sales.
This concentration in revenue is not surprising considering that more than half of the growers farm 5 acres or less and only 7% of growers farm more than 100 acres. The largest 5% of farms managed two-thirds of the organic acreage. Vegetable crops tended to be the most highly concentrated group with the largest 5% of farms accounting for almost 70% of the acreage. In contrast, the largest 5% of farms comprised 45% of the land for fruit and nut growers and 36% for field crop producers.
Organic certification
Organic certification is separate from, and does not act as a substitute for, state registration. While state registration is required by law, certification is currently voluntary. However, the federal Organic Foods Production Act of 1990 (OFPA), which is expected to be implemented in late 1996 or early 1997, will require growers with gross sales over $5,000 per year to be certified by a federally accredited certifying agent. During the 1992–93 report period, about 40% of California organic growers reported less than $5,000 in sales.
Certification serves as additional assurance to handlers, processors and consumers that products marketed as organic meet the specific production standards required by law and a private certification organization, and enable organic products to be sold nationwide. The certification process varies across organizations, but typically requires growers to keep records of production inputs and includes a field inspection.
Six private certification organizations actively certified growers in California during 1992–93: California Certified Organic Farmers (CCOF); Farm Verified Organic (FVO); Organic Crop Improvement Association (OCIA); Organic Growers and Buyers Association (OGBA); Quality Assurance International (QAI); and Scientific Certification Systems/Nutriclean Organic Certification Program (SCS).
More than half (55%) of the registered organic growers were not certified during 1992–93. Almost 90% of the certified growers were certified by CCOF, leaving only 10% certified by one of the other five organizations. A few growers were certified by more than one certification organization, presumably for marketing purposes.
Looking at certification by sales class, smaller growers tended to be uncertified while larger growers tended to be certified. In fact, 83% of the uncertified growers grossed under $10,000 in organic sales. These growers typically do direct marketing and have less incentive to be certified than larger growers who market through other channels. As a result, while only 45% of growers were certified, a greater percentage of the acreage, 64%, was certified.
Certification also varied by commodity group. About half of the fruit and nut and vegetable growers were certified in contrast to 80% for field crops. This supports a conjecture that processed commodities are more likely to be certified than fresh market commodities. However, for marketing purposes and legal protection, both processors and produce handlers are increasingly requiring proof of certification from growers when purchasing organic commodities. This trend would indicate an increase in the rate of certification among growers selling products through these outlets. Furthermore, the rate of certification will undoubtedly increase upon implementation of the OFPA.
Industry trends
No comprehensive statistical analyses for California's organic agriculture exist for production prior to 1992. As such, the information contained here should be considered baseline statistical information for the state; it follows that industry trends cannot be documented.
Experts believe that between 1992 and 1996 the overall industry has at least doubled with respect to total gross sales. This growth can be explained in part by the expansion of organic cotton, salad mix and wine grape production in the state. As of June 1996, there were approximately 1,500 registered organic growers in California, according to CDFA. This represents a per year increase of roughly 15% in the number of state-registered organic growers. The fact that gross sales have probably doubled since 1992, while the number of growers has only increased by approximately 30% suggests that the number of large growers has increased, and/or that the size of existing operations has increased.
Continue statistical analyses
Annual statistical analyses should continue so that California's organic agriculture can be characterized in all subsequent years, and also so that overall industry trends can be identified. This information would be valuable to, among others, farmers, researchers, educators, agribusiness, policy makers, public-interest groups, bankers and venture capitalists. The commodity list developed by CDFA for reporting will increase the level of detail, and ultimately the value, of the information obtained through the registration process.
For more information
California Certified Organic Farmers (CCOF). 1993. Certified Organic Membership Directory and Product Index.
California Department of Food and Agriculture. 1993. California Agriculture Statistical Review — 1992.
California Department of Food and Agriculture Organic Program. 1994. California Organic Program. Producing, Handling and Processing Organic Products in California.
Klonsky, Karen and Laura Tourte. 1994. State Registration and Organic Certification: A Guide for California Growers. Department of Agricultural Economics. UC Cooperative Extension. Davis.
U.S. Department of Commerce. 1994. 1992 Census of Agriculture. Volume 1 Geographic Area Series Part 5: California State and County Data.
Vegetables, fruits and nuts account for 95% of organic sales in California

