


All Issues
Effectiveness of tensiometers and electrical resistance sensors varies with soil conditions
Publication Information
California Agriculture 54(3):47-50. https://doi.org/10.3733/ca.v054n03p47
Published May 01, 2000
PDF | Citation | Permissions
Abstract
Tensiometers, gypsum blocks, Watermark blocks and an electromagnetic conductivity meter were evaluated for their response to changes in soil moisture content. Tensiometers and Watermark blocks had similar responses, but the blocks operated better than tensiometers in drier soil. Gypsum blocks did not respond until some threshold moisture content was reached. The electromagnetic conductivity meter responded to changes in moisture content in fine-textured soil, but it did not respond in sandy soil.
Full text
Measuring or monitoring soil moisture content can help determine when to irrigate, how much water to apply, adequacy of wetting, patterns of soil moisture extraction by roots, and trends in increasing or decreasing soil moisture content with time. Such information can help improve crop yield, increase irrigation efficiency, stretch limited water supplies and reduce nonpoint-source pollution.
Traditional methods for monitoring soil moisture content include soil sampling, tensiometers, electrical resistance/conductance methods and neutron moisture meters. These devices must be calibrated to provide actual soil moisture contents. The calibrations depend on soil texture, particularly for tensiometers and resistance blocks and less for the neutron moisture meter. More recently, dielectric sensors have been developed that determine soil moisture content based on the dielectric constant of the soil.
This project investigated the response of these sensors to changes in soil moisture content to evaluate their appropriateness for irrigation scheduling on farms. Criteria used to evaluate these instruments were ease of operation, ease of installation, maintenance and cost.
Evaluating monitoring devices
Tensiometers, electrical resistance blocks and an electromagnetic conductivity meter were evaluated at six sites in the San Joaquin Valley. These sites and their average percent sand, silt and clay were Sandy Loam-WAL (70-29-1), Loamy Sand-GR (82-17-1), Sandy Loam-PE (67-29-4), Silt Loam-WA (19-62-19), Silty Clay-WB (19-46-35) and Silt Loam-CO (19-52-29). The letters following soil type identify site location.
At Sandy Loam-WAL, silty clay loam occurred at 6 inches, and sandy loam at the deeper depths. Sandy loam occurred at 6 inches deep and loamy sand at the deeper depths for Loamy Sand-GR. Soil texture was fairly constant with depth for Sandy Loam-PE. Silt clay loam to silty clay occurred at Silty Clay-WB. Silt Loam-WA had smaller clay contents and larger silt contents compared with Silt Loam-CO. Sandy Loam-WAL was a flood-irrigated walnut orchard, Sandy Loam-PE was a flood-irrigated peach orchard, Loamy Sand-GR was a flood-irrigated vineyard, Silt Loam-WA and Silty Clay-WB were furrow-irrigated tomato fields, and Silt Loam-CO was a furrow-irrigated cotton field. Only data from Sandy Loam-WAL and Silty Clay-WB are shown in the following figures to simplify the illustrations. Results from these sites were representative of those from the other sites.
Tensiometer
In this paper, we report on five devices evaluated at these sites:
-
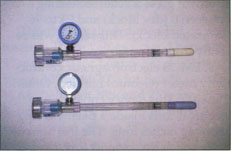
Tensiometer (Irrometer Company, Riverside, CA; Soil Moisture Equipment Co., Santa Barbara, CA). A tensiometer is a plastic tube with a porous ceramic cup attached to one end and a vacuum gauge to the other. It measures soil moisture tension up to a maximum of about 80 centibars at or near sea level. Even though the behavior of tensiometers is well understood, this device was evaluated for comparison purposes.
-
Watermark electrical resistance block (Irrometer Co., Riverside, CA). This device consists of two electrodes imbedded in a sand-ceramic porous material. A wafer of gypsum is contained in the block to buffer salinity effects. The instrument used for this block converts measured resistance into equivalent centibars of soil moisture tension with a range between 0 and 199.
-
Gypsum electrical resistance block (Soil Moisture Equipment Co., Santa Barbara, CA). This electrical resistance block consists of two electrodes imbedded in gypsum. The instrument gives a relative reading between 0 (dry block) and 94 to 96 (saturated block). This sensor was recently discontinued.
-
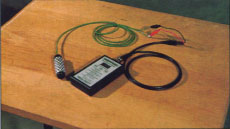
EM-38 electromagnetic conductivity meter (Geonics Limited, Ontario, Canada). This device contains two electrical coils inside a plastic casing about 40 inches long. The instrument is placed on the ground surface, and energizing the primary coil causes an electromagnetic field to radiate into the soil. This creates a secondary electromagnetic field, the strength of which is related to the electrical conductance of the soil and is measured by the secondary coil. This device can be operated in the vertical mode (device is upright) or the horizontal mode (device is flat on the ground). The instrument is more sensitive to near surface conditions in the horizontal mode. We evaluated this device because of its ease of operation and zone of influence of about 3 to 3.5 feet from the instrument. Research at UC Davis revealed that this device is sensitive to changes in soil moisture content but that its sensitivity also depends on soil salinity.
Using a neutron moisture meter (NMM) calibrated for each site, we measured soil moisture. The calibrations relate NMM readings to volumetric soil moisture contents. Separate calibrations were developed for the 6-inch depth and for the deeper depths. We used these moisture contents as the standard for evaluating the soil moisture sensors.
It might be preferable to use volumetric soil moisture contents from soil samples as the standard. However, soil sampling would disturb the soil in the immediate vicinity of the instruments, thus requiring their frequent removal and reinstallation. The frequency of readings and the number of devices made soil sampling impractical so we used the NMM method.
All instruments were installed along a transect about 6 feet long at each site with the NMM access tube centered along the transect. Measurements were made at 6, 12, 18 and 24 inches deep at all sites. Measurements were made twice per week during the duration of the study (1 to 2 months, depending on the site).
Neutron moisture meter
The NMM calibration curves relate volumetric water content, expressed in percent water, to count ratio, which is the ratio of the actual count to a standard count. Only one regression equation was used for Sandy Loam-PE and Loamy Sand-GR, because they were adjacent to each other, and it was not possible to find a range of soil moisture contents needed for a Loamy Sand-GR calibration curve. Coefficients of determination ranged between 0.67 for Silt Loam-CO and 0.83 for Sandy Loam-WAL (table 1).
Tensiometers
Tensiometers generally responded to changes in soil moisture, although no response occurred for the 12-inch depth at Sandy Loam-WAL (possibly because of a leaking instrument), and at times the tensiometers read zero at Silty Clay-WB (fig. 1). At Loamy Sand-GR, poor response (not shown) occurred to changes in soil moisture content except at the 6-inch depth, where soil texture was sandy loam. At Silt Loam-CO (not shown), the tensiometers did not respond for the 6- and 12-inch depths.
Possible causes of poor responses include the following:
-
There may have been poor hydraulic contact between the porous cup and the loamy sand at Loamy Sand-GR.
-
Leaks caused by a poor seal or a cracked porous cup may have prevented any response at Sandy Loam-WAL (12 inches).
-
Excessive drying may have caused problems at Silt Loam-CO and Loamy Sand-GR. Although the tensiometers were periodically maintained, lack of an irrigation immediately following maintenance could desaturate the porous cup and prevent a response to subsequent irrigations.
Correlation coefficients between tensiometer readings and NMM moisture contents were negative because tensiometer readings increased as soil moisture content decreased. These coefficients varied considerably for all sites. Excluding data where tensiometers failed to respond, correlation coefficients ranged between -0.30 and -0.99. We found no particular trend with soil texture. The average correlation coefficient was -0.62 and the standard deviation was 0.26.
Watermark blocks
The Watermark block readings behaved similarly to tensiometer readings except that they responded in drier soil. These blocks were more reliable than the tensiometers. Good response of blocks to changes in soil moisture content occurred at Sandy Loam-WAL and Silty Clay-WB, with block readings exceeding 100 centibars (fig. 2). The sensors were relatively unresponsive to changes in soil moisture at Loamy Sand-GR for all depths except 6 inches. As with the tensiometers, poor hydraulic contact apparently occurred between the loamy sand and the sensors.
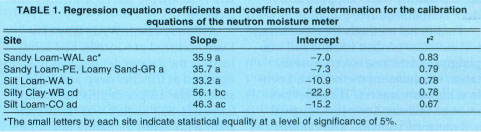
TABLE 1 Regression equation coefficients and coefficients of determination for the calibration equations of the neutron moisture meter
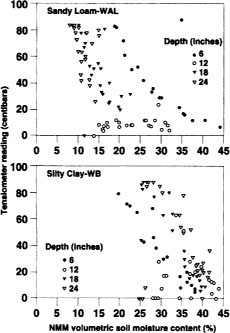
Fig. 1 Tensiometer readings versus neutron moisture meter (NMM) soil moisture contents for two locations.
Correlation coefficients between Watermark readings and soil moisture contents generally were higher compared with the tensiometers. With the exception of Loamy Sand-GR, coefficients generally exceeded -0.80. The average correlation coefficient (excluding Loamy Sand-GR) was -0.87 and the standard deviation was 0.13.
Because these sensors are designed to read like a tensiometer, differences between Watermark readings and tensiometer readings were compared up to a maximum of 90 centibars. Tensiometer readings of zero were eliminated in this analysis. Sixty-six percent of the tensiometer readings were larger than Watermark readings. We observed no trend in differences between the two sensors with decreasing soil moisture content. Possible factors contributing to these differences include a lag in the response of the Watermark block to changes in soil moisture content, small-scale spatial variability in soil texture and infiltrated water between instrument locations, and differences in the response characteristics among a given set of instruments.

Soil texture at these sites was relatively constant with depth except at Silty Clay-WB. In a separate study in Northern California, however, possible effects of differences in soil texture were found (fig. 3A). There was little variability in soil texture with depth, and thus a consistent relationship between soil moisture contents and block readings occurred with depth. In contrast, however, soil texture (fig. 3B) varied considerably with depth, resulting in highly variable responses of block readings to changes in soil moisture contents. This behavior shows that devices that measure soil moisture tension must be calibrated for each soil type if they are to be used to measure soil moisture content.
Gypsum blocks
Gypsum block readings remained between 90 and 100 at high moisture contents until some threshold content was reached (fig. 4). For soil moisture contents less than the threshold value, readings decreased rapidly with decreasing soil water content to a minimum value of less than 10. As with the other devices, only the blocks at 6 inches deep responded to changes in soil moisture content at Loamy Sand-GR.

Fig. 3 The effect of soil texture on Watermark block readings for a soil profile with a uniform texture (A) and a soil profile with a nonuniform texture (B).
Threshold values depended on soil texture. These values ranged between 5% and 10% for Loamy Sand-GR, between 15% and 20% for Sandy Loam-WAL, between 20% and 25% for Sandy Loam-PE and Silt Loam-WA, and between 30% to 35% and 40% for Silty Clay-WB and Silt Loam-CO.
For moisture contents less than the threshold value, block readings generally changed by 8 units for each 1% change in soil water content. This behavior was independent of soil texture. A decrease in soil moisture content of about 10% generally caused the readings to decrease from the maximum values to the minimum values.
Correlation coefficients between block readings and soil moisture contents were positive because block readings increased with increasing soil moisture content. Coefficients ranged from 0.34 to 0.96 (excluding Loamy Sand-GR). The average coefficient was 0.78, and its standard deviation was 0.17.
Electromagnetic conductivity
We compared EM-38 readings with the average soil moisture content over a 3.5-foot depth interval, estimated from manufacturer's literature to be about the depth of penetration of the instrument. Little or no change in EM-38 readings occurred with soil moisture content at Sandy Loam-WAL (fig. 5), Sandy Loam-PE and Loamy Sand-GR where nonsaline soils existed. This response was due to very low levels of soil salinity, the result of using irrigation water with an electrical conductivity less than 0.1 dS/m.
Watermark block
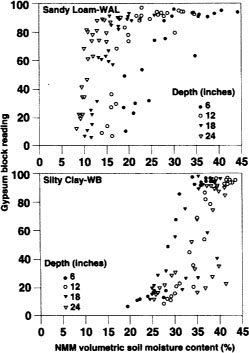
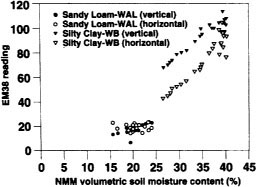
Fig. 5 EM-38 readings versus NMM soil moisture content for horizontal and vertical modes at two locations.
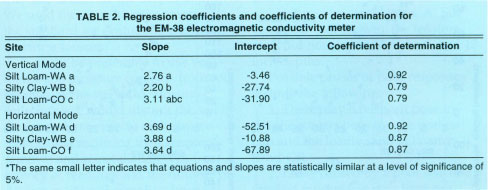
TABLE 2 Regression coefficients and coefficients of determination for the EM-38 electromagnetic conductivity meter
At the other sites, EM-38 readings decreased substantially as soil moisture content decreased (fig. 5). Differences occurred between the horizontal and vertical modes except at Silt Loam-WA. The electrical conductivity of the irrigation water used at these sites generally was greater than about 0.5 dS/m.
Correlation coefficients between EM-38 readings and soil moisture contents were greater than 0.89 at Silt Loam-WA, Silty Clay-WB and Silt Loam-CO, while at Sandy Loam-WAL and Loamy Sand-GR, correlation coefficients were less than 0.17. Coefficients for Sandy Loam-PE ranged from 0.64 to 0.75 for the vertical and horizontal modes, respectively.
A statistical analysis of the coefficients of the regression equations for both vertical and horizontal modes for Silt Loam-WA, Silty Clay-WB and Silt Loam-CO showed that the equations were not all statistically equal for the vertical mode (table 2). For the horizontal mode, the slopes for all sites were statistically equal. This slope similarity suggests that the EM-38 could be used to monitor changes in soil moisture between irrigations for these soil types and salinity levels.
Tools have different strengths
Tensiometers, Watermark blocks, and gypsum blocks provide a measure of soil moisture tension. They are easy to install, operate and maintain, and are relatively inexpensive. They are appropriate for determining when to irrigate, but calibration is needed to estimate actual soil moisture contents from their readings. Watermark block readings tended to lag the tensiometer readings, but they were more reliable than tensiometers and responded over a much larger range of soil moisture contents. This characteristic of the Watermark blocks makes them particularly appropriate for irrigation scheduling.
The gypsum blocks also responded over a wide range of soil moisture contents, but little response occurred until a threshold content was reached.
The EM-38 responded poorly where little soil salinity occurs. Where some soil salinity occurs, linear relationships between EM-38 readings and soil moisture contents were found. This suggests that this device might be able to reasonably estimate changes in soil moisture content, but field calibration will be needed to correlate changes in EM-38 readings with changes in soil moisture contents. At the sites used for this instrument, EM-38 readings changed an average of 3.74 units (horizontal mode) for each 1% change in soil moisture content. The main advantage of this device is its relatively large volume of measurement. Its disadvantage is its cost - at least $7,000, depending on configuration.
Detailed discussions concerning installation and use of tensiometers and electrical resistance blocks is contained in Hanson et al. 1999.
Effectiveness of tensiometers and electrical resistance sensors varies with soil conditions

