


All Issues
Grading error reduces grower incentives to increase prune quality
Publication Information
California Agriculture 54(6):66-71. https://doi.org/10.3733/ca.v054n06p66
Published November 01, 2000
PDF | Citation | Permissions
Abstract
Grading is important to ensure the production of high-quality foods, but it is usually done with error, distorting market signals and diminishing incentives to produce high-quality products. Size is the main quality criterion for dried prunes and the crucial characteristic in determining prune value. We studied the economic effects of errors in commodity grading, focusing in particular on the implications of one-way (asymmetric) grading errors, namely when small, low-quality product is erroneously classified as high quality, but not vice versa. In an application to the California prune industry, we estimated the extent to which large prunes are undervalued and small prunes are overvalued. We conclude that grading error means that prunes graded as high-quality may not really be high-quality prunes. The presence of these incorrectly graded prunes depresses the prices that growers are paid for high-quality prunes and increases the net returns for small prunes. As a result, growers face reduced incentives to produce larger prunes.
Full text
Food demand in the United States is relatively stable. As people's incomes rise, they do not consume more food, but they eat better, higher-quality foods. The quality dimension of the U.S. food industry has become increasingly important, especially in fruit and vegetable markets where California is the dominant producing state. The most successful growers and marketers consistently provide high-quality products to consumers.
Grading of farm commodities is one way to encourage production of high-quality products. To improve the incentives to growers of large prunes, the prune industry adopted payments based upon five grades in 1996. Before then, growers received one price for their entire crop, based on the average prune size in the sample.
If products of various quality are commingled and receive a common price based on average quality, it discourages growers from adopting the costly production practices necessary to produce the larger fruit that is highly valued in the marketplace. However, if the commodity is graded, price premiums and discounts associated with grades provide incentives for market participants to alter quality in ways that consumers desire.
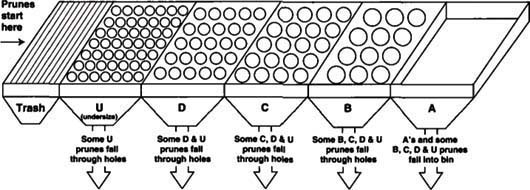
Unfortunately, grading is rarely done perfectly. Grading errors can emerge both because of sampling errors and from imperfect testing. We investigated the one-way grading error caused by imperfect testing, wherein low-quality product can receive a high-quality rating, but the converse cannot occur. This type of asymmetric error is the norm for size-based grading methods. For example, in systems used to grade or sort fruit, vegetables, nuts or grain by size, the product is conveyed across screens or cylinders with holes of increasing size or via diverging belts or rollers. Small product can fail to fall into the correct category, moving instead to a category intended for larger product, but large product cannot fall through screen holes intended to capture the smaller product.
We apply the analysis to the California prune industry, where prunes are graded by size into one of five categories. Figure 1 is a schematic of the grader used for California prunes. As the figure suggests, small prunes may not fall into their designated category and may instead travel into categories reserved for larger prunes, but large prunes cannot fall into categories designated for smaller product. Therefore, a portion of lower-quality prunes receives a higher-quality ranking and a higher price, but the reverse cannot occur. We examined the effect of this grading error on prices that growers receive and on the incentives to adopt cultural practices leading to increased prune size.
A model of errors in grading
We developed a theoretical model to study the effects of grading error on the price of a farm product that is sorted and graded based on a single quality characteristic, size, in which the grading system is characterized by one-way measurement errors. One outcome of this type of error is that the measured quantity of products in each grade is not the actual quantity of the product meeting the grade standard.

About 6 weeks after bloom, prune growers can shake some of the fruit off the trees so the remaining prunes will grow larger.
We discuss the model in the context of the five grades, A, B, C, D and U (undersize) now used for prunes (fig. 1). Prunes receiving the A grade will consist of actual grade A prunes, as well as some lower-grade prunes that end up in grade A. However, prunes truly of grade A size cannot tumble through a smaller screen, so all true A prunes are graded correctly. Prunes measured in grade B consist of true grade B prunes plus smaller prunes that failed to fall through their designated screen. A similar story applies to grades C and D. The U or undersize grade will consist entirely of U prunes because it is the lowest grade, and larger prunes cannot fit through the holes in the U screen.
We define Vi as the farm price that would emerge for prunes of grade i = A, B, C, D, U in the absence of any grading error, and refer to Vi as the “value” of prunes correctly classified into grade i. Vi is the processing sector's willingness to pay per unit for correctly graded prunes of grade i The actual price, Pi paid to growers for all grades except the lowest will be discounted, relative to the true value Vi' because prunes measured as grade i are “contaminated” by prunes from the lower grades.
Because the lowest grade of prunes cannot be contaminated, the grower price for the lowest grade is equal to its true market value. This means that Pu =u. However, prunes measured as grade D consist of commodity from both grade D and grade U, because some U prunes will fail to fall through the U screen and instead fall through the D screen, thereby masquerading as D prunes. It can safely be assumed that packers are aware of these grading errors, since they typically re-sort prunes, after payments to growers are determined, into more finely separated size categories. The presence of undersized prunes should therefore affect packers' willingness to pay growers for grade D prunes. Packers and growers negotiate prices for each grade once a year, and there is no adjustment in prices to individual growers after delivery, based on the number of misgraded prunes. As a result, the price paid to growers for grade D must represent a weighted average of the true market values of grade D and grade U prunes, with the weights corresponding to the relative quantities of actual grade D and grade U prunes that are classified as grade D.
Weighted-average pricing
The more accurate the grading process, the lower the probability of a prune in the D screen being of size U and therefore, the smaller will be the discount (VD - PD) for grade D. The grower prices for grades C, B and A are similarly weighted averages of the true market values of the prunes that end up in those measured grades. The grower price for grade C will be a weighted average of the true values for C, D and U prunes, and so on, for prunes measured in grades B and A.
We wished to ascertain the reduction in prices (the difference between the actual value, Vi, and the grower price, Pi) for each grade due to mistakes in grading. In an expanded version of this paper (Chalfant et al. 1999), we show that if buyers and sellers have complete information about the true distribution of prunes among the five size categories, and also the probabilities of grading errors, then there is a simple linear relationship linking the Pi's and Vis. For prunes, we observe the Pi's(the prices actually paid), and from them we can infer the Vi's (the underlying true values) and, therefore, the extent to which grading error depresses market prices.
The price discount for grade i is determined jointly by: (a) the extent to which prunes from lower grades are erroneously measured as grade i and (b) the difference in value between true grade i prunes and prunes of lower grades. For example, the grower price of grade B is discounted based on the relative amounts of grade C, D and U prunes that receive a grade of B and the differences in value between grade B and those lower grades. The more prevalent are the lower-grade prunes among those graded as B, and the lower the true value of these prunes relative to grade B's true value, the lower is the market price for grade B.
Discounts not the whole story
These price discounts do not tell the entire story. Because the price a grower receives for prunes measured in grade i is a weighted average of the market value, Vi, of true grade i prunes and the market values of lower-grade prunes that are classified incorrectly as grade i, the grower is paid less than market value for the portion of production that is graded correctly tor all grades except the lowest. However, the grower is paid more than market value for prunes that truly meet a lower grade standard, but end up in a higher grade.
How do these effects play out on balance? We define Ri as the per-unit revenue that a grower receives for prunes that truly are of grade i, for i = A, B, C, D and U. The extent to which per-unit revenue deviates from true market value reflects the degree of undervaluation (Ri < Vi) or overvaluation (Ri > Vi). First, for prunes that are truly of the lowest grade U, Ru. is higher than the actual value of the prunes, Vu' because some U prunes end up being measured and paid as grades D, C, B and A. Second, prunes of the highest grade, A, always earn less than their value, because all grade A prunes receive PA' which is discounted relative to VA because of the presence of lowergraded prunes that are misclassified as grade A. Thus,R A = PA<VA.
Offsetting effects on perunit revenue are present, however, for prunes of the intermediate grades B, C and D. Take prunes that are truly of grade C, for example. There is a gain in revenue obtained from producing C's when grade C prunes migrate into grades A and B, because PA > Pc and PB > Pc However, there is a loss in revenue for C prunes that are graded correctly because of the price discount discussed previously (Pc < Vc), due to the presence of D and U prunes in grade C. This second effect will likely be more important for the higher-quality intermediate grades, such as grade B, because that grade can be contaminated by prunes from grades C, D and U, whereas there is only one higher grade for B prunes to migrate into. Thus, the higher the intermediate grade, the more likely that prunes of that grade will be undervalued.
Growers will respond to the perunit revenue they receive for prunes of each grade, not their underlying “true” values. Thus, the tendency to overvalue small prunes and undervalue large prunes distorts grower incentives in favor of producing smaller prunes. There will be less investment in improving quality than when no price distortions exist.
Empirical analysis
California produces nearly all U.S. prunes and about 70% of the world's supply. The harvesting of prunes occurs from mid-August to mid-September, using a mechanical shaker attached to the tree trunk. Next, prunes are dried, cured and aerated for about 30 days. Then, the fruit is delivered to a packer's warehouse. Packers process the dried prunes by rehydrating, grading, sizing, packaging and reinspecting to meet trade specifications. Size is the main quality criterion for dried prunes and the crucial characteristic in determining prune value. The largest prunes are sold in gourmet retail packs at a premium price. Moderately large prunes can be pitted and sold as pitted prunes, while the smallest prunes are useful only for juice, paste and other industrial products, and sell for a lower price per pound.
Prunes in California are marketed under both a federal and a state marketing order. The federal marketing order authorizes the industry to regulate and set standards for the prune grading system, with the Dried Fruit Association (DFA) of California as the inspection agent. Packers maintain their own graders, and can set screen lengths and sizes to suit their own needs. However, official grading for purposes of determining payments to growers is done using a five-screen grader. Packers take 40-pound samples, one from each grower's shipment, to a DFA grading facility in Yuba City. Prices paid for each shipment are based on the quantities of prunes that fall into the five size categories. Payments to growers are not adjusted based on further sorting that may be conducted later by packers.
Each screen size on the grader consists of three screens that measure 2 square feet. Prunes that are smaller than the diameter of the screen openings may fall through the holes and be classified accordingly. The first screen is designed to eliminate trash, while the next four screens are for prune sizing (fig. 1). Before 1998, the U, D, C and B screens had 23/32, 24/32, 26/32, and 30/32-inch diameter holes, respectively. Prunes in the A category or “overs” do not fall through any screen and therefore go over the end of the grader. Results from the grading process are summarized for each sample on a grade sheet prepared by the DFA.
Oversupply of small prunes
Industry participants often complain of an “oversupply” of small prunes. Prune size can be enhanced through cultural practices, such as pruning, shaker thinning and delaying harvest. Field sizing, using a screen to remove the smallest prunes from the shipment before it is graded, can also be used to eliminate the smallest prunes and to avoid incurring the cost of handling them. Growers have been encouraged to adopt these practices, with limited success to date.
Before 1996, growers received one price for their entire crop, based on the average prune size in the sample. The adoption in 1996 of payments based upon the grading system described here was an attempt to provide more incentives to growers to increase prune size. A separate price is negotiated for the A, B, C and D grades, with the U grade valued at zero. Growers' payments are based on these prices and the percentages of their DFA-graded sample that register in each of the five grades.
Despite this change in pricing, the problem of small prune oversupply persists. In early 1998, the USDA approved an increase to 24/32 inch for the U screen as a way to remove more small prunes from the salable market. In addition, the sizes of the holes in the D and C screens were raised to 26/ 32 and 28/32 inches, respectively. Although these actions may help address the imbalance in production, they do not address the incentive problems caused by grading error.
We evaluated the impact of grading errors for the 1996 crop year. Specifically, for each grade, we sought to estimate the difference between the price received by growers and the true market value (Pi - Vi), and the average farm revenue and the actual value (Ri - Vi). The Pi's are the outcome of negotiations between packers and the Prune Bargaining Asscciation (PBA) and are known and fixed for the season. To estimate Vi and Ri, we needed information on the magnitude of grading error. For this purpose, we used detailed information for two 40-pound samples of prunes collected by the PBA from a variety of Sacramento Valley sites, and conforming closely in size distribution to the overall harvest.
After each PBA sample was graded on the DFA grader, the weight of each individual prune was recorded as the number of prunes of that weight needed to comprise a pound (i.e., the smaller the number per pound, the larger the prune). For each prune in the PBA samples, we knew which screen it fell through and its actual size. The measured and actual size distributions were thus known for both 40-pound samples. Actual prune size was expressed in terms of weight, because the industry delineates actual grades based on prune weight, even though prunes are graded by size. (Given the irregular shape of a typical prune, it would be almost impossible to measure its size to determine if, in principle, it would have fit through a smaller screen than it actually fell through.)
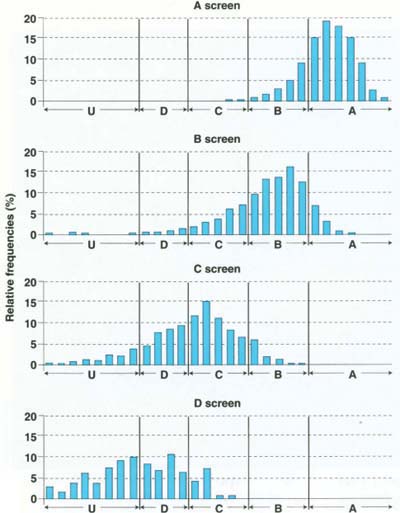
For the first sample, each panel in figure 2 shows the size distribution of prunes falling through a given screen, while the dividing lines indicate the break points between grades. Figure 2 suggests that some prunes received a grade that was lower than what they apparently deserved, based on their weight. For example, a prune's shape may be such that it falls through the B screen but weighs enough to be considered grade A. This appearance of “undergrading” is merely a consequence of the DFA screens being based on size (inches in diameter), whereas the break points that the industry uses to classify grades (and that we used to assign a true grade) are based on weight (the number of prunes per pound).
In the empirical work described below, we treat undergraded prunes as though they actually belong to the lower grade. However, we also repeated the analysis allowing for undergrading. and the results were similar to these reported here (results available from the authors).
Grade sheets for 1996 study
We also obtained the actual grade sheets completed for all 1,487 samples graded by the DFA in 1996. Each grade sheet reports the total weight and the average prune size in each of the measured grades A, B, C, D and U, based on the 40-pound sample taken from each shipment after drying. We used the detailed information from our two 40-pound PBA samples to infer the size distributions for each of the actual shipments. Based on analysis of the PBA sample data, it was reasonable to model the size distributions for the prunes within each measured grade using the Gamma probability distribution. In contrast to the familiar Normal distribution (the bell-shaped curve), the Gamma distribution allows for asymmetry around the mean in the distribution of prune sizes — a characteristic that was apparent from our analysis of the PBA samples (fig. 2). We estimated a unique Gamma distribution for each measured grade in each of the 1,487 shipments.
For each shipment, we had a set of estimated probability distributions (one for each grade) describing the size distribution of individual prunes in each measured grade. By evaluating the estimated distribution at the break points between actual grades, we were able to estimate the proportions of prunes of an actual grade that were measured in each of the five grades (tables 1 and 2).
Table 1 contains the proportion of prunes measured in each grade based on the DFA grader and our estimate of the true proportions in each grade for the entire 1996 crop. Differences between the actual and measured proportions are readily apparent, but the degree of measurement error is further clarified in table 2. Each row of table 2 refers to the actual prune grade, and each column refers to the measured prune grade. Individual cells in the table contain the proportions of each row grade that received the grade given by the corresponding column grade. The rightmost entries in each row thus represent proportions of correctly graded prunes. Every other entry represents a percentage of prunes of each actual grade migrating to higher grades.
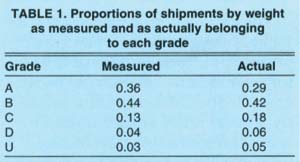
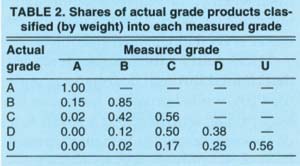
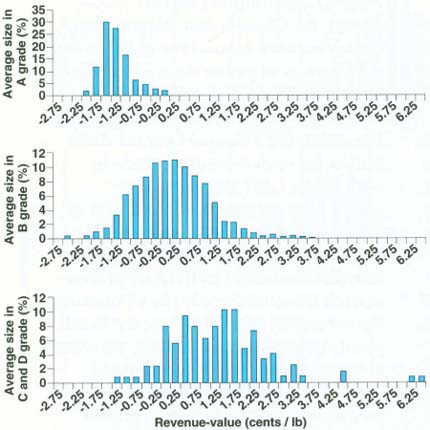
Table 2 shows that the probability of grading errors is greatest in the lower grades. This result is not surprising, because prunes in these grades have the greatest opportunity to migrate into higher grades. All A-quality prunes were graded correctly by construction of the grading process, and 85% of B-quality prunes were graded correctly, with the remaining 15% masquerading as A-quality prunes. However, only 56% of C-quality prunes were graded correctly, with 42% masquerading as B prunes. Only 38% of true D-quality prunes were graded as D, with 50% and 12% migrating into the C and B screens, respectively.
Grower revenues
The information contained in tables 1 and 2, along with the actual grower prices, Pi, for each grade, enable us to solve for the true values, Vi, of each grade. In the California prune industry, grower prices are determined by one of two mechanisms, depending upon whether the grower sells through Sunsweet Growers, a cooperative, or one of several independent handlers.
Prices paid by the independents are determined through negotiations with the PBA, while Sunsweet maintains its own pricing schedule. Our analysis focuses solely on the PBA prices, although our results apply broadly to Sunsweet because Sunsweet prunes are also graded by the DFA and, hence, are subject to the grading errors described here.
PBA grower price (Pi), actual value (Vi), and average grower revenue (Ri) for each grade are presented in columns 2, 3 and 4 of table 3. The difference between grower prices and actual values for each grade, Pi - Vi, indicates the extent to which grower prices were discounted because of grading error, and these differences are listed in column 5 of table 3.
For all grades except the lowest, U, the grower price is lower than the actual value. The price of grade A prunes is lower than its true value by 2.28 cents/lb., or by 4%, while B-grade prunes are undervalued by 3.43 cents/lb., or 7.7%.The difference between the average grower revenue and the actual value of prunes in each grade is shown in the last column of table 3. Since A-grade prunes cannot masquerade as any other grade, their average grower revenue equals their price, and the difference is 2.28 cents/lb.
The average grower revenue received for undersized prunes is higher (by over 6 cents/lb.) than the actual value of zero. The average grower revenue is lower than the actual value for grade B (by 3.4%), but higher for grades C and D (by 16.7% and 73.2%, respectively). The negative spread for grade B indicates, for example, that the decrease in average grower revenue for grade B prunes associated with the migration of lower grades into grade B more than offsets the gain in revenue associated with some of the B prunes being classified as grade A. As predicted, the opposite effect dominates for the lower grades, exacerbating the incentive problem.
We investigated the effects of grading error on the distribution of income among growers. Differences across growers were hypothesized to cause some growers (those with a higher share of correctly graded prunes in grade A, for instance) to lose revenue due to grading error, while others (for example, those with a preponderance of smaller prunes that could move up in grade) would gain. We calculated a measure of the revenue-value “spread” for every shipment, defined as the difference between the revenue per unit received by the grower and the actual value per unit of the shipment, averaged across all grades. A negative number for the spread represents value not captured by the grower, an undervaluation, whereas a positive spread indicates grower revenue exceeded the shipment's true value, an overvaluation. These revenue value spreads varied between -2.5 cents/lb. and 6.5 cents/lb. for the 1,487 shipments in 1996.
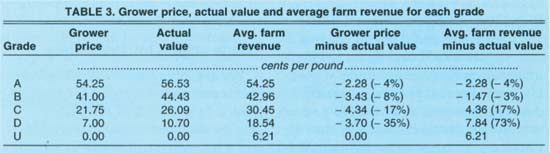

The 1,487 shipments were divided into three groups according to the average prune size of the shipment. The distribution of revenue-value spreads for the first group of shipments — those with average sizes in the grade A range — is shown in the first panel of figure 3. These shipments were never overvalued, and were almost always undervalued. The second panel in figure 3 shows that the distribution of spreads for shipments whose average prune size was in grade B is roughly centered at zero, meaning about half of these shipments were overvalued and half undervalued. The third panel in figure 3 shows the distribution of spreads for shipments whose average sizes were in grades C or D. Only 7% of these shipments were undervalued, with about 80% of the shipments generating revenue in excess of their actual value. These figures provide further evidence that growers who produce relatively small prunes gain at the expense of growers of large prunes.
Further support for this conclusion was provided by a regression analysis, which generated a positive and statistically significant relationship between the average prune size in the shipment (expressed as the number of prunes needed to make a pound) and the price spread. We were able to explain 50% of the variation in revenue-value spreads across shipments based solely upon average prune size in the shipment.
Importance of grading errors
How important are these errors in influencing growers' production practices, such as shaker thinning, to increase prune size? To explore this question, we evaluated the return to shaker thinning, based on 1996 prices, under current grading practices and a hypothetical regime of no grading error. We obtained data on shaker thinning from a trial conducted by the PBA, where a representative orchard was chosen and one row was mechanically thinned, and a sample from the eventual harvest was graded on the DFA grader. An adjacent row was treated as a control and a sample from its unthinned harvest was also submitted to the DFA grader. The measured size distribution from the thinned and unthinned rows are reported in table 4, as are the estimated actual distribution for each row, which we derived using the estimated Gamma distributions.
Information regarding revenues and costs under each scenario is summarized in table 4. Although shaker thinning improves the size distribution of the harvest, it also reduces yield, as shown. Total revenue was calculated using actual PBA prices, Pi, for the current grading system and the actual values, Vi, for the hypothetical regime with no grading error. Considering both the cost and revenue effects, the shaker-thinned crop yielded $365 more net profit per acre than the unthinned crop, given current grading practices. The return to shaker thinning under no grading error was estimated to be $499 per acre, an increase of 34% over the return with grading error. We conclude that eliminating or reducing grading error would increase growers' incentives to shaker-thin their orchards.
In summary, our results show that grading error causes large prunes to be undervalued relative to small prunes, and growers who produce relatively large prunes to subsidize those who produce relatively small ones. These findings are consistent with the pattern of “oversupply” of small prunes in recent years.
They also illustrate that continuing to produce relatively greater numbers of small prunes, rather than, for example, shaker thinning to produce larger prunes, may well be a rational response to current incentives.
Adding screens and premiums
The industry can partially address the problem of oversupply of small prunes by improving the accuracy of the grading process. Examples include increasing screen length or adding additional screens on the DFA grader.
Alternatively, the industry might consider a graduated payment system that offers premiums and discounts based on average prune size within each measured grade, rather than a single price per grade, as is the current practice. For example, Sunsweet Growers use a pricing schedule with many pricing gradations (15 for the 1997 crop) based on a measured size count of the delivery.
As an incentive to improve the overall quality of the prune supply, growers are paid a premium for larger prunes. Prunes are graded by size. Grade A prunes, the largest, are considered the highest quality.
Although measured size counts will be subject to error and large prunes will, accordingly, be undervalued by Sunsweet, the use of this many pricing gradations (in contrast to five in the PBA schedule) helps to minimize the impact of grading error for Sunsweet.
Grading error reduces grower incentives to increase prune quality

