


All Issues
Sampling program for grape mealybugs improves pest management
Publication Information
California Agriculture 55(3):19-27. https://doi.org/10.3733/ca.v055n03p19
Published May 01, 2001
PDF | Citation | Permissions
Abstract
The results of a mealybug study in Central Valley vineyards, designed to develop sampling guidelines, reveal that mealybug distribution on vines varies greatly through the season and that mealybugs usually prefer concealed locations, such as under bark. This combination makes sampling difficult. A number of sampling techniques were compared. Three- or 5-minute timed counts were most efficient because samplers could follow the mealybugs' movement over the season. Midseason counts were much better predictors of damage at harvest than early season counts. This research confirms past control guidelines and opens new control options. Grape bunches touching vine trunks or spurs will have higher damage. Removing these bunches or using barriers between bunches and mealybug oviposition sites can also reduce damage.
Full text
Among table grape growers in San Joaquin Valley, the grape mealybug (Pseudococcus maritimus) has a reputation for guerilla tactics. The pest is almost invisible for much of the season, hiding in cracks and crevices under the bark, but by harvest it emerges in surprising numbers into the grape bunches (Flaherty et al. 1992; Geiger and Daane 2001). Accumulations of mealybug excrement (honeydew), egg cases and waxy exudate in the bunches can cause cosmetic damage that can be especially costly to table grape growers.
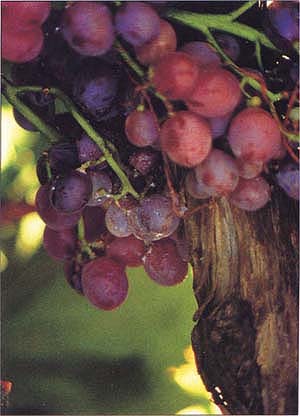
Mealybug damage to grape bunches is primarily cosmetic, but can result in significant economic losses, especially to table grape growers. To limit damage, grape bunches should not touch vine stems.
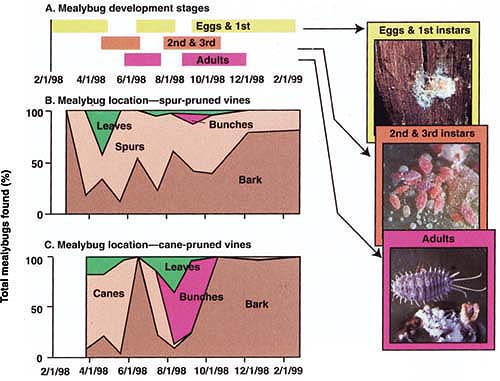
Fig. 1. Location and numbers of P. maritimus on grapevines over a year, San Joaquin Valley: (A) Predominant mealybug life stages; (B) Location of mealybugs on spur-pruned vines, represented as a percentage of total mealybugs found; (C) Location of mealybugs on cane-pruned vines. Note that spur-pruned vines have approximately twice as much bark as cane-pruned, and generally harbor higher mealybug populations.
Its sporadic occurrence and importance as a primary vineyard pest have been noted since the early 20th century. In the 1990s, mealybug outbreaks became more frequent and severe. In 1997 and 1999, mealybugs were ranked in grower surveys by the California Table Grape Commission as the most important pest problem for California table grapes.
The change for the worse in the grape mealybug's pest status may be due to changes in cultural practices, insecticides, natural enemies or weather patterns. Whatever the cause, its sporadic occurrence, through the years and among vineyards, complicates control programs because there are no accepted monitoring guidelines to help predict damage. This, coupled with consumers' low tolerance for infested grape bunches, causes many growers to rely on insecticide applications at the first sign of mealybug damage. Not long ago, this meant dormant and/or in-season applications of highly toxic organophosphate (OP) insecticides. With the onset of stricter regulation of these products, the predominant program is now a dormant (late February to early March) application of chlorpyrifos (Lorsban), sometimes combined with in-season applications of methomyl (Lannate), dimethoate (Cygon), phosmet (Imidan) or imidacloprid (Admire).
There are obvious problems with reliance on preventative spraying. Insecticides can reduce beneficial insect and mite numbers and result in secondary pest outbreaks (Flaherty et al. 1992) and resistance will develop to some insecticides (Flaherty et al. 1982). In addition, mealybugs are not evenly distributed in the vineyard, which means that clean vines are treated along with infested vines, resulting in unnecessarily high applications of insecticide. A better program would rely on tested sampling protocols, using action thresholds and an understanding of pest biology. For proper samples, growers need to know when and where to look for mealybugs, and how to interpret the counts. We present a month-by-month map of mealybug movement on a grapevine, a comparison of grape mealybug sampling techniques and details on mealybug biology that may be helpful to growers.
Research methods
Mealybug seasonal abundance and distribution.
The first study was conducted at six commercial table grape vineyards: three in central San Joaquin Valley (Fresno and north Tulare counties) and three in southern San Joaquin Valley (Kern County). Because differences in pruning systems may influence mealybug density and distribution (Flaherty et al. 1992), both cane- and spur-pruned vineyards were selected. To measure absolute mealybug density and location, one grapevine was destructively sampled each month at each of six sites from March 1998 through February 1999. Absolute counts of mealybugs were derived after all bark, leaves, canes and grapes were removed from the vine and dissected for mealybugs and their natural enemies.
Comparison of relative sampling methods.
Absolute samples were compared to five relative sampling techniques, which were taken before the vines were destructively sampled The relative techniques were:

Sample methods around the spur/cane. Use a small screwdriver or other tool to gently remove bark around the spur. Go about 2 inches into the old wood and count all mealybugs and mealybug egg sacs. On cane-pruned vines, look for the first full internode of cane that has broken bark.
-
5-minute counts. Mealybugs were counted anywhere on the vine for 5 minutes by an experienced sampler.
-
Excised spur counts. Three spurs per vine were cut about 2 inches into the old wood, taken to the laboratory and placed on sticky cards. After 3 weeks the emerged crawlers were counted.
-
Nondestructive spur/cane counts. Mealybugs were counted for 1 minute on three spurs on each vine with no removal of bark. The same procedure was used on cane-pruned cultivars, using a single cane internode as the sample unit.
-
Sticky tape counts. Single pieces of double-sided tape were wrapped around the bases of five canes per vine. The tape was removed 7 days later and mealybug crawlers were counted.
-
Standard-sized bark strips. A strip of bark (approximately 2 inches by 12 inches) was removed from the upper trunk section and all large mealybugs, egg sacs (called ovisacs) and mummies were counted.
Mealybug distribution in the vineyard.
The pattern of mealybug infestation throughout the field determines where and how many samples should be taken. For example, when the pest population is clumped in a few locations, more samples are needed than when the pest is spread evenly throughout the block. In the second series of studies, we used 3-minute counts to sample every vine and to map mealybug infestations in a low- and high-density vineyard with 330 total vines. From this data, we calculated the number of samples required to accurately determine mealybug densities.
Economic damage estimates.
The ability to predict pest damage at harvest, based on earlier field counts, is a component of good control decisions. In the third series of studies, we sampled vines in early and mid-season and compared mealybug counts with damage at harvest on the same vines. In one economic-damage trial, conducted at a heavily infested Kern County vineyard, we conducted a timed search (2.5 minutes per spur) on four spurs per sampled vine. There were 16, 24 and 29 vines sampled in 1996, 1997 and 1998, respectively, with samples taken in mid- to late June. In the second economic-damage trial, we sampled more vines: 477 vines at three sites in March, 229 vines at three sites in mid-April, and 60 vines at two sites in late June. At each site, we spent less time per vine (1 minute per spur and three spurs per sample) than in the first trial. In both trials, damage was evaluated using these ratings: 0 indicates no sign of mealybug damage; 1 means the bunch is salvageable but has some honeydew; 2 indicates the bunch is partially salvageable; 3 means unsalvageable.

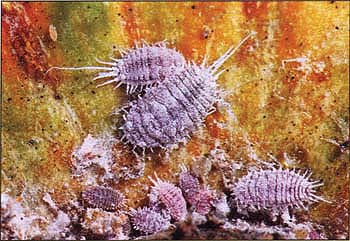
Mealybugs in the crawler stage are revealed underneath bark on a grapevine spur. Because mealybugs spend most of their time in hidden locations, often beneath bark, populations are difficult to quantify and only partially vulnerable to insecticide sprays.
Seasonal abundance, distribution
Results from absolute samples show that mealybug location on the vine changed repeatedly throughout the year (fig. 1), and was related to developmental stage. These results suggest that no single sampling unit, such as leaves, will reveal each grapevine's universe of mealybugs over the entire season. Mealybugs generally overwintered as eggs or first instars (the stage between moltings) underneath the bark on the trunk, canes or spurs, although second instars have also been observed overwintering (Flaherty et al. 1992). In March, when daytime temperatures were often higher than 70°F, crawlers moved from overwintering sites to locations on spurs or canes with loose bark. From bud break in March until about April, many mealybug first and second instars fed around the base of the new growth, usually beneath the bud scale or between leaf primordia (the earliest stage of leaf development). Mealybugs were most easily found by gently peeling back loose bark near the cane's base, or around pruning scars on spurs.
As new canes lengthened in April and May, the mealybugs (now second and third instars) dispersed through the bark, leaves, spurs and canes (fig. 1). During this period, mealybugs were difficult to find and accurately count. No mealybugs were found in fruit clusters during this first generation.
From early to mid-June, maturing third instar females retreated to protected locations beneath the bark on spurs, cordons or trunk. The females continued to feed and develop over the next 4 to 6 weeks, eventually producing ovisacs, from which second-generation crawlers emerged. The late (July-August) hatching period is critical because this is when the second-generation mealybugs first move into grape bunches. By late August, 10% to 30% of the mealybug population was found in bunches, with the majority settling either on the bunch rachis (main stem) or pedicel (flower-bearing stalk) (fig. 1). Bunches touching the trunk or spurs were more likely to be infested. In late August and September, some adult females began ovipositing (depositing eggs) in bunches, while others moved back under the bark to oviposit. By October, most mealybugs retreated beneath the bark to oviposit, and in December only eggs and crawlers remained (more than 50% of mealybugs overwintered as crawlers in 1999, compared to less than 20% in 1998).
In the 1998 absolute samples, spur-pruned cultivars had a higher percentage of mealybugs under the bark (fig. 1), which is not surprising because spur-pruned cultivars had about twice as much bark as cane-pruned cultivars. More bark means more hiding places for mealybugs, and spur-pruned cultivars always had significantly higher mealybug densities than cane-pruned cultivars. While mealybug abundance was higher on spur-pruned cultivars, there was no difference in average bunch infestation between spur- (11% ± 2.9) and cane-pruned (15% ± 5.7) cultivars.
Results indicate three periods when grape mealybugs can be most easily found on sampled vines: (1) on warm days near bud break, when first-instar crawlers can be seen massing on pruning scars; (2) from late June to early July, when first-generation mealybugs have matured and retreated beneath the bark of the cordon to begin spinning egg sacs; and (3) at harvest in late August and September, when second-generation mealybugs have matured in the bunches.
These findings suggest that it is essential to use controls that can reach mealybugs in their protected habitat. Grape mealybugs are most exposed when, as first or second instars, they emerge from beneath the bark to settle around new growth. Even during these periods, grape mealybugs prefer to hide beneath bud scales (the hard shell covering a bud) or under leaf stipules (small appendages at the base of leaf petioles), and are rarely completely exposed. Furthermore, while crawlers congregating on pruning scars in March may appear vulnerable, it is noteworthy that more mealybugs will continue to emerge from the bark for several more weeks. At all times, much of the mealybug population remains deep in cracks beneath bark on the trunk, spurs or canes. Even at their most exposed periods, the mealybug population is only partially vulnerable to chemical sprays. To be effective, insecticides must have either systemic or fuming action, while natural predators must be able to search effectively in concealed locations.
Mealybugs in California vineyards
Grape mealybug

Obscure mealybug
Five mealybug species are pests of California table, raisin and wine grapes. The great majority of mealybugs collected in San Joaquin Valley are the grape mealybug (Pseudococcus maritimus), while the closely related obscure (Pseudococcus affinis) and longtailed (Pseudococcus longispinus) mealybugs are more common in coastal vineyards. Two other mealybug species are relatively new pests to California: the vine mealybug (Planococcus ficus), found predominantly in Coachella Valley and in isolated fields of San Joaquin Valley, and the pink hibiscus mealybug (Maconellicoccus hirsutus), recently discovered in Coachella Valley. Because many of these mealybug species look outwardly similar, specimens should be preserved in alcohol and sent to experts for identification.
The grape mealybug, commonly found in San Joaquin Valley, is closely related to obscure and longtailed mealybugs, common to coastal vineyards. Longtailed mealybugs are easily distinguished by having a tail sometimes longer than the body. Grape and obscure mealybugs are very difficult to distinguish.
Grape and vine mealybug species currently cause the most economic damage, although pink hibiscus mealybug might be a serious pest if it becomes established here. The other species are generally sporadic or occasional pests.
—C.A.G. et al.

Pink hibiscus mealybug

Longtailed mealybug

Vine mealybug
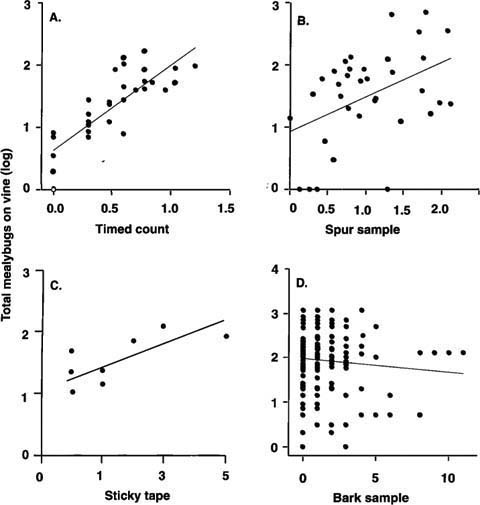
Fig. 2. Comparing the accuracy of various relative sampling methods (x-axis) for estimating total mealybugs per vine (y-axis): (A) 5-minute counts by experienced samplers compared to total mealybugs; (B) Crawlers emerging from excised spurs compared to total mealybugs; (C) Mealybug crawlers trapped on sticky tape barriers over 7 days compared to total mealybugs. March and April 1998 (capture by tape barriers in all other months showed no relationship to mealybug population); (D) Total mealybugs and ovisacs under standard-sized grape bark strips (2 inch by 12 inch) compared to total mealybugs.
Natural predators
Small, yellowish parasitic wasps (Acerophagus notativentris and Pseudaphycus angelicus) accounted for 98% of the parasitoids recovered. A. notativentris populations increased more quickly than P. angelicus in the spring, while P. angelicus were more common in autumn. Percentage parasitism was low in April (11.4% ± 3.5) and in June and July samples (17.8% ± 2.5), but increased in September (65% ± 8.4).
In some sampled vineyards, mealybug predators were more common than parasitoids. Larvae of a predaceous fly (or midge), Dicrodiplosis californica (Diptera: Cecidomyiidae), were observed consuming all stages of grape mealybugs. The reddish-orange larvae were usually found under bark, often in the mealybug ovisac, and even inside the carcasses of large mealybugs. One advantage of the midge as a predator is that it appeared to be undeterred by ants, which will defend mealybugs against many other natural enemies. However, the midges were found only on heavily infested vines. Two lady beetle genera (Hyperaspis and Scymnus spp.), two lacewing species (Chrysoperla comanche and Chrysopa nigricornis) and several common vineyard spiders were also observed preying on the grape mealybug (Costello and Daane 1999). The beetle larvae were commonly found beneath the bark and near mealybug egg sacs. Lacewings were rarely underneath the bark and were primarily observed on grape bunches around the harvest period.
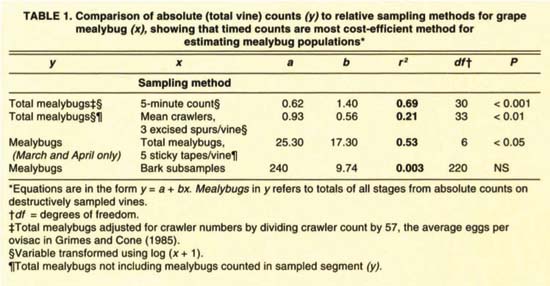
TABLE 1. Comparison of absolute (total vine) counts (y) to relative sampling methods for grape mealybug (x), showing that timed counts are most cost-efficient method for estimating mealybug populations*
In a study conducted by Clausen in the early 1920s, most mealybug control was attributed to high parasitism rates, ranging up to 80% (Clausen 1924). However, in our studies and others conducted in recent years there has been more variation in percentage parasitism, lower parasitism levels and fewer parasitoid species.
Another interesting change is that P. angelicus was one of the two dominant parasitoids in our study, however, it was not reported in Clausen's survey. While we cannot draw conclusions on the importance of these natural enemies for mealybug control, at the two sites most heavily infested in 1998 we observed extensive mortality and apparent population regulation in 1999 by the two parasitoids and the midge. One other site with heavy infestations in early spring had a high rate of A. notativentris parasitism at midseason, and very little (< 5%) damage at harvest.
Comparison of sampling methods
Comparisons between absolute counts and relative sampling methods reveal that a timed 5-minute count is the best way to predict mealybug densities (fig. 2A-D, table 1). For most purposes, 3-minute counts are probably good enough, since 3- and 5-minute counts were highly correlated (r2 = 0.90, P < 0.001). Further reducing the counting time to 1 minute per vine forfeited 39% of the predictive power. Timed counts performed best because samplers were not confined to a single sampling unit such as leaves. In other words, since mealybug location varies during the season, the sampling procedure must also vary. However, timed counts require an experienced sampler familiar with the visual cues that help locate mealybugs such as ants, honeydew and sooty mold. Mealybugs feed on phloem, and excrete unused plant sap (honeydew) onto grape leaves, canes and fruit — promoting sooty mold fungi.
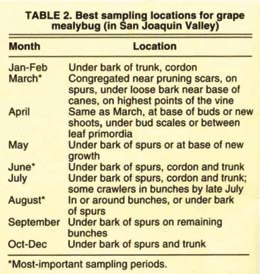
The other grower-oriented sampling techniques did not fare as well. Counts from excised spurs had a weakly significant relationship to total mealybugs (fig. 2B). However, this method may prove useful for estimating parasitoid activity, because adult parasitoids emerge and are trapped on the cards. The numbers of mealybugs trapped by sticky tape barriers showed no relationship to total mealybugs, except during March and April (fig. 2C). One advantage of sticky tape sampling is that it can pinpoint the beginning of crawler movement in spring. Bark subsamples showed no correlation to mealybug counts (fig. 2D) unless the entire upper trunk segment of bark was sampled (data not shown), which is impractical. Bark sub-samples may, however, be a convenient way to detect mealybug presence during the winter since bark pieces can easily be removed and the cottony mealybug egg sacs readily spotted. Table 2 summarizes the best mealybug sampling locations through the year.
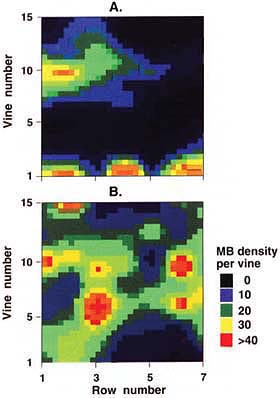
Fig. 3. Contour maps in the San Joaquin Valley of grape mealybug infestations in (A) low-density infestation and (B) medium-high density infestation. Clumping is higher in low-density infestations. Colors represent total mealybugs per vine, as estimated from 5-minute timed counts.
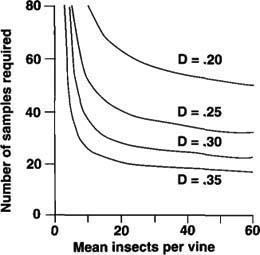
Fig. 4. Numbers of 5-minute samples (y-axis) required for a given confidence level D at various densities of P. maritimus (x-axis), $$alpha$$ = 0.05. Actual mealybug populations could be estimated with 95% probability (± 35% of the mean) if the sample size fails on the .35 line.
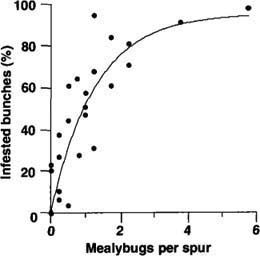
Fig. 5. Comparison of intensive (first trial) spur counts (2.5 minutes per spur, four spurs per sample) with percentage of bunches infested with grape mealybugs at harvest, Kern County 1998. r2 = 0.75, P < 0.001 (nonlinear regression), N = 24.
Windows of vulnerability
Our studies over 3 years reveal that grape mealybugs inhabit different parts of the vine during different periods of the year, and that the majority of mealybugs are in concealed locations. This information can be used to apply control measures when mealybugs are most vulnerable.
First, mealybugs were significantly more common and caused more damage in bunches that touch old wood (fig. 1). This finding could be applied as part of a cultural control program by preferentially thinning inner bunches.
Second, mealybug damage can be suppressed by simply blocking the movement of second-generation mealybugs from grape bunches. In cooperation with a Kern County grower, this option was tested in 1999 by hand-applying a sticky barrier, such as Stickum or OecoTac, to the base of every cane at early (February-March), late (late June-July), and both early and late periods. Mealybug densities at harvest were compared to controls (four treatments, three replicates, 25 vines per plot, 300 vines total). Results showed a significant decrease in mealybug damage on the vines receiving late barriers (fig. 2). While this labor-intensive method is not practical for most commercial growers, organic growers might experiment with the technique.
—C.A.G. et al.


Vineyard distribution of mealybugs
Data on mealybug distribution in the vineyard depict mealybugs clumped in patches in uneven distributions (fig. 3). Therefore, many samples are needed to obtain an accurate count (fig. 4). For example, in a block with moderate mealybug densities, approximately 20 of 100 to 150 vines must be sampled to obtain an estimate within 35% of the true population. Of course, sampling one-fifth of all vines in a vineyard is not economically feasible. For this reason, we suggest keeping detailed records of mealybug damage at harvest, and using this information to select borderline blocks that require more intensive monitoring. Harvest crews can be trained to spot mealybug infestations, and hot spots can be flagged or mapped to help pest managers in the following season. Simple presence/absence monitoring at bud break can locate other areas for intensive midseason sampling.
Economic damage estimates
Once the number of pests is known, the next question is: How much damage will they cause? This is not a simple question because parasitoids, predators, hot weather or rain can reduce mealybug populations between sampling and harvest. Predicting pest damage far in advance is risky, and any economic threshold is merely a rough guideline.
We measured the relationship between midseason counts and economic damage intensively on a small number of vines (first trial — 3 years, one vineyard) and extensively on a large number of vines (second trial — 1 year, two vineyards). The intensive studies showed above-average correlation to the percentage of bunches infested in all 3 years. In this trial, there were wide differences in initial mealybug abundance per vine because many vines were also used to test early spring applications of insecticides. We have shown results from the 1998 study only because the sampling schedule was most similar to the schedule followed in the second trial (fig. 5).
In the more realistic conditions of the second trial, there were good correlations between midseason counts and percentage of bunches lost (fig. 6A). When an average of 1 mealybug per spur was found in mid-June, 25% of the bunches on that vine were subsequently lost to mealybug damage, 45% of the harvested bunches were either lost or partially damaged, while 64% showed at least some sign of mealybug infestation (fig. 6B). The slopes of the regressions for spur- and cane-pruned vines were not significantly different (t-tests at P = 0.05), so we combined them for this analysis.
Results from the two trials were similar in most ways, although the intensive studies predict slightly lower infestation rates (51% rather than 64% infestation with 1 mealybug per spur). The studies were also similar in revealing many false negatives; that is, even vines with no mealybugs at midseason averaged almost 6% damage at harvest. This is partially a statistical problem, since our study fields were all known to be heavily infested areas, and crawlers could easily move from adjacent vines, or from protected locations on the same vine. From the grower's perspective, the importance of good record-keeping is again underscored, because it is critical to know which areas have a history of mealybug damage.
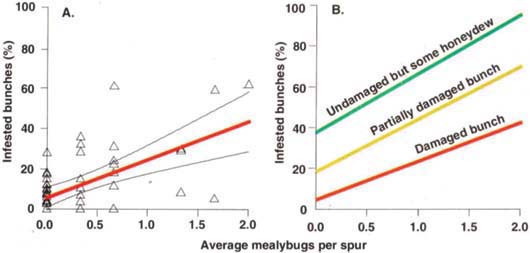
Fig. 6. (A) Percentage of bunches lost at harvest compared to average mealybugs counted per spur (1 minute per spur, three spurs per vine) in late June 1998, Kern County. (B) Summary of mealybug damage expected at harvest compared to average mealybugs counted per spur at midseason in late June 1998, Kern County. Red line in 6A corresponds to red line in 6B. Note: These data are from known infested blocks.
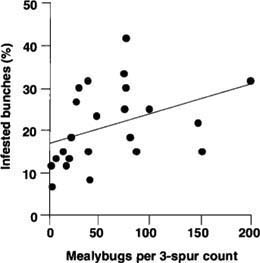
Fig. 7. Mealybug crawlers counted March 15, 1999, Kern County (three spurs per vine) compared to percentage of bunches infested at harvest (rating = 1,2 or 3) (each point represents three-vine sample or nine spurs). Early season counts were not reliable predictors of damage. This graph is the strongest relationship observed in three sites. Other sites were not statistically significant (r2 = 0.16, P = 0.06, N = 28). The slopes of the regressions for spur- and cane-pruned vines were not significantly different (t-tests at P = 0.05), so we combined them for this analysis.
While early season (March-April) mealybug counts are an easy way to detect the presence of mealybugs in a vineyard, they are not helpful in predicting the amount of damage. At all three sites tested, the number of crawlers observed during the first warm days of spring bore little or no relationship to the percentage of damaged bunches at harvest (fig. 7). Again, there were many false negatives, which may be caused by asynchronous hatching; the crawlers visible on pruning scars may only represent the ovisacs that have most recently hatched.
Sampling guidelines
Because mealybugs hide beneath bark and in crevices, knowing when and where they congregate is useful for control. We offer these sampling guidelines:
-
Train field personnel to mark areas with heavy mealybug damage at harvest and keep records of these infestations from year to year to identify high-risk areas.
-
For vineyards where the infestation history is unknown, check for mealybug presence during warm spring days on spurs or canes, especially under loose bark adjacent to pruning scars.
-
In problem vineyards, monitor at midseason for adult mealybugs and egg sacs. Use timed counts of spurs or canes, peeling back the bark to search underneath for mealybugs. If parasitoid mummies are abundant, consider not spraying even when mealybugs average 1 per spur; otherwise, refer to fig. 6B.
-
Avoid midseason spraying by careful monitoring. If damage appears likely, emphasize spot treatments rather than whole-field sprays.
Sampling program for grape mealybugs improves pest management

