


All Issues
Weighing lysimeters aid study of water relations in tree and vine crops
Publication Information
California Agriculture 59(2):133-136. https://doi.org/10.3733/ca.v059n02p133
Published April 01, 2005
PDF | Citation | Permissions
Abstract
In 1986, two large weighing lysimeters, — one in a peach orchard and the other in a grape vineyard — were constructed at the UC Kearney Research and Extension Center as a joint effort between UC and the U.S. Department of Agriculture's Water Management Laboratory. Hourly weight changes in the lysimeters have been used to measure the daily and seasonal water use of trees and vines for nearly 20 years. Peaches and grapes exhibit similar seasonal crop-coefficient patterns that start as low as 0.1 in March, increase linearly until early July and then remain constant between 1.1 and 1.2 for the remainder of the season (provided the plants remain disease-, pest-and stress-free). The linear increase phase is proportional to the increase in canopy light-interception and leaf area. These relationships have facilitated modeling to predict crop evapotranspiration under various conditions. The peach lysimeter has also been useful for studying the effects of water stress on tree water use and for evaluating other methods of estimating water use.
Full text
Water is a critical resource in agriculture, and supplying the right amount is essential for healthy plants and optimum productivity. With insufficient water, plants become stressed and unproductive, and eventually die. With an excess, they can suffer from diseases, nutritional disorders and waterlogged soils. The most accurate way to estimate water use by crops is with a weighing lysimeter, which measures water loss from the plants and surrounding soil. A weighing lysimeter is simply a large “flower pot” resting on a sensitive, underground scale. Short-term weight loss from the system is almost entirely due to water transpired through leaves or evaporated from the soil surface.
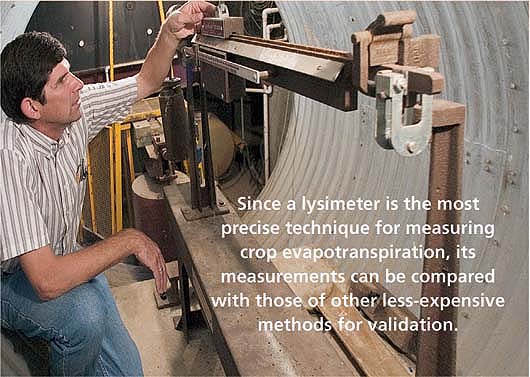
UC pomology specialist R. Scott Johnson, above, adjusts the balance beam in one of two lysimeters constructed at the UC Kearney Research and Extension Center. These rare research tools are large and expensive to maintain, which is why so few of them exist around the world. For 20 years they have been the most precise method of understanding daily and seasonal water use in the San Joaquin Valley. Every hour soil evaporation and plant transpiration — crop “evapotranspiration” — is recorded. When a threshold value is exceeded, the trees or vines growing in the lysimeters are automatically irrigated.
While this technique is generally considered one of the most reliable because it is simple and direct (Aboukhaled et al. 1981), weighing lysimeters are expensive to install and maintain, so relatively few have been constructed around the world, especially to study perennial trees and vines. At the UC Kearney Research and Extension Center (KREC), we have had two of these instruments for nearly 20 years. They have been particularly useful for determining patterns of tree and vine crop coefficients, studying water-stress effects on water use, and evaluating other techniques for estimating water use.
Lysimeter and field design
In 1986, two large weighing lysimeters were constructed at KREC as a joint effort between UC and the U.S. Department of Agriculture's Water Management Laboratory. Each lysimeter consists of an underground chamber that houses a balance-beam weighing system constructed by Fred Lourence (Precision Lysimeters, Red Bluff, Calif.) upon which rests a rectangular box measuring 6.5 feet wide by 13 feet long by 6.5 feet deep (Phene et al. 1991; Williams et al. 2003b). In constructing the underground chamber, soil was removed in 6-inch increments so it could be replaced in the box at approximately the same depth as the surrounding soil.
In spring 1987, two peach trees were planted in one lysimeter and two grape vines were planted in the other, and in each case the surrounding 3 acres were planted to the same variety and spacing. The grape variety was ‘Thompson Seedless’ (clone 2A) with 7-feet-by-11.5-feet spacing. The peach variety was initially ‘O’Henry’ (late-July harvest) on ‘Nemaguard’ rootstock, with 6-feet-by-16-feet spacing. In 1997, the mature ‘O’Henry’ trees were removed from the lysimeter and surrounding orchard and replaced in 1999 with ‘Crimson Lady’ (late-May harvest) peaches, which were also on ‘Nemaguard’ rootstock at the same spacing.
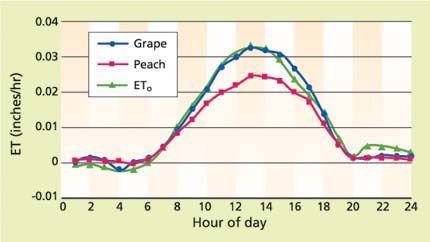
Fig. 1. Hourly crop evapotranspiration (ET) on June 9, 1996, as measured by the Kearney grape and peach lysimeters. Reference ETo was obtained from a nearby CIMIS weather station.
Each lysimeter has two separate irrigation systems, one below and the other above the ground. The underground irrigation systems are 12 inches and 24 inches deep in the peach lysimeter, and 16 inches deep in the grape lysimeter. Each underground system has 1-gallon-per-hour (gal/hr) emitters every 12 inches on either side of the plants. The aboveground irrigation systems consist of a single in-row line on or above the soil surface. The grape lysimeter's system is suspended 16 inches aboveground and has 1 gal/hr in-line drip emitters every 12 inches. The peach lysimeter's aboveground system had a 3.5-foot-diameter circle of ten 0.5 gal/hr drip emitters every 12 inches around each tree when planted with ‘O’Henry’, and a single 26 gal/hr emitter that fills a 4-foot diameter basin around each tree when planted with ‘Crimson Lady’. Irrigation water is supplied by two 80-gallon polyethylene tanks suspended from and included in the total mass of the lysimeters.
In addition, the lysimeters can control the low-volume irrigation systems in the surrounding fields. The vineyard is irrigated by a single line of drip tubing suspended 16 inches above the soil with 1 gal/hr in-line emitters every 12 inches. Each tree in the peach orchard has a 6.7 gal/hr spray emitter with about a 10-foot radius.
The lysimeters have been in continuous operation since 1987. Every hour, the lysimeter boxes (including soil, plants and suspended irrigation tanks) are automatically weighed to determine water loss, which includes both soil evaporation and plant transpiration and is often referred to as “crop evapotranspiration,” or ETc. The values are recorded with a data logger (Campbell Scientific Instruments, 21 XL Micrologger, Logan, Utah) and the mass change is compared to a threshold value. When this value is exceeded, the trees or vines are automatically irrigated. Generally, low threshold values have been used so that multiple irrigations per day are called for in the summer. This maintains soil moisture content close to field capacity and minimizes any water stress effects. At midnight each day, the water tanks are automatically refilled to a preset level, and the new lysimeter mass is set as the baseline for the next day.
Hourly reference crop evapotranspiration (ETo) values are calculated by a modified Penman equation using weather data collected from a nearby CIMIS (California Irrigation Management Information System) weather station. This equation was developed by scientists to estimate grass ET and is used as a standard around the world. Daily summed ETc values are divided by daily summed ETo to provide a crop coefficient (Kc) for each day. Once a seasonal pattern of crop coefficients has been established, this information can be used to guide irrigation amounts. The crop coefficient multiplied by ETo for a given time period gives an ETc value for that same period of time. Then, after adjusting for irrigation efficiency, the amount of water to apply can be determined.
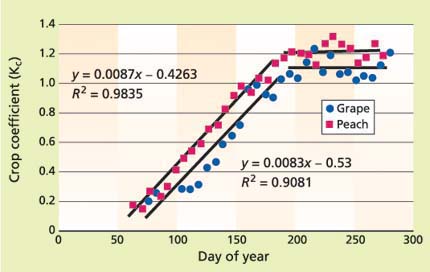
Fig. 2. Seasonal pattern of crop coefficients for mature grapevines (1996) and peach trees (average from 2001 to 2003) as calculated from lysimeters. Each data point is a weekly average. Regression lines are for data collected from bud-break through early July (about day 180).
Tree and vine crop coefficients
During normal midsummer days in central California, with hot temperatures and cloudless skies, the lysimeters generate smooth daily ETc graphs with minimal noise (fig. 1). During periods of unsettled weather, the lysimeter output is more variable from one hour to the next, but has generally followed the same pattern as ETo, resulting in consistent day-to-day crop-coefficient values.
The typical seasonal crop-coefficient pattern of mature plants for both peaches and grapes starts as low as 0.1 to 0.2 early in the spring and increases steadily until early July (fig. 2) (Ayars et al. 2003; Williams et al. 2003a). Grape is delayed somewhat compared to peach because it is more severely pruned and takes longer to develop its canopy. For the remainder of the season, the crop coefficients for both crops leveled off at values between 1.1 and 1.2. The seasonal pattern of young trees and vines has also been determined (Johnson et al. 2002; Williams et al. 2003b).
The Kearney lysimeter research has elucidated factors affecting the water use of trees and vines, allowing for the better estimation of crop coefficients under conditions different from those in the lysimeter fields. One factor that has clearly been demonstrated is between canopy light interception and tree water use (Johnson et al. 2000), or leaf area and vine water use (Williams et al. 2003a). This relationship holds true for both young and mature trees and vines. The steadily increasing crop coefficients throughout the spring (fig. 2) are primarily due to the tree or vine's expanding canopy and its increasing interception of light.

Left and center, construction of the two large weighing lysimeters at KREC began in 1986. Each lysimeter consists of an underground chamber that houses a balance-beam weighing system with a rectangular “flower pot” measuring 6.5 feet wide by 13 feet long by 6.5 feet deep. Right, researchers enter the completed lysimeter.
The Kearney peach lysimeter yielded a crop-coefficient pattern (Ayars et al. 2003) distinctly different from previously published values for deciduous fruit crops (Snyder et al. 1989). The published values, which were derived primarily from almond trees, start at about 0.5 in the spring and increase to peak values of less than 1.0. Thus, the lysimeter-derived peach crop-coefficient pattern starts much lower initially in the spring, but by midsummer reaches a higher plateau.
These differences can be attributed to differences in the canopy development of peach and almond trees. Almonds are minimally pruned and quickly develop a spur canopy (many short shoots), which has high light-interception in the spring. In contrast, peach trees are more heavily pruned and require extensive shoot growth before they develop a full canopy. These differences indicate that separate crop-coefficient values may be needed for different deciduous fruit-tree species and grapevines, depending on pruning and canopy development parameters.
The maximum midsummer crop-coefficient values of 1.1 to 1.2 are greater than those reported in the past for trees and vines. However, these values are not out of line with recent reports on a wide range of crop plants including beans, corn, cotton, sugar cane and pistachios (Allen et al. 1998). In addition, while other researchers have reported that crop coefficients decrease toward the end of the growing season (Williams et al. 2003a), these decreases were due to insect pest defoliation (Daane and Williams 2003) or irrigation cutoff (Ayars et al. 2003). Such late-season declines in crop coefficients were not observed in either lysimeter as long as the plants were kept healthy, free of pests and well watered. Therefore, even though there may be horticultural or pest management reasons for cutting back irrigation water at the end of the season, there does not appear to be a physiological basis for it. The Kearney lysimeter research has clearly demonstrated that as long as they are kept healthy, peach trees and grapevines are capable of using significant amounts of water throughout the growing season.
However, it is important to emphasize that the lysimeters measure water use under conditions of high soil-water availability, which are not necessarily the best conditions for optimum production, tree health and fruit quality. A study in the grape lysimeter vineyard showed that yields were maximized when moderate water stress was imposed by limiting water applications throughout the season to between 60% and 80% of lysimeter water use (full ETc) (Williams 2000). Likewise, there are many fruit-tree studies showing the benefits of imposing moderate water stress at different periods of the growing season. Ongoing research is needed to develop deficit-irrigation (less than full ETc) management strategies that optimize fruit quality, plant health and long-term productivity. To aid in irrigation management, a model to predict peach-tree water use has been developed using lysimeters to quantify the relationships among light interception, soil evaporation, tree dimensions and tree water use (Johnson et al. 2002, 2004).
Water stress and water use
The lysimeters have also been useful for evaluating how water stress affects various parameters, particularly water use. In 1996, the peach lysimeter was subjected to a 3-week drying cycle and during that time frequent measurements were made of soil water content, predawn leaf water-potential and midday stem water-potential (Mata et al. 1999). Water potential is measured with a pressure chamber and basically indicates the tension of water in the leaf. All three parameters showed strong correlations with tree water use.
For soil water content, tree water use started to decline when the available water content decreased by 20% in the top 33 inches of soil, and then declined steadily as the water content continued to decrease. For predawn leaf water-potential and midday stem water-potential there was a continual decline in water use across all values, suggesting that either measurement could be useful in determining how well irrigation is supplying full crop ETc and in assessing tree water stress. Similar relationships have also been found for grapevines (Williams and Araujo 2002).
A second study of more moderate water stress was conducted in the peach lysimeter in 2002. Three short-term drying cycles of about 1 week were imposed during 3-week periods in early June and again in late July. During each cycle, daily measurements were made of midday stem water-potential. As in the 1996 study, there was a linear decline in tree water use with decreasing midday stem water-potential values (fig. 3). Absolute water use was higher in late July than early June because of greater leaf area. However, the slope of the relationship was similar for both of these periods as well as during the 1996 study, which suggests midday stem water-potential might be a consistent tool for irrigation management in peach trees. Indeed, this measurement has proven to be useful both for predicting water stress and for helping schedule irrigation for a range of tree and nut species in California (Shackel et al. 1997).
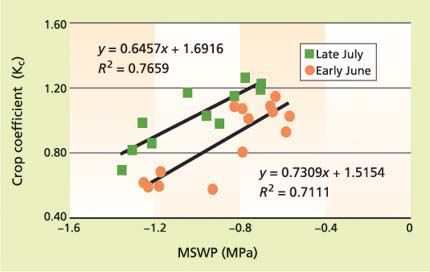
Fig. 3. Relationship between peach tree crop-coefficient (Kc = ETc/ETo) and midday stem water-potential (MSWP) for two periods of three dry-down cycles (no irrigation for 5 to 7 days) in 2002. MSWP is expressed in units of mega-pascals (MPa), a measure of water tension in the plant.
Methods for estimating water use
Since a lysimeter is the most precise technique for measuring ETc, its output can be compared with that of other less expensive methods for validation. The peach lysimeter has shown that two such methods are inaccurate but that others may be promising. The two inaccurate methods are the heat balance technique for estimating sap flow (Shackel et al. 1992) and the use of leaf-to-air temperature differences, as measured by an infrared sensor to estimate stress (Medawar 1991). Promising methods, such as the measurement of stem water-potential mentioned above, also include the continuous monitoring of diurnal changes in trunk diameter (shrinking and swelling) as an irrigation guide (Fereres et al. 1999; Goldhamer et al. 2003). As more techniques for estimating water use are developed, such as those involving remote sensing or detailed meteorological data, the Kearney lysimeters will be valuable instruments for validation purposes.

The Kearney lysimeters have been in constant use since 1987. One lysimeter measures water use in peaches, top, the other ‘Thompson Seedless’ grapes, bottom. The lysimeters have provided more accurate evapotranspiration values for peach trees and grape vines, information necessary in irrigation management decisions that ultimately affect plant health and fruit quality.
Weighing lysimeters aid study of water relations in tree and vine crops

