California Agriculture
University of California
California Agriculture

All Issues

Soil sampling protocol reliably estimates preplant NO3 in SDI tomatoes

Share using any of the popular social networks Share by sending an email Print article

Authors

Cristina Lazcano, UC Davis
Jordon Wade, UC Davis
William R. Horwath, UC Davis
Martin Burger, UC Davis

Publication Information

California Agriculture 69(4):222-229. https://doi.org/10.3733/ca.v069n04p222

Published online October 01, 2015

PDF  |  Citation  |  Permissions  |  Cited by 3 articles

Author Affiliations show

Abstract

Subsurface drip irrigation (SDI), because it can precisely deliver nutrients close to plant roots, could lead to carefully determined applications of fertilizer to meet crop needs and less risk of nitrate (NO3-) leaching to groundwater. Appropriate fertilizer applications, however, depend on an accurate assessment of the spatial distribution of the main plant macronutrients (N, P and K) in the soil profile before planting. To develop nutrient sampling guidelines, we determined the spatial distributions of preplant nitrate (NO3-), bicarbonate extractable phosphorus (Olsen-P) and exchangeable potassium (K) in the top 20 inches (50 centimeters) of subsurface drip irrigated processing tomato fields in three of the main growing regions in the Central Valley of California. Nutrient distribution varied with depth (P and K), distance from the center of the bed (NO3-) and growing region (NO3- and K). No depletion of NO3-, Olsen-P or K in the root feeding areas close to the drip tape was detected. Preplant NO3- ranged considerably, from 45 to 438 pounds N per acre (50 to 491 kilograms/hectare), the higher levels in fields with consecutive crops of tomatoes. A sampling protocol that growers could use, developed from analysis of the distribution results, provided reliable estimates of preplant NO3- as well as P and K in all surveyed fields.

Full text

Subsurface drip irrigation (SDI) allows for a precise delivery of water and nutrients close to plant roots, making it possible for growers to increase water and nutrient use efficiency and crop yields.

Efficient use of nitrogen (N) is gaining importance in terms of lowering the risk of nitrate (NO3) leaching into groundwater during the rainy and irrigation seasons. Avoiding a buildup of large surpluses of residual N is feasible under SDI if the available N at preplant can be reliably quantified. Our primary goal in this study was to develop guidelines on how to reliably, efficiently and economically sample for preplant NO3 in processing tomato fields under SDI.

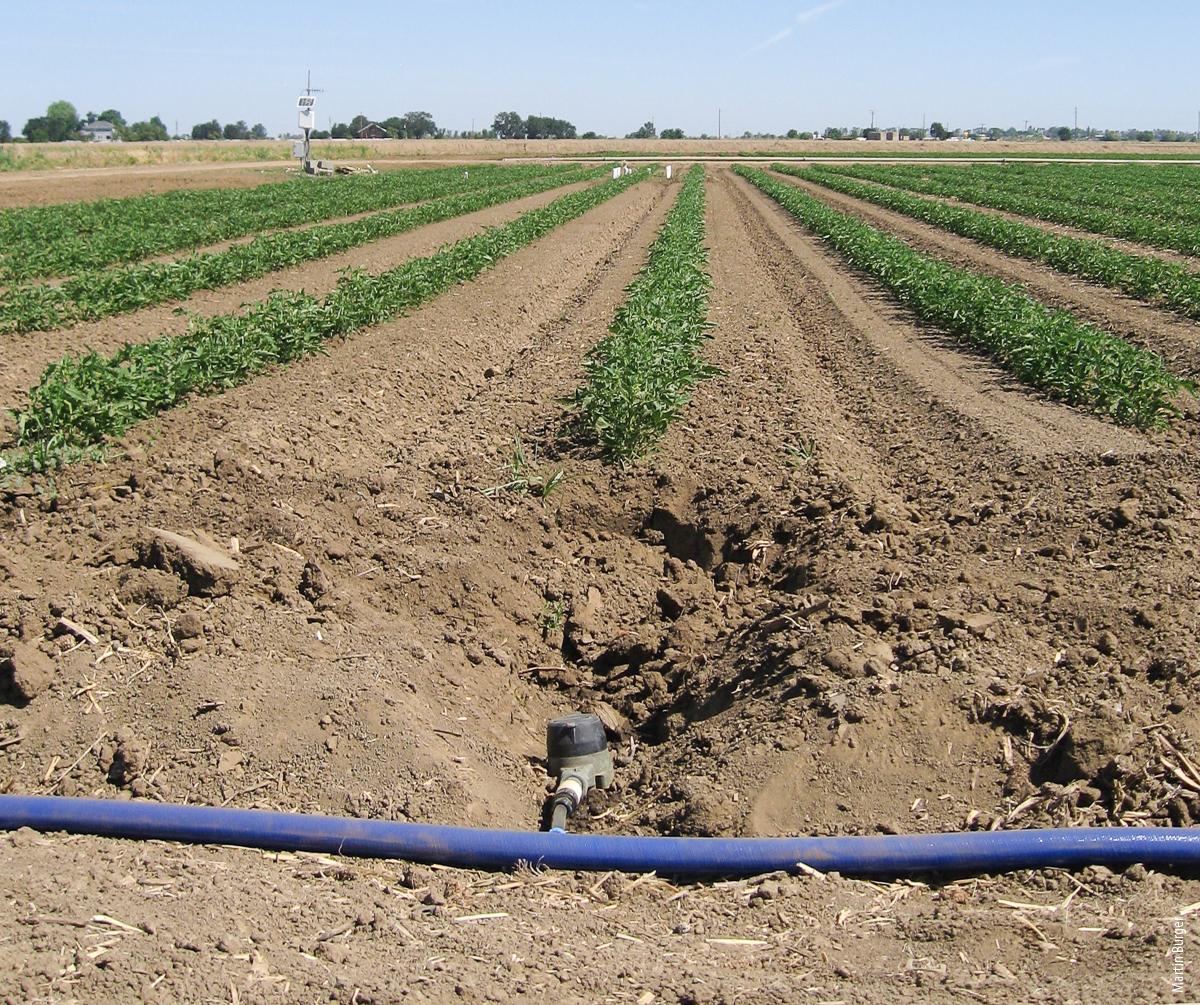
Although subsurface drip irrigation is widely used in California to produce processing tomatoes, knowledge of nutrient distribution at preplant is limited. To address this, UC researchers developed a sampling protocol that can be used to estimate preplant levels of nitrate, phosphorus and potassium.

Although subsurface drip irrigation is widely used in California to produce processing tomatoes, knowledge of nutrient distribution at preplant is limited. To address this, UC researchers developed a sampling protocol that can be used to estimate preplant levels of nitrate, phosphorus and potassium.

A recent survey among tomato growers showed that soil NO3 is determined in only a limited number of fields every year at preplant (Geisseler et al. 2015). Currently, N fertilizer rates for processing tomatoes of about 178 pounds per acre (lb/ac) (200 kilograms per hectare [kg/ha]) are recommended under SDI (Hartz and Bottoms 2009; Tei et al. 2002). Tomato plants take up an average of 263 lb/ac (296 kg/ha), with 71% of the N allocated to the fruit by harvest (Hartz and Bottoms 2009). N concentration in fruit at optimum fertilization rates has been reported as 4.47 pounds per U.S. ton (lb/US tn) (2.24 kilograms per megagram [kg/Mg]) marketable fruit (Tei et al. 2002).

Mineral fertilizer is considered the main source of N in conventionally managed tomato systems, but other sources such as soil residual, or carryover, NO3, mineralization of soil organic matter, and NO3 in irrigation water contribute to the supply of crop-available N. The latter sources are often not considered in fertilizer rate calculations, and as a result, N inputs can be in excess of crop need.

There are several difficulties in estimating preplant NO3 levels, a concern mentioned in Dzurella et al. (2012): (1) NO3 is one of the plant nutrients with the highest mobility, and therefore highest spatial variability, in soils, which makes it difficult to estimate total available N. (2) Under SDI, NO3 may accumulate at the periphery of the wetted soil volume and be depleted where roots proliferate at high density, such as near the drip tape emitter (Lecompte et al. 2008). As a consequence, NO3 concentration in furrows can be up to 16 times higher than in the center of the bed (Lecompte et al. 2008). (3) NO3 concentration and spatial distribution might be affected by ratios of atmospheric precipitation to evapotranspiration (ET).

The extent and distribution of precipitation determines NO3 leaching potential, especially under Mediterranean climate conditions (Poch-Massegú et al. 2014), with greater downward movement of NO3 occurring seasonally; whereas atmospheric variables, such as temperature, affect NO3 movement through their influence on evapotranspiration rates. Both irrigation management and weather conditions affect NO3 levels and spatial distribution. Therefore, measurements under varied climatic conditions are necessary to assess the extent such factors have on NO3 distribution in drip-irrigated processing tomato fields.

Unlike NO3, phosphorous (P) and potassium (K) are less mobile in the soil profile. While less mobility reduces the loss of these nutrients through leaching, it also limits diffusion from enriched soil patches outside of the root growth zone. As a result, fields with several years of SDI cultivation might present a characteristic depletion within the root zone, where nutrient uptake is most intense (Hartz and Hanson 2009).

In spite of the widespread use of SDI in processing tomatoes, there is a lack of knowledge of the spatial distribution of the main plant macronutrients (N, P and K) at preplant. Complicating this further, management practices (i.e., rotations, continuous SDI cultivation) and climatic factors (i.e., precipitation and evapotranspiration) influence the spatial distribution of these nutrients.

We carried out a survey to address the lack of knowledge in this area: we assessed preplant distribution of NO3, extractable P and exchangeable K in relation to the SDI line in commercial processing tomato fields. Crop N uptake and nitrogen use efficiency were evaluated in relation to preplant inorganic N levels and fertilizer N inputs in order to evaluate the performance of current practices of SDI processing tomato production. The main goal, as mentioned above, was to develop guidelines on the simplest way to reliably assess preplant NO3.

Sampling sites, procedures

A total of 16 commercial processing tomato production fields were selected for the study. Fields were located along a transect of a decreasing ratio of precipitation to potential evapotranspiration (ETo), with six fields in Yolo County (ETo = 1.01), four in San Joaquin County (ETo = 0.54) and six in Fresno County (ETo = 0.31), three of the growing regions with the largest production of processing tomatoes in the state.

The selected fields had been cultivated under SDI for a minimum of 2 and a maximum of 9 years. Fields comprised a range of different management conditions typical of processing tomato production in California, including different bed sizes (60 versus 80 inches [in], or 1.5 versus 2 meters [m]), the number of consecutive years in tomato production and the planting of fall/winter crops in the fields (table 1).

Main characteristics and management practices of the 16 fields sampled

TABLE 1. Main characteristics and management practices of the 16 fields sampled

Preplant soil sampling was carried out in all 16 fields from late February to mid-May, depending on the planting schedule and before the application of any fertilizers. In each field, five random locations were selected and a systematic sampling was carried out using a soil probe at regular (5 in, or 13 centimeter [cm]) intervals from the center of the bed to the center of the furrow. At each sampling point, two sets of soil from 0 to 10, and 10 to 20 inches (0 to 25, and 25 and 50 cm) in depth were taken and composited per depth. The exact position of the five sampling locations (± 9.8 feet, or 3 m) was recorded using GPS latitude-longitude coordinates in order to collect plant and soil samples from the same locations at harvest. Harvest NO3 concentrations were measured before the incorporation of vine residue by taking one core 10 inches from the center of the bed to a depth of 20 inches at each of the five locations per field.

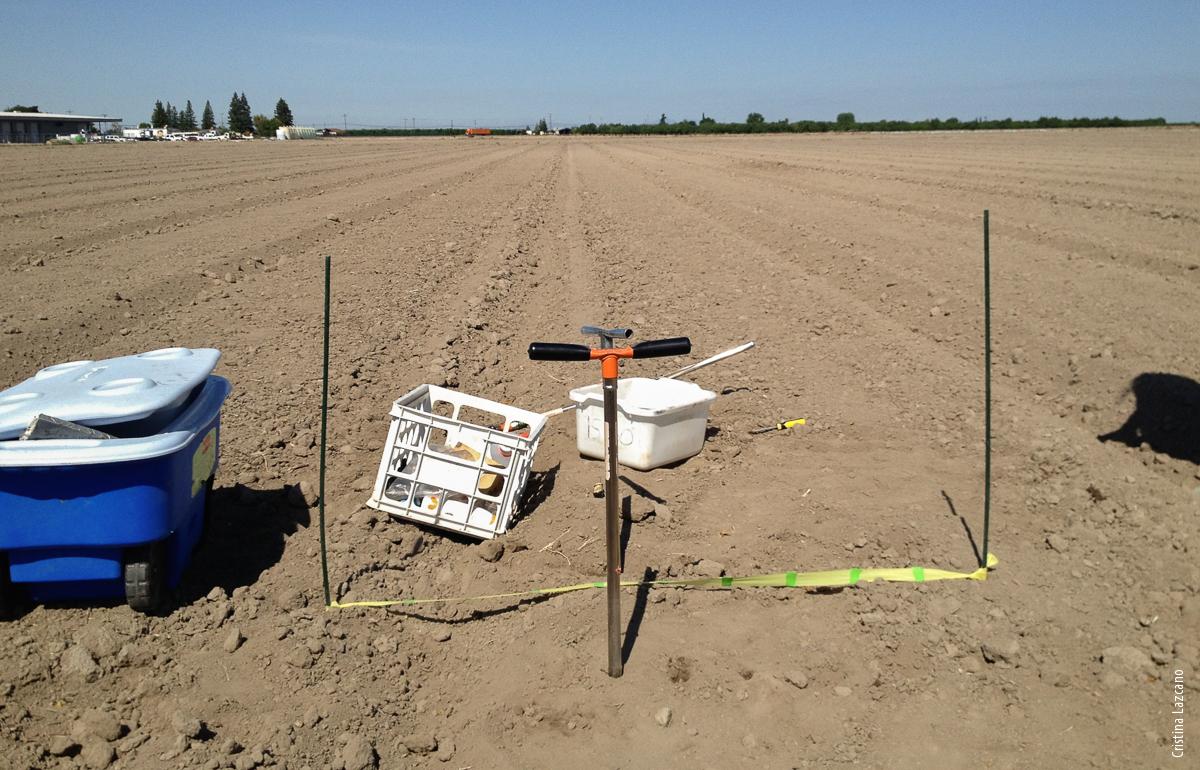
Preplant soil samples were collected at 5-inch intervals from the center of the bed towards the center of the furrow.

Preplant soil samples were collected at 5-inch intervals from the center of the bed towards the center of the furrow.

Analysis of soil samples

The soil samples were stored in plastic bags, transported to the laboratory and stored at 4°C. Gravimetric soil moisture content was determined immediately after collection by drying a subsample at 221°F (105°C). In addition, a 10-gram subsample was immediately extracted with 2M potassium chloride (KCl) solution for the colorimetric analysis of NO3 concentration (Doane and Horwath 2003). Available Olsen-P was analyzed colorimetrically after extraction with sodium bicarbonate (NaHCO3) (Kuo 1996). Exchangeable K was determined by inductively coupled plasma atomic emission spectrometry (ICP-AES) on an air-dried and ground preplant soil subsample after extraction with ammonium acetate (Thomas 1982).

N uptake and use efficiency

Crop N uptake was determined by hand-harvest at the preplant sampling locations. Briefly, we sampled a length of 1 meter along the bed and all plants within this meter were counted and cut at soil level. Fruit and vines were separated, weighed and a subsample of both components selected for further determination of dry mass and percentage N (% N) through dry combustion on a C and N analyzer (Costech Analytical Technologies Inc., Valencia, CA) (Dumas 1848).

Vine and fruit biomass and % N per plant were calculated and then extrapolated to the rest of the field using plant density of the area harvested. Apparent nitrogen use efficiency of the tomato crop (NUEC) was calculated as the ratio between N uptake by the tomato crop, including fruit and vine sampled at each field, and the available N, taking into account both the preplant soil NO3 and the fertilizer inputs reported by the growers.

Nitrogen outputs were calculated based on the marketable yields reported by the growers and the average N content of the fruit sampled from the hand-harvest plots. Apparent nitrogen use efficiency of the harvested fruit (NUEF) was calculated as the ratio between N outputs in the harvested fruit and the available N, including preplant soil NO3 and fertilizer inputs.

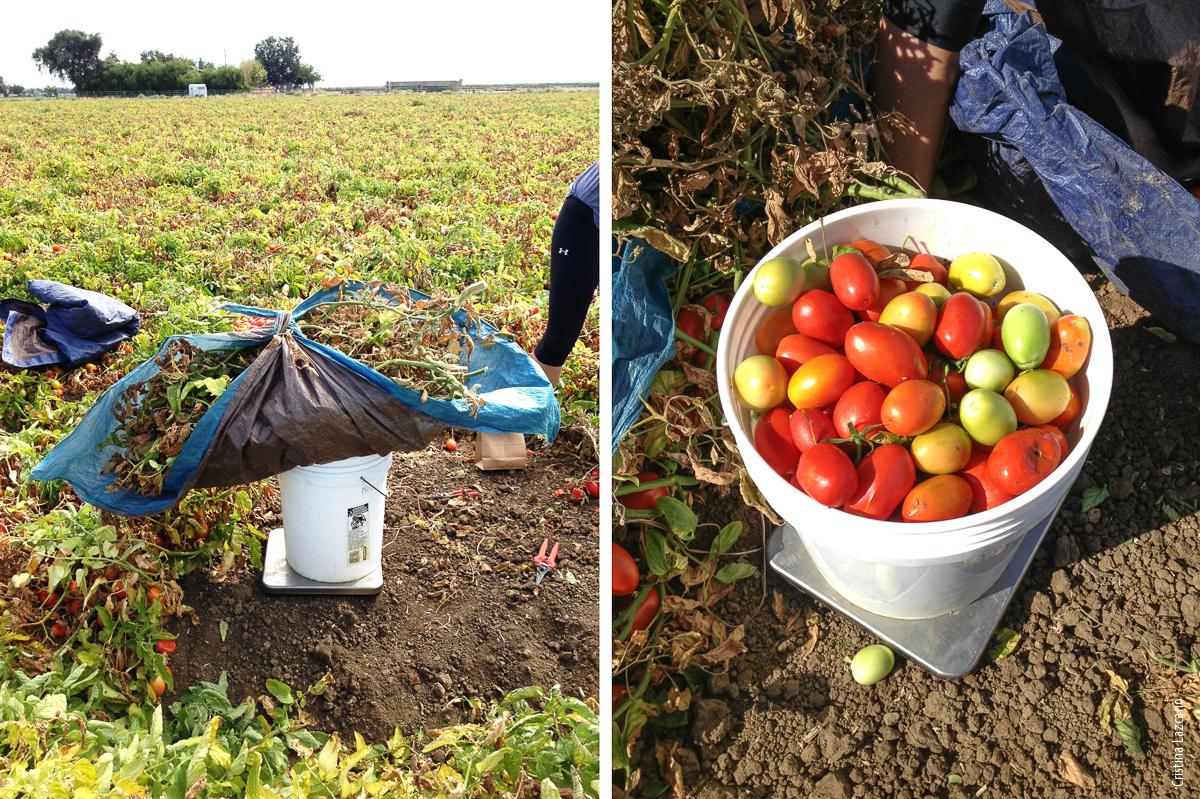
Weighing of the vine biomass, left, and fruit biomass, right, collected at each location within a field. Vine biomass, which is incorporated into the soil after harvest, contributed an average N input of 109 lb/ac.

Weighing of the vine biomass, left, and fruit biomass, right, collected at each location within a field. Vine biomass, which is incorporated into the soil after harvest, contributed an average N input of 109 lb/ac.

P levels and distribution

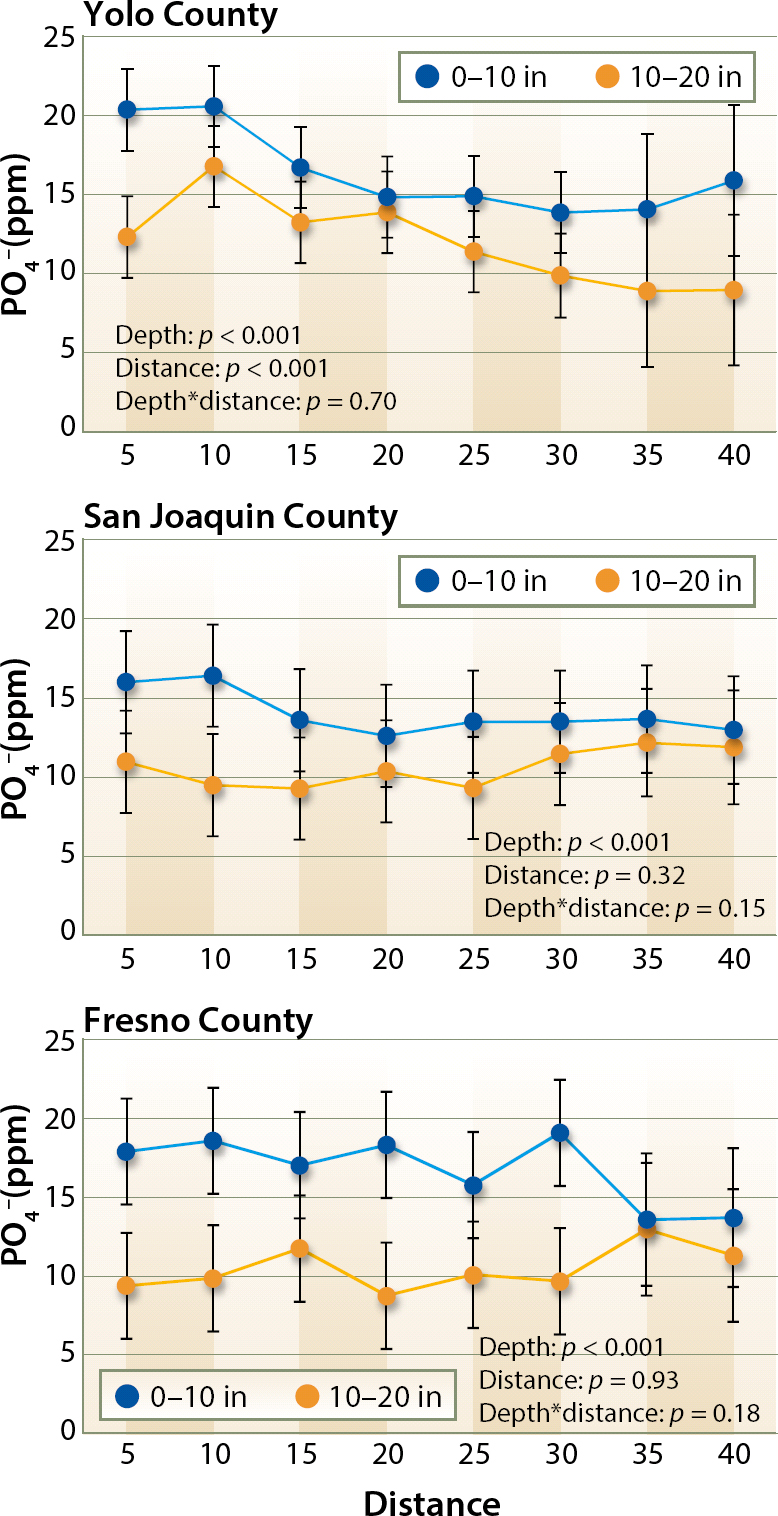
Twelve of the 16 fields showed significantly higher Olsen-P concentration in the upper layer of soil than the deeper layer (fig. 1). Concentrations were homogeneous across the beds, with only two fields showing significant differences between sampling points (data not shown). Significant differences in extractable P between sampling distances from the center of the bed were observed in the Yolo growing region, with higher concentrations closer to the center of the bed (fig. 1).

Change in PO4− content of the soil at different distances from the center of the bed and at two depth intervals (0 to 10, and 10 to 20 inches) in Yolo, San Joaquin and Fresno counties. Statistical significance of the depth, distance and the interaction between them (depth*distance) is shown at each of the three growing regions.

Fig. 1. Change in PO4 content of the soil at different distances from the center of the bed and at two depth intervals (0 to 10, and 10 to 20 inches) in Yolo, San Joaquin and Fresno counties. Statistical significance of the depth, distance and the interaction between them (depth*distance) is shown at each of the three growing regions.

No significant differences between growing regions were detected (p = 0.77), although average concentrations in the 0 to 20 inches soil layer tended to be highest in the Fresno (13.7 ± 3.1 parts per million, ppm) area, followed by the Yolo and San Joaquin areas (12 ± 1.7 and 10.6 ± 2.9 ppm, respectively).

Our study showed that Olsen-P was not lower within the root growth area than outside of it. This finding was in contrast to the earlier suggestion that the amount of available P can substantially decline close to the drip tape because of concentrated root feeding (Hartz and Hanson 2009). In fact, in this study, within the Yolo County area, Olsen-P concentrations were higher closer to the center of the bed and decreased toward the furrows.

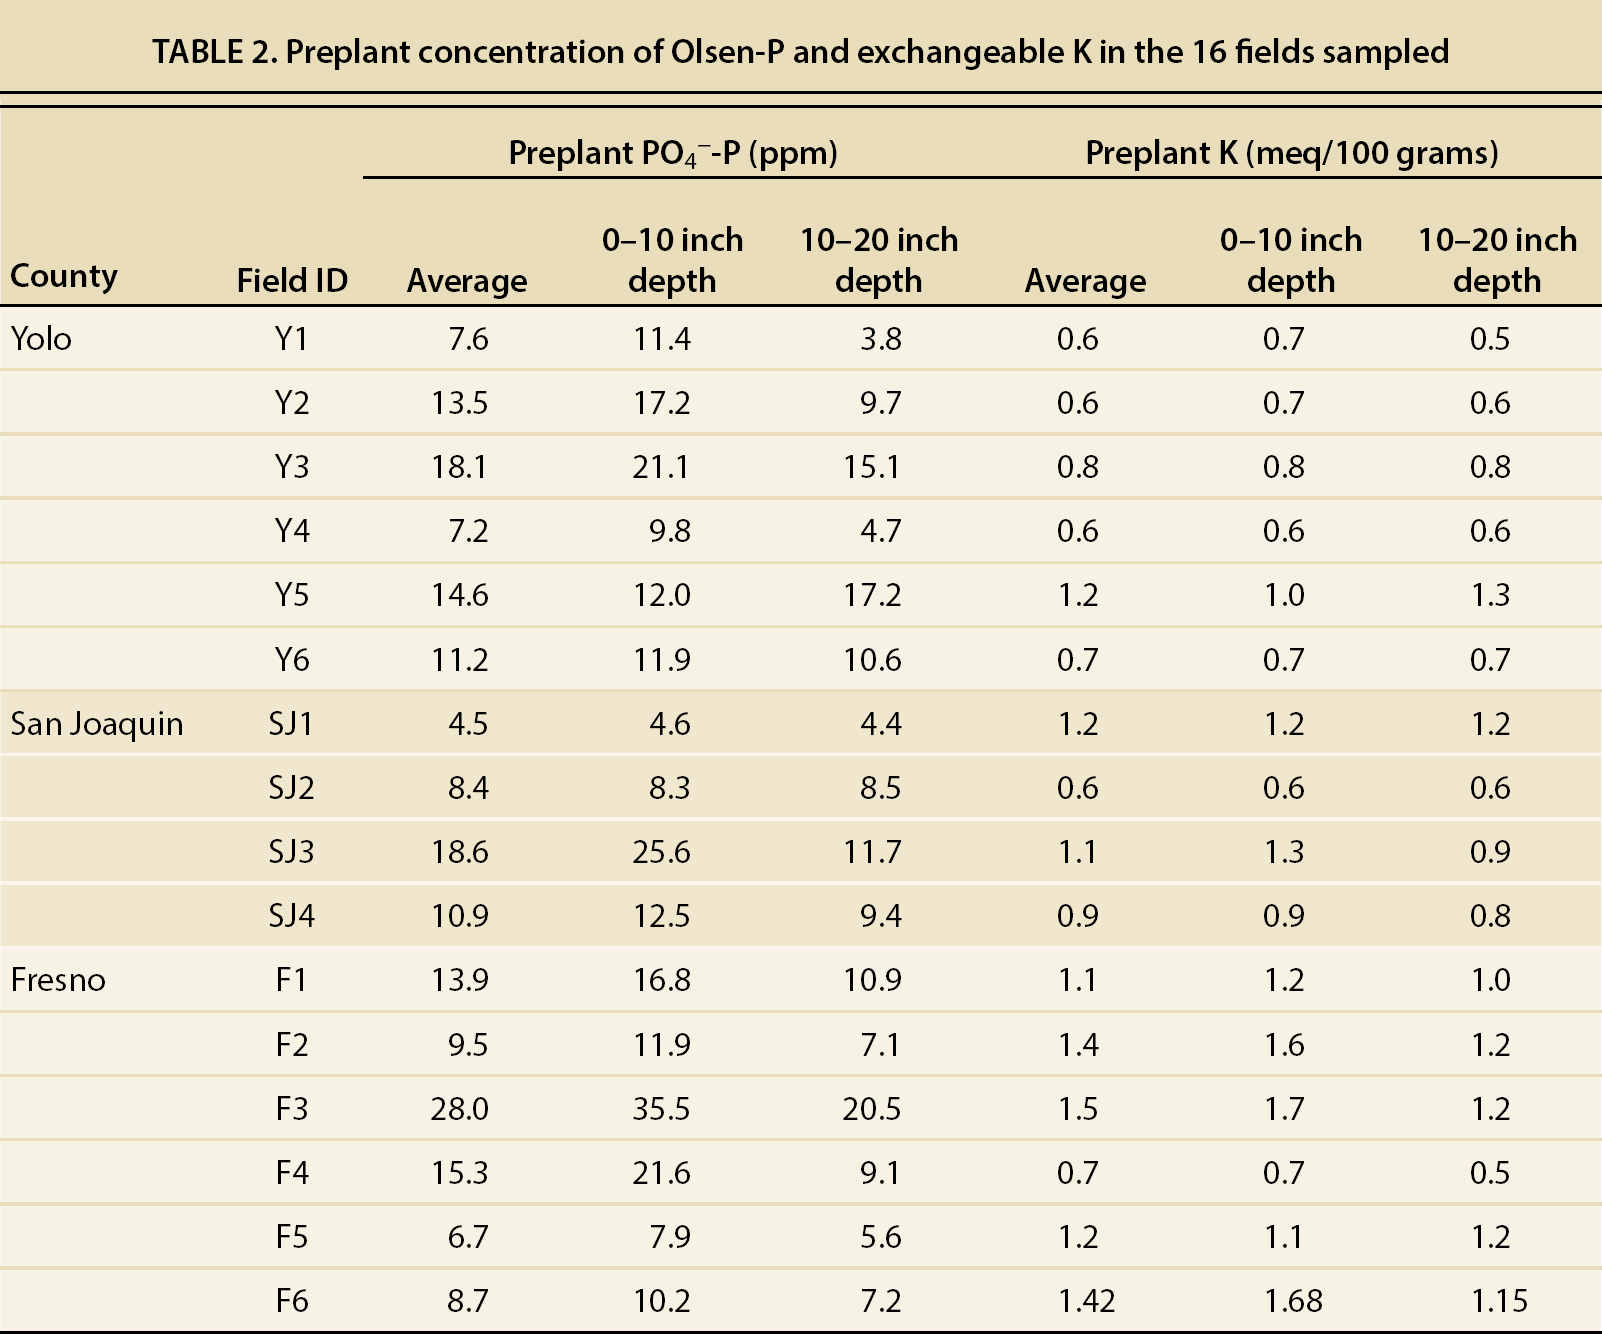
The majority of the fields in this study showed average P concentrations lower than 15 ppm in both layers (table 2), within the threshold value of 12 to 20 ppm, where there is potential for a yield response to a P application. Generally, fields with < 15 ppm of available P would respond to a P application, whereas fields with more than 25 ppm would be unlikely to do so (Hartz 2008). In this study, only one of the fields had extractable P higher than 25 ppm. These results show that some of the fields could benefit from additional P fertilization, yet current fertilization practices are effective in avoiding P depletion in the root-feeding zone.

Preplant concentration of Olsen-P and exchangeable K in the 16 fields sampled

TABLE 2. Preplant concentration of Olsen-P and exchangeable K in the 16 fields sampled

K levels and distribution

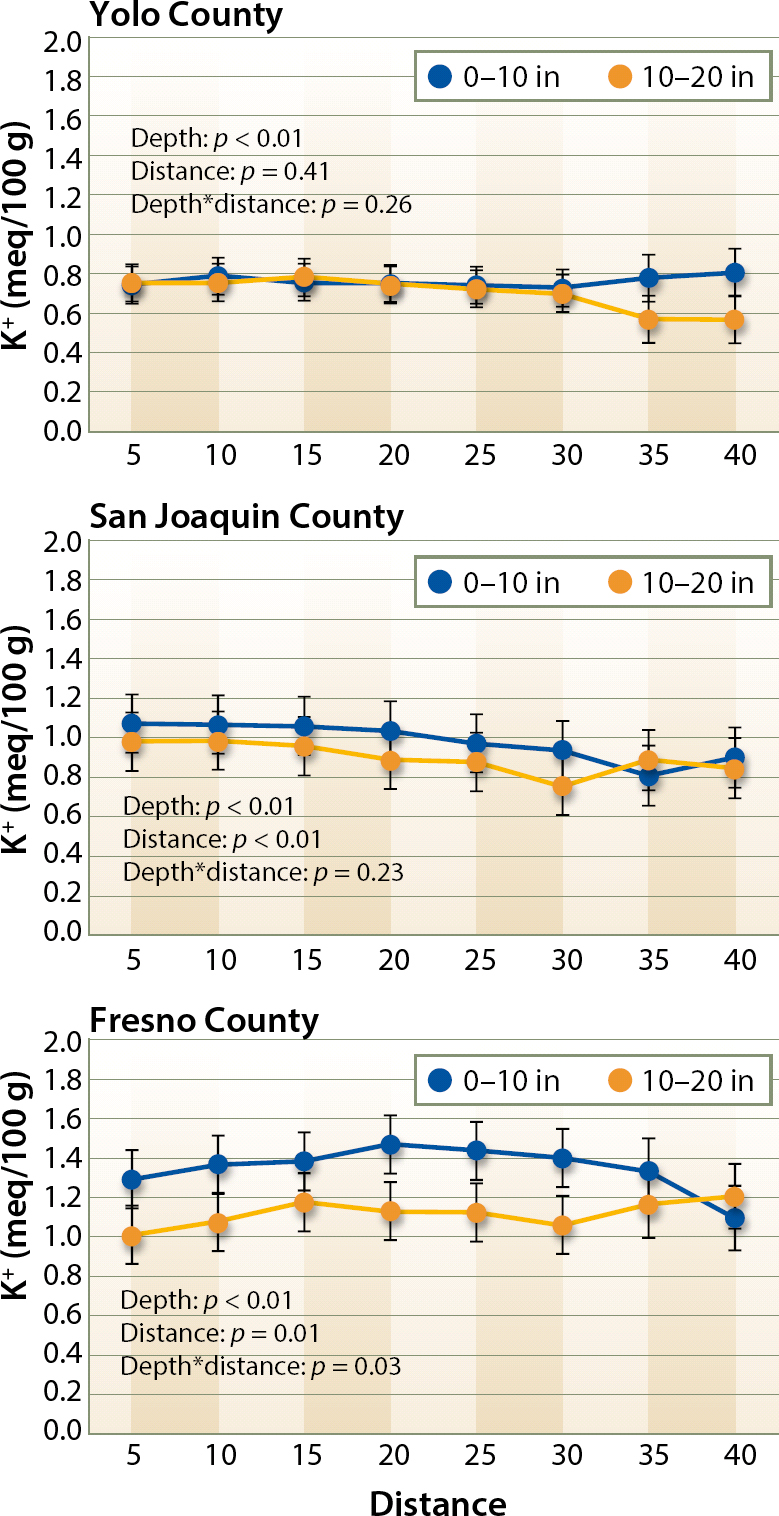
Soil exchangeable K content was mostly homogeneous within the beds, and no depletion was observed close to the drip tape in any of the three growing areas (fig. 2). The lack of K depletion in the root zone may be because potassium can easily be supplied through fertigation, with the advantage of little potential for fixation before the plants take it up since K fixation in interlayer sites of soil minerals mainly takes place during drying following water additions (Cassman et al. 1990). As shown in table 2, average field exchangeable K concentrations were generally high and well above 130 to 150 ppm (0.33 to 0.38 meq/100 g [grams]), which has been defined as the threshold for yield responses in furrow-irrigated processing tomato in California (Hartz 2002; Hartz and Hanson 2009; Miyao 2002).

Exchangeable K content of the soil at different distances from the center of the bed and at two depth intervals (0 to 10, and 10 to 20 inches) in Yolo, San Joaquin and Fresno counties. Statistical significance of the depth, distance and the interaction between them (depth*distance) is shown at each of the three growing regions.

Fig. 2. Exchangeable K content of the soil at different distances from the center of the bed and at two depth intervals (0 to 10, and 10 to 20 inches) in Yolo, San Joaquin and Fresno counties. Statistical significance of the depth, distance and the interaction between them (depth*distance) is shown at each of the three growing regions.

For drip irrigation, yield thresholds have been estimated to be higher at 200 to 300 ppm (0.51 to 0.77 meq/100 g), although there is still limited information available in this respect (Hartz and Hanson 2009). All fields were above 200 ppm (0.51 meq/100 g), meaning that yield increases resulting from K additions could not be expected; however, K applications benefit fruit quality even at levels that are not yield limiting (Hartz et al. 2005).

High exchangeable K is not rare in processing tomato soils; concentrations ranging from 187 to 331 ppm (0.48 to 0.85 meq/100 g) have been previously reported for the Yolo growing region (Hartz et al. 2005). Concentrations reported in our survey are, however, well over these values, particularly in Fresno County (1.20 ± 0.12 meq/100 g) followed by San Joaquin (0.95 ± 0.14 meq/100 g) and Yolo counties (0.75 ± 0.12 meq/100 g), with significant differences between the three growing areas (p < 0.01). Exchangeable K was similar at the two depths in Yolo County (fig. 2), whereas K concentrations were higher in the upper soil layer in Fresno and San Joaquin counties (p < 0.01 and p < 0.05, respectively). In the fields in San Joaquin County, K concentration tended to decrease from the center of the bed toward the furrow.

NO3 levels and NUE

Preplant NO3-N in the depth interval of 0 to 20 inches (0 to 50 cm) ranged from 45 to 438 lb/ac (50 to 491 kg/ha) among all the fields. The average NO3-N content in this layer was significantly higher in San Joaquin and Fresno counties (232 ± 31 and 216 ± 54 lb/ac, or 261 ± 34 and 243 ± 61 tn/ha, respectively) than in Yolo County (70 ± 8 lb/ac, or 79 ± 9 tn/ha) (p < 0.001).

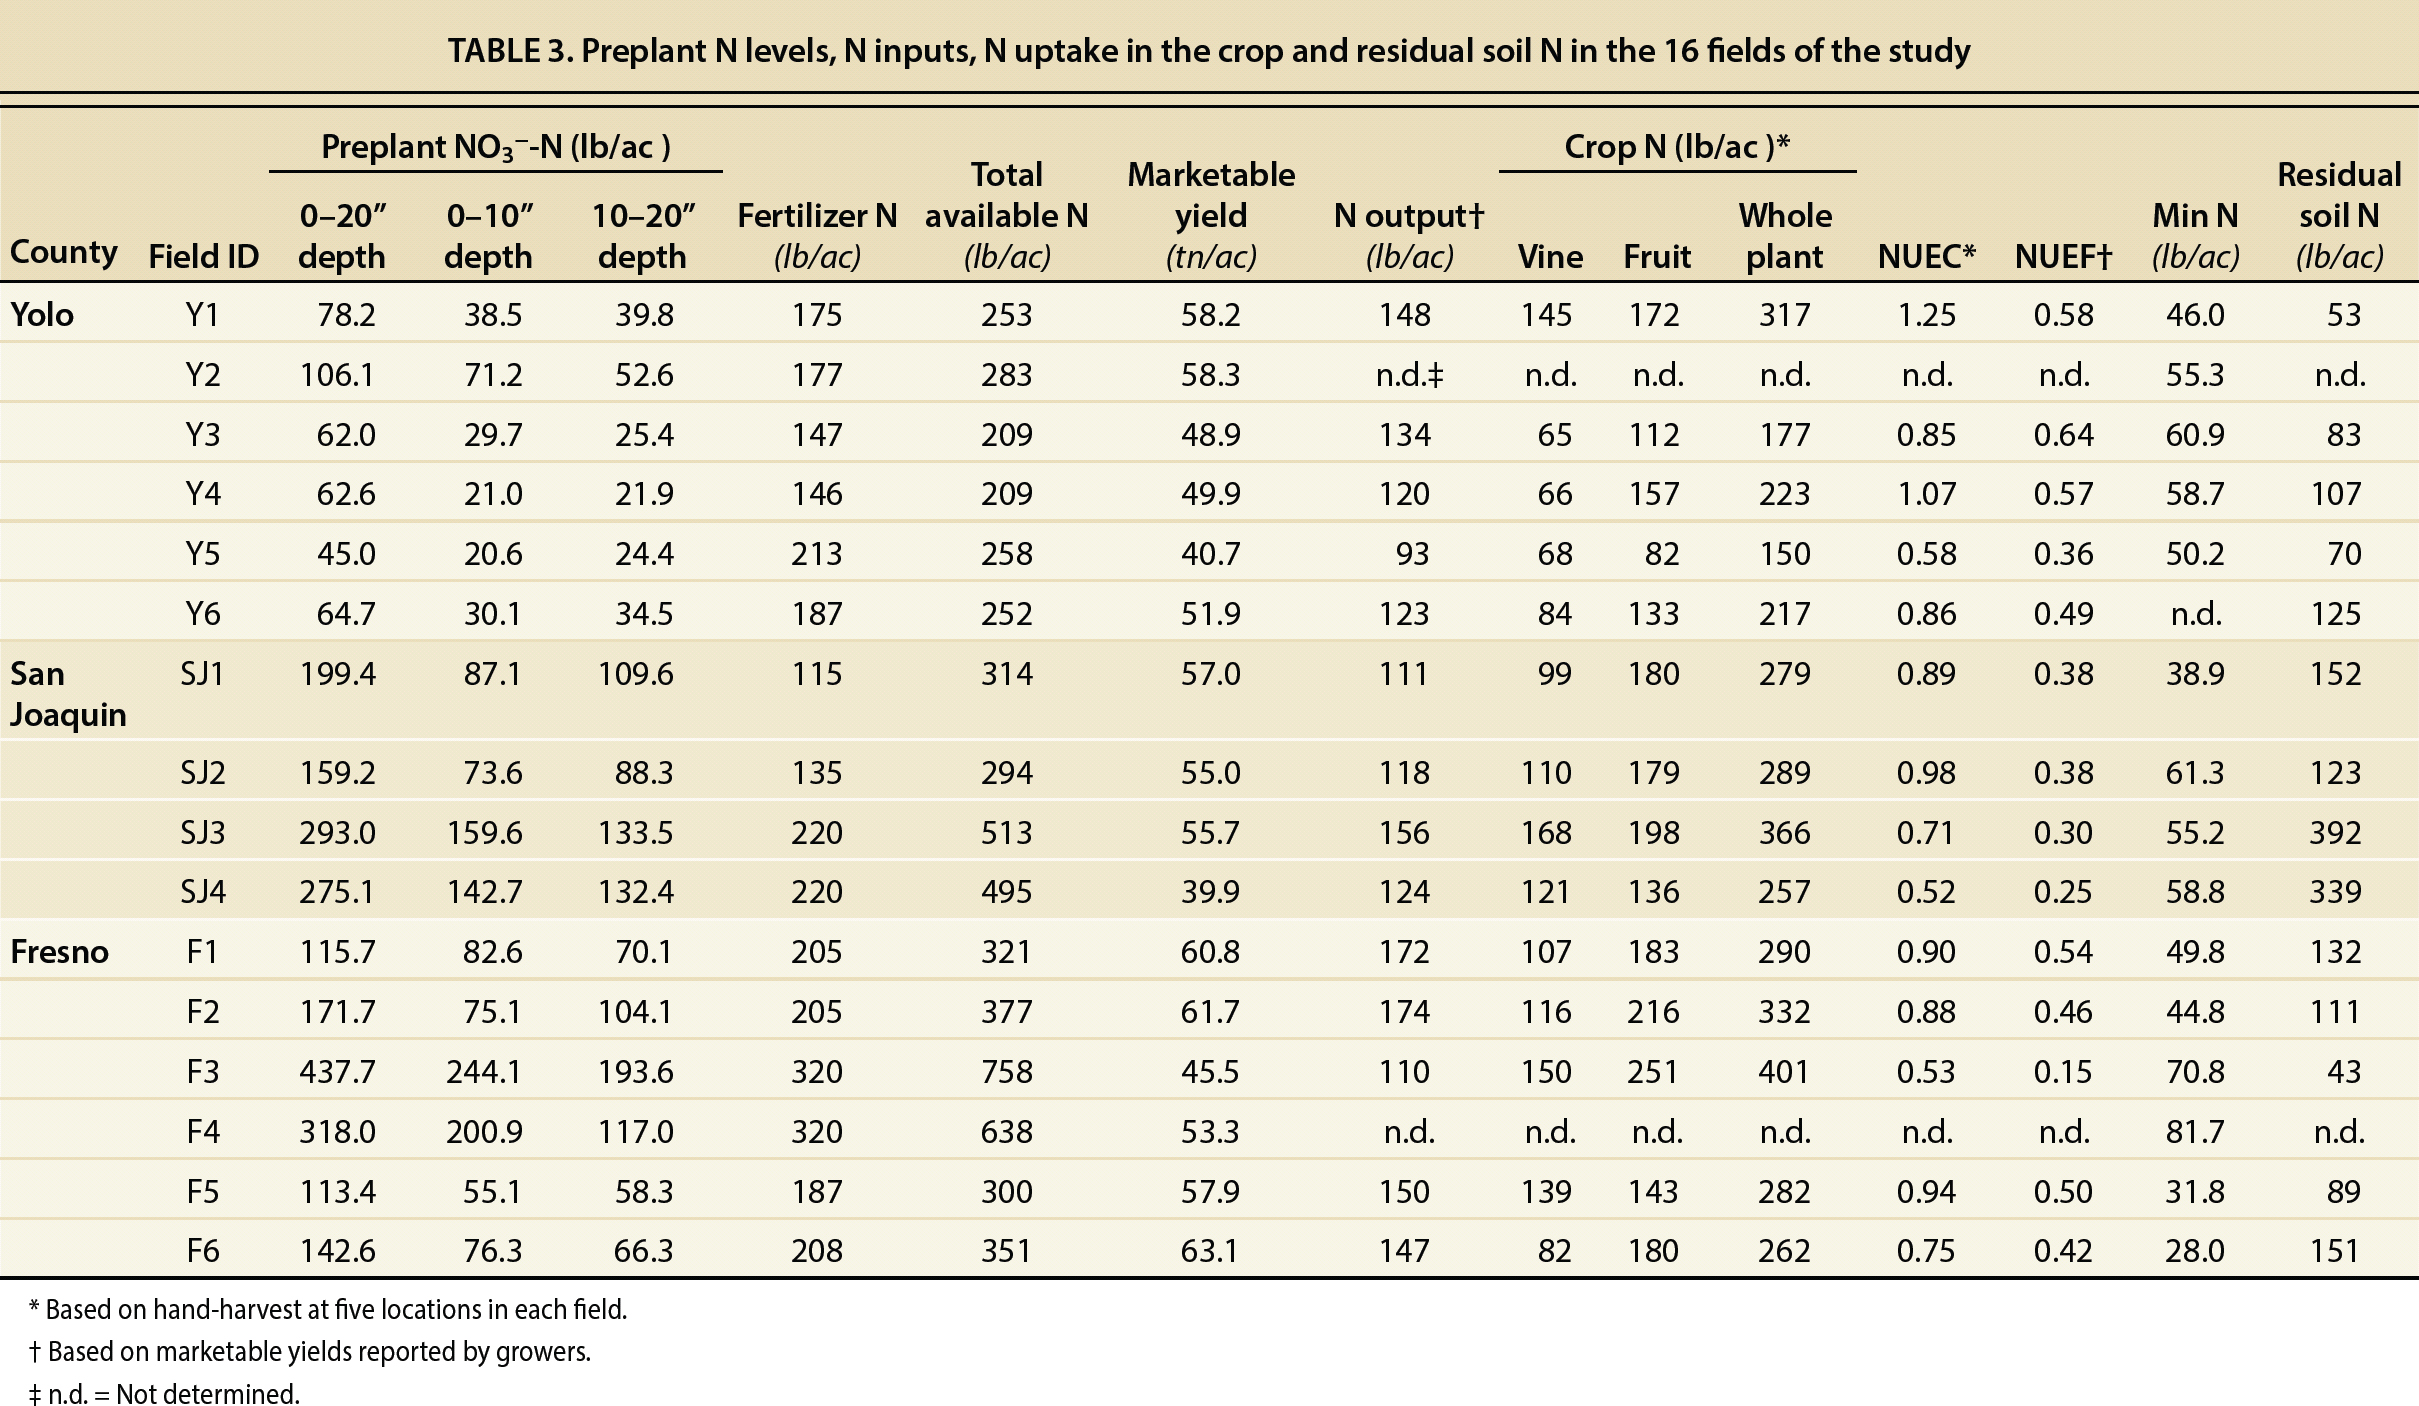
The growers reported seasonal fertilizer N inputs ranging from 115 to 320 lb/ac (129 to 360 kg/ha), bringing total available N (preplant NO3 and fertilizer N) to range from 209 to 758 lb/ac (235 to 852 kg/ha) (table 3). According to the hand-harvest data, average whole plant N uptake was 274 lb/ac (308 kg/ha), with a range of 150 to 401 lb/ac (167 to 451 kg/ha) among all the fields. The results of our survey suggest that N fertilization could be decreased without yield penalty in some of the fields, especially those in Fresno and San Joaquin counties.

Preplant N levels, N inputs, N uptake in the crop and residual soil N in the 16 fields of the study

TABLE 3. Preplant N levels, N inputs, N uptake in the crop and residual soil N in the 16 fields of the study

Preplant NO3 concentrations were positively correlated with the number of consecutive years that the fields were cropped with processing tomatoes (R2 = 0.67; p < 0.01). In Yolo County, the number of years of consecutive tomato was between 0 and 2, whereas in San Joaquin and Fresno counties it was between 0 and 5 (table 1). These differences in years of consecutive tomato production may, in part, explain the differences in preplant NO3 levels observed among the processing tomato growing areas. Another likely reason for the higher preplant NO3 levels in Fresno County may be the lower rainfall in this area. Lower precipitation and higher evaporation rates in Fresno may lower leaching and promote buildup of NO3 closer to the soil surface, whereas in Yolo County, which receives more rainfall, some of the residual NO3 may have been leached below 20 inches (50 cm) during the rainy season.

Crop marketable yield reported by the growers in the different fields ranged from 39.9 to 63.1 tn/ac (90.7 to 143.3 Mg/ha) (table 3), being higher in the Fresno (57.1 ± 2.9 tn/ac, or 130 ± 6.5 Mg/ha) than the San Joaquin and Yolo growing regions (51.9 ± 4 tn/ac, and 49.9 ± 2.6 tn/ac or 116.7 ± 9 Mg/ha and 112.3 ± 5.85 Mg/ha, respectively). Similar crop yields have been reported by Hartz and Bottoms (2009) for Yolo County.

Tomato plants took up between 150 and 401 lb/ac of N (table 3), of which they allocated between 82 and 251 lb/ac to fruit production, representing between 55% and 63% of total plant N. Fruit N allocation was, in most cases, lower than that reported by Hartz and Bottoms (2009) for processing tomatoes with adequate N fertilization. Across the 16 fields studied, the apparent NUEC was highly variable, ranging between 1.25 and 0.52 (table 3), and being higher for Yolo County (0.92 ± 0.11) than for Fresno and San Joaquin counties (0.80 ± 0.08 and 0.78 ± 0.10, respectively). Nitrogen outputs in the harvested crop ranged from 93 to 174 lb/ac (105 to 196 kg/ha; table 3), and the apparent N use efficiency of the harvested fruit (NUEF) was between 0.15 and 0.64 (table 3).

NUEC values close to or above 1 show that soil sources other than fertilizer or preplant N contributed to plant uptake. In-season soil mineralized N and NO3 in irrigation water can be substantial sources of N for the tomato plants in addition to fertilizer or preplant N. To estimate potential mineralizable N, subsamples of 10 grams of air-dried soil from the surface layer, 0 to 10 inches (0 to 25 cm), of the 16 fields were incubated in the laboratory under aerobic conditions at 55% water holding capacity. After 105 days, mineralization of organic N sources provided an average of 53 lb/ac (60 kg/ha) as NH4+ and NO3, with some fields producing as much as 82 lb/ac (91 kg/ha) (table 3). Earlier, Krusekopf et al. (2002), following a similar procedure, arrived at the same average estimate of mineralized N of 53.4 lb/ac (60 kg/ha) in a study involving 10 tomato fields in the Sacramento and San Joaquin valleys.

Vine biomass, which is incorporated into the soil after harvest, contributed an average input of 109 lb/ac (122 kg/ha) (table 3) and could represent a large part of this potentially mineralizable N pool. In addition to the N that becomes available during crop growth, NO3 in the irrigation water can also be a substantial source of N. No data was collected in this study regarding the NO3 content of irrigation water at the different fields. One of the growers reported that an average of 21 lb/ac (24 kg/ha) was supplied to the crop in the irrigation water. If these two N inputs (i.e., mineralization and irrigation water) are taken into account, then the actual crop NUE is lower than reported here.

In the present study, postharvest, or residual, NO3 concentrations measured to a depth of 20 inches ranged from 43 to 392 lb/ac NO3-N (48 to 441 kg/ha), with an average of 141 lb/ac NO3-N (159 kg/ha) (table 3). This survey showed high residual levels of NO3 in some tomato fields. Fields exhibiting low NUE and high levels of residual NO3 have a greater leaching potential during the irrigation season and/or during winter. These fields would benefit from fertilizer applications that are adjusted according to preplant soil NO3 concentrations.

Nutrient distribution

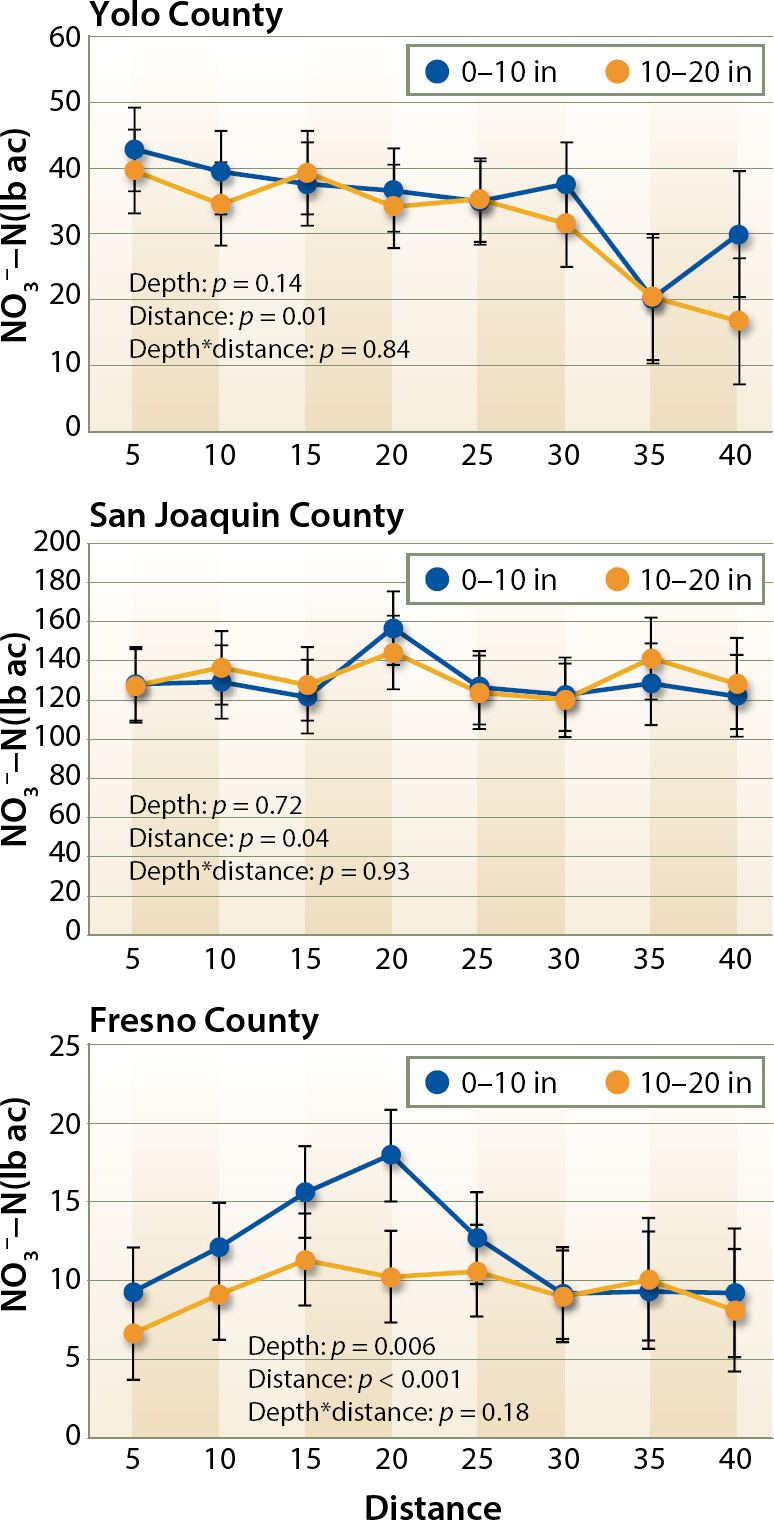
No general pattern in NO3-N distribution around the drip tape was observed across the 16 fields, although significant differences in NO3-N concentration between sampling distances from the center of the bed were observed for the majority of the 16 fields (data not shown). When the data was averaged across each growing region, fields from Fresno County showed a higher NO3-N concentration at 15 and 20 inches (38 and 51 cm) than 5 inches (13 cm) from the center of the bed, particularly in the upper layer, 0 to 10 inches (0 to 25 cm), of soil; whereas in Yolo County, NO3-N concentrations decreased with increasing distance from the drip tape (fig. 3).

Concentrations of NO3-N at the two sampling depth intervals (0 to 10 and 10 to 20 in) were generally similar. Significant differences were only observed in Fresno County (p < 0.01, fig. 3), supporting the hypothesis that in areas with lower precipitation, more NO3 may accumulate in the upper layer, whereas NO3 in the soil surface layer is leached to lower layers in areas receiving more precipitation, homogenizing NO3-N concentration in the soil profile.

NO3− content of the soil at different distances from the center of the bed and at two depth intervals (0 to 10, and 10 to 20 inches). Average NO3− content and standard errors by county for each layer and 5-inch lateral distance are shown. Statistical significance of the depth, distance and the interaction between them (depth*distance) is shown at each of the three growing regions.

Fig. 3. NO3 content of the soil at different distances from the center of the bed and at two depth intervals (0 to 10, and 10 to 20 inches). Average NO3 content and standard errors by county for each layer and 5-inch lateral distance are shown. Statistical significance of the depth, distance and the interaction between them (depth*distance) is shown at each of the three growing regions.

NO3 sampling protocol

With the information on preplant spatial distribution of nutrient concentrations, we elaborated a sampling protocol that accurately estimates the amount of NO3-N in the top 20 inches (50 cm) of SDI processing tomato fields. The protocol was based on a Minimax analysis by selecting the minimum number of samples within the field and locations within the bed (i.e., distances from the drip tape) that best estimated soil NO3-N based on the criterion of the minimum relative error from the field average. Briefly, for all the fields, the amounts of NO3-N in the two soil layers were summed for each sampling distance from the center. Subsequently, the averages of all possible combinations of sample locations within the bed or within the field were compared to the field average of all the measurements in a given field, and the relative errors were obtained according to the following formula:

where is the average NO3-N concentration for the given combination of 1, 2, 3, 4 or 5 sampling distances within the bed, and is the average NO3-N concentration of the field.

The combination of samples with the lowest relative error across all fields (< 5% from the field mean) and the lowest number of samples taken was selected as the best sampling procedure to estimate average soil NO3-N. Calculations were made separately for fields with 80-inch and 60-inch beds, with SAS version 9.1 statistical software.

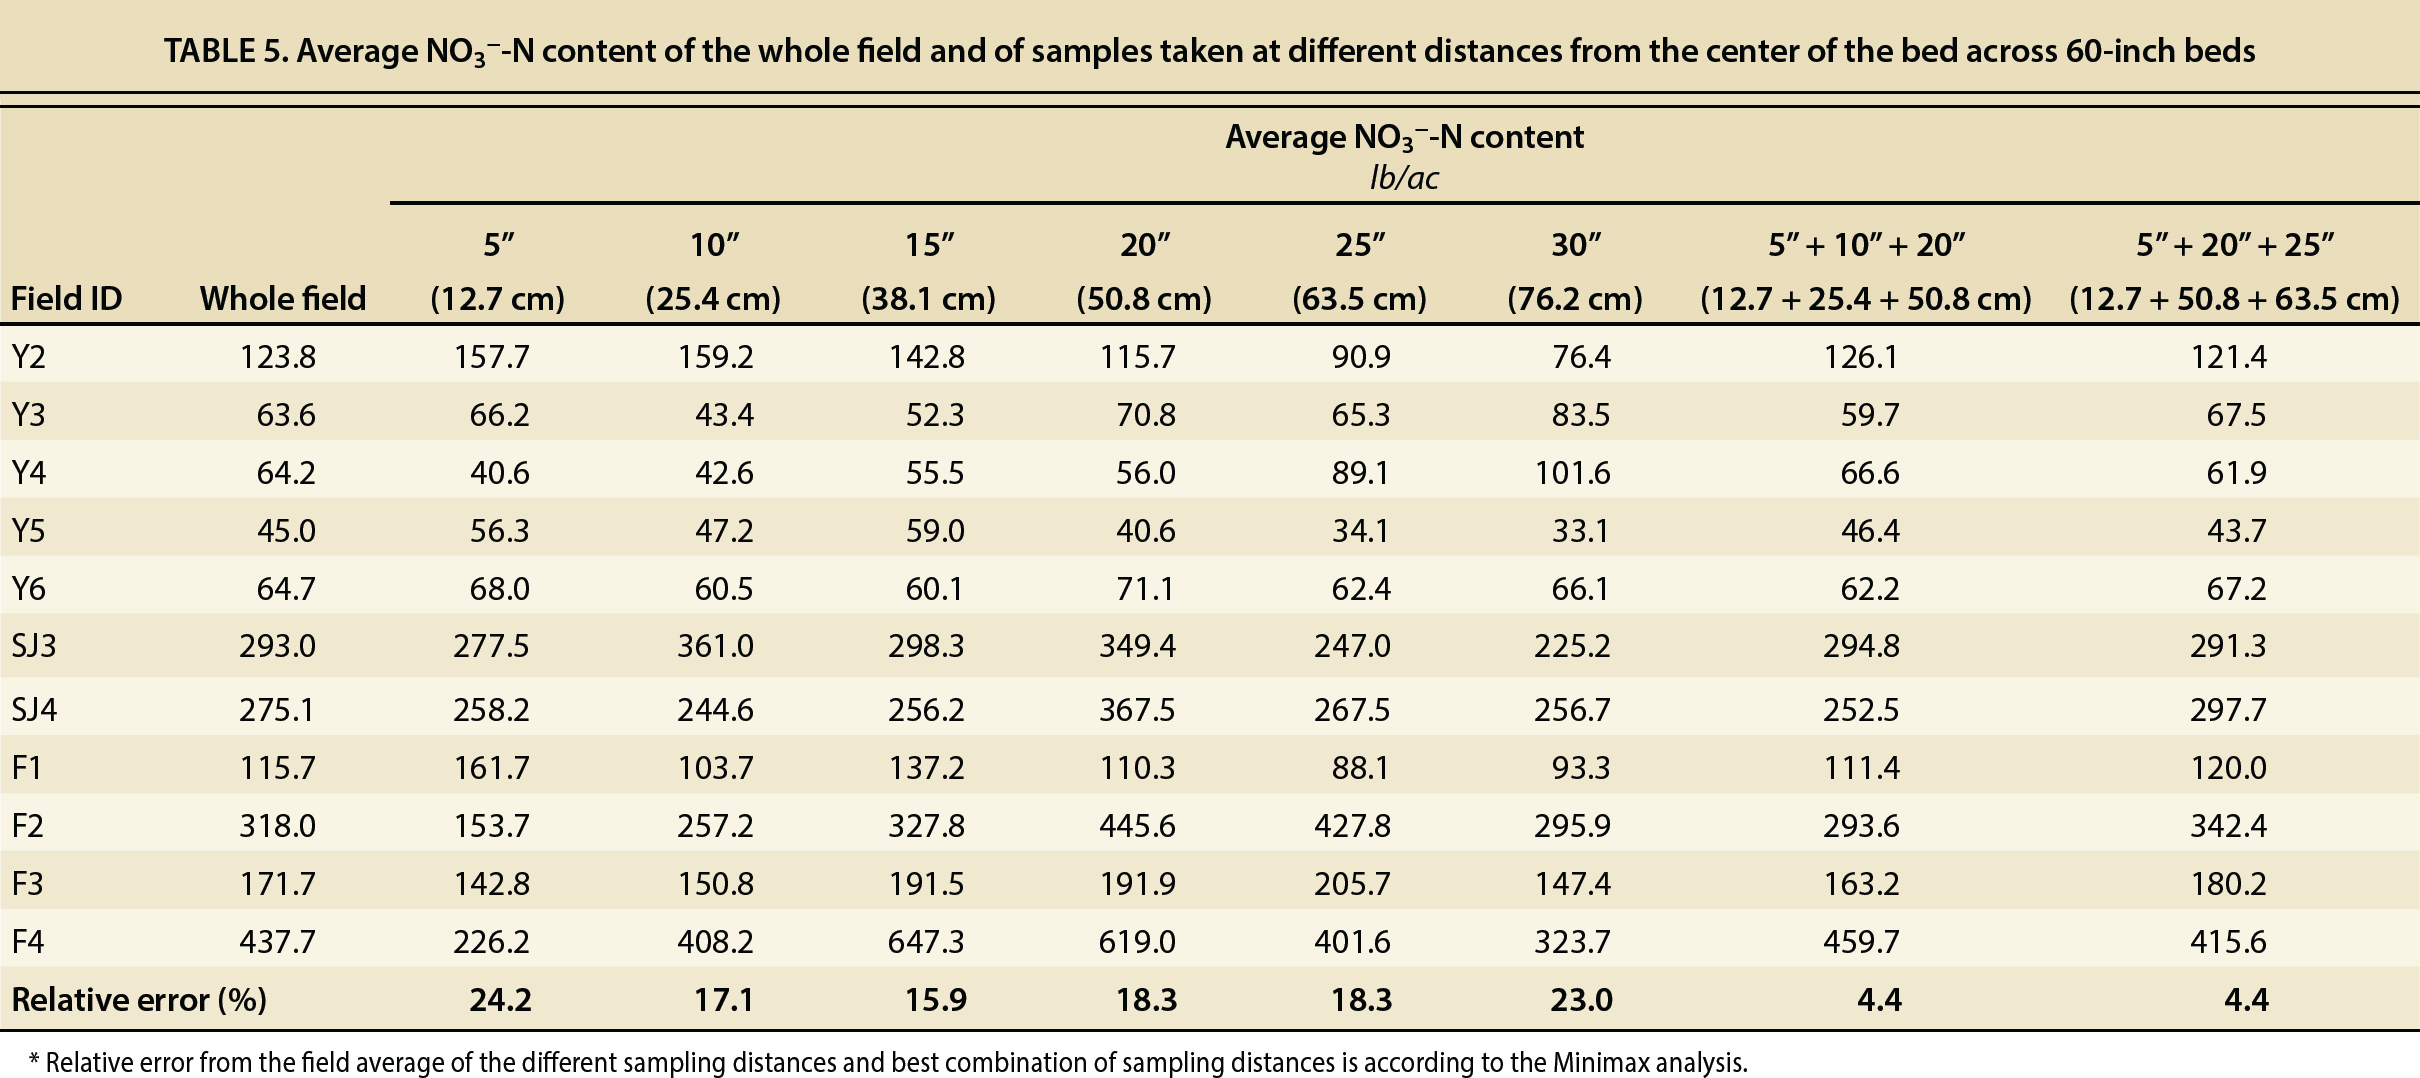
We found that in fields with 80-inch (2 m) beds taking two cores at 15 and 30 inches (38 and 76 cm) or at 20 and 25 inches (51 and 64 cm) from the bed center reduced the sampling error to 4% and 3%, respectively (table 4). For 60-inch (1.5 m) beds, taking three cores at 5, 10 and 20 inches (13, 25 and 51 cm) or at 5, 20 and 25 inches (13, 51 and 64 cm) reduced the sampling error to 4% of the field average (table 5). In addition, the Minimax analysis showed that these samples should be taken in at least four different locations within the field in 80-inch (2 m) beds, and in at least three locations in fields with 60-inch (1.5 m) beds.

Average NO3−-N content of the whole field and of samples taken at different distances from the center of the bed across 80-inch beds

TABLE 4. Average NO3-N content of the whole field and of samples taken at different distances from the center of the bed across 80-inch beds

Average NO3−-N content of the whole field and of samples taken at different distances from the center of the bed across 60-inch beds

TABLE 5. Average NO3-N content of the whole field and of samples taken at different distances from the center of the bed across 60-inch beds

This sampling method also guarantees the collection of representative samples for Olsen-P and exchangeable K. In the case of P, in the fields with 80-inch (2 m) beds, collecting two soil samples at 15 and 30 inches or at 20 and 25 inches from the bed center would result in a sampling error of 11% and 12%, respectively. In fields with 60-inch (1.5 m) beds, collecting three soil samples at 5, 10 and 20 inches or 5, 20 and 25 inches would yield a sampling error of 10% and 5%, respectively. In the case of exchangeable K, the sampling error would be significantly lower because of the higher homogeneity of this nutrient's distribution across the beds. In fields with 80-inch (2 m) beds, we observed a sampling error of 3% in either of the combination of sampling distances (15 and 30 inches or 20 and 25 inches) and in 60-inch (1.5 m) beds of 2% and 1%.

The data collected in this study provides a snapshot of current management practices and soil nutrient status for SDI processing tomatoes in California. It shows considerable buildup of residual NO3 in soils, particularly after several years of consecutive processing tomato cultivation. Regular preplant soil sampling using the protocol developed in this study would enable growers to adjust fertilizer rates, reduce the occurrence of excessive NO3 levels and detect suboptimal nutrient levels in their fields. Yet, how much of the pre-plant NO3 available can be accessed by the roots is contingent on the SDI wetting pattern, which may vary among fields depending on soil hydraulic properties.

Return to top

Author notes

We would like to thank the farm advisors Brenna J. Aegerter and Thomas Turini from UC ANR Cooperative Extension, who greatly contributed to the organization of the project and the search for collaborating growers. Authors are also grateful to the California Tomato Research Institute for financial support, as well as the processing tomato growers who participated in this study.

References

References

Cassman KG, Bryant DC, Roberts BA. Comparison of soil test methods for predicting cotton response to soil and fertilizer potassium on potassium-fixing soils. Commun Soil Sci Plant Anal. 1990. 21:1727-43. DOI: 10.1080/00103629009368336 [CrossRef]

Doane TA, Horwath WR. Spectrophotometric determination of nitrate with a single reagent. Anal Lett. 2003. 36:2713-22. DOI: 10.1081/al-120024647 [CrossRef]

Dumas J. Sur les procédés de l'analyse organique. Ann Chim 1848. pp.195-213.

Dzurella KN, Darby N, De La Mora A, et al. Nitrogen source reduction to protect groundwater. Technical report 3. Addressing Nitrate in California's Drinking Water with a Focus on Tulare Lake Basin and Salinas Valley Groundwater. 2012. UC Davis: Center for Watershed Sciences.

Geisseler D, Lundy M, Miyao G. Would a computer-based program be useful to improve irrigation and nitrogen management in processing tomatoes? Sacramento Valley Field Crops Newsletter, Winter 2015. 2015. UC Cooperative Extension Sutter-Yuba Counties. p. 1-2.

Hartz T. Potassium requirements for processing tomatoes. Special Edition: Processing Tomatoes in the San Joaquin Valley. Vegetable Crop Facts, Merced and Madera County. 2002. Merced: UC Cooperative Extension. p. 6-7.

Hartz T. Efficient fertigation management for drip-irrigated processing tomatoes. Edition 11: Processing Tomatoes. UC Cooperative Extension Vegetable Notes: Fresno, Tulare and Kings Counties. 2008. 4(1):2-3.

Hartz T, Bottoms T. Nitrogen requirements of drip-irrigated processing tomatoes. HortScience. 2009. 44:1988-93.

Hartz TK, Hanson B. Drip Irrigation and Fertigation Management of Processing Tomato. 2009. UC Vegetable Research and Information Center.

Hartz T, Johnstone P, Francis D, Miyao E. Processing tomato yield and fruit quality improved with potassium fertigation. HortScience. 2005. 40:1862-7.

Krusekopf H, Mitchell J, Hartz T, et al. Pre-sidedress soil nitrate testing identifies processing tomato fields not requiring sidedress N fertilizer. HortScience. 2002. 37(3):520-4.

Kuo S, Sparks DL, Page AL, Helmke PA, Loeppert RH. Phosphorus. Methods of Soil Analysis. Part 3, Chemical Methods. 1996. Madison, WI: SSSA.

Lecompte F, Bressoud F, Pares L, et al. Root and nitrate distribution as related to the critical plant N status of a fertigated tomato crop. J Hortic Sci Biotech. 2008. 83(2):223-31.

Miyao G. Fertilizer guidelines for processing tomatoes. Special Edition: Processing Tomatoes in the San Joaquin Valley. Vegetable Crop Facts, Merced and Madera County. 2002. Merced: UC Cooperative Extension.

Poch-Massegú R, Jiménez-Martínez J, Wallis KJ, et al. Irrigation return flow and nitrate leaching under different crops and irrigation methods in Western Mediterranean weather conditions. Agr Water Manage. 2014. 134:1-13.

Tei F, Benincasa P, Guiducci M. Critical nitrogen concentration in processing tomato. Eur J Agron. 2002. 18:45-55. DOI: 10.1016/s1161-0301(02)00096-5 [CrossRef]

Thomas GW, Page AL. Exchangeable cations. Methods of Soil Analysis, Part 2. Chemical and Microbiological Properties. 1982. Madison, WI: American Society of Agronomy. p. 159-65.

Citations

The challenge of nutrition management of processing tomatoes in an era of rising yield expectations
T.K. Hartz 2017. Acta Horticulturae (1159):1
http://dx.doi.org/10.17660/ActaHortic.2017.1159.1

Soil testing for P and K has value in nutrient management for annual crops
Daniel Geisseler and Gene Miyao 2016. California Agriculture 70(3):152
http://dx.doi.org/10.3733/ca.2016a0007

Soil nitrate testing supports nitrogen management in irrigated annual crops
Patricia A. Lazicki and Daniel Geisseler 2017. California Agriculture 71(2):90
http://dx.doi.org/10.3733/ca.2016a0027

Soil sampling protocol reliably estimates preplant NO3− in SDI tomatoes

Cristina Lazcano, Jordon Wade, William R. Horwath, Martin Burger
Webmaster Email: sjosterman@ucanr.edu

Soil sampling protocol reliably estimates preplant NO3 in SDI tomatoes

Share using any of the popular social networks Share by sending an email Print article

Authors

Cristina Lazcano, UC Davis
Jordon Wade, UC Davis
William R. Horwath, UC Davis
Martin Burger, UC Davis

Publication Information

California Agriculture 69(4):222-229. https://doi.org/10.3733/ca.v069n04p222

Published online October 01, 2015

PDF  |  Citation  |  Permissions  |  Cited by 3 articles

Author Affiliations show

Abstract

Subsurface drip irrigation (SDI), because it can precisely deliver nutrients close to plant roots, could lead to carefully determined applications of fertilizer to meet crop needs and less risk of nitrate (NO3-) leaching to groundwater. Appropriate fertilizer applications, however, depend on an accurate assessment of the spatial distribution of the main plant macronutrients (N, P and K) in the soil profile before planting. To develop nutrient sampling guidelines, we determined the spatial distributions of preplant nitrate (NO3-), bicarbonate extractable phosphorus (Olsen-P) and exchangeable potassium (K) in the top 20 inches (50 centimeters) of subsurface drip irrigated processing tomato fields in three of the main growing regions in the Central Valley of California. Nutrient distribution varied with depth (P and K), distance from the center of the bed (NO3-) and growing region (NO3- and K). No depletion of NO3-, Olsen-P or K in the root feeding areas close to the drip tape was detected. Preplant NO3- ranged considerably, from 45 to 438 pounds N per acre (50 to 491 kilograms/hectare), the higher levels in fields with consecutive crops of tomatoes. A sampling protocol that growers could use, developed from analysis of the distribution results, provided reliable estimates of preplant NO3- as well as P and K in all surveyed fields.

Full text

Subsurface drip irrigation (SDI) allows for a precise delivery of water and nutrients close to plant roots, making it possible for growers to increase water and nutrient use efficiency and crop yields.

Efficient use of nitrogen (N) is gaining importance in terms of lowering the risk of nitrate (NO3) leaching into groundwater during the rainy and irrigation seasons. Avoiding a buildup of large surpluses of residual N is feasible under SDI if the available N at preplant can be reliably quantified. Our primary goal in this study was to develop guidelines on how to reliably, efficiently and economically sample for preplant NO3 in processing tomato fields under SDI.

Although subsurface drip irrigation is widely used in California to produce processing tomatoes, knowledge of nutrient distribution at preplant is limited. To address this, UC researchers developed a sampling protocol that can be used to estimate preplant levels of nitrate, phosphorus and potassium.

Although subsurface drip irrigation is widely used in California to produce processing tomatoes, knowledge of nutrient distribution at preplant is limited. To address this, UC researchers developed a sampling protocol that can be used to estimate preplant levels of nitrate, phosphorus and potassium.

A recent survey among tomato growers showed that soil NO3 is determined in only a limited number of fields every year at preplant (Geisseler et al. 2015). Currently, N fertilizer rates for processing tomatoes of about 178 pounds per acre (lb/ac) (200 kilograms per hectare [kg/ha]) are recommended under SDI (Hartz and Bottoms 2009; Tei et al. 2002). Tomato plants take up an average of 263 lb/ac (296 kg/ha), with 71% of the N allocated to the fruit by harvest (Hartz and Bottoms 2009). N concentration in fruit at optimum fertilization rates has been reported as 4.47 pounds per U.S. ton (lb/US tn) (2.24 kilograms per megagram [kg/Mg]) marketable fruit (Tei et al. 2002).

Mineral fertilizer is considered the main source of N in conventionally managed tomato systems, but other sources such as soil residual, or carryover, NO3, mineralization of soil organic matter, and NO3 in irrigation water contribute to the supply of crop-available N. The latter sources are often not considered in fertilizer rate calculations, and as a result, N inputs can be in excess of crop need.

There are several difficulties in estimating preplant NO3 levels, a concern mentioned in Dzurella et al. (2012): (1) NO3 is one of the plant nutrients with the highest mobility, and therefore highest spatial variability, in soils, which makes it difficult to estimate total available N. (2) Under SDI, NO3 may accumulate at the periphery of the wetted soil volume and be depleted where roots proliferate at high density, such as near the drip tape emitter (Lecompte et al. 2008). As a consequence, NO3 concentration in furrows can be up to 16 times higher than in the center of the bed (Lecompte et al. 2008). (3) NO3 concentration and spatial distribution might be affected by ratios of atmospheric precipitation to evapotranspiration (ET).

The extent and distribution of precipitation determines NO3 leaching potential, especially under Mediterranean climate conditions (Poch-Massegú et al. 2014), with greater downward movement of NO3 occurring seasonally; whereas atmospheric variables, such as temperature, affect NO3 movement through their influence on evapotranspiration rates. Both irrigation management and weather conditions affect NO3 levels and spatial distribution. Therefore, measurements under varied climatic conditions are necessary to assess the extent such factors have on NO3 distribution in drip-irrigated processing tomato fields.

Unlike NO3, phosphorous (P) and potassium (K) are less mobile in the soil profile. While less mobility reduces the loss of these nutrients through leaching, it also limits diffusion from enriched soil patches outside of the root growth zone. As a result, fields with several years of SDI cultivation might present a characteristic depletion within the root zone, where nutrient uptake is most intense (Hartz and Hanson 2009).

In spite of the widespread use of SDI in processing tomatoes, there is a lack of knowledge of the spatial distribution of the main plant macronutrients (N, P and K) at preplant. Complicating this further, management practices (i.e., rotations, continuous SDI cultivation) and climatic factors (i.e., precipitation and evapotranspiration) influence the spatial distribution of these nutrients.

We carried out a survey to address the lack of knowledge in this area: we assessed preplant distribution of NO3, extractable P and exchangeable K in relation to the SDI line in commercial processing tomato fields. Crop N uptake and nitrogen use efficiency were evaluated in relation to preplant inorganic N levels and fertilizer N inputs in order to evaluate the performance of current practices of SDI processing tomato production. The main goal, as mentioned above, was to develop guidelines on the simplest way to reliably assess preplant NO3.

Sampling sites, procedures

A total of 16 commercial processing tomato production fields were selected for the study. Fields were located along a transect of a decreasing ratio of precipitation to potential evapotranspiration (ETo), with six fields in Yolo County (ETo = 1.01), four in San Joaquin County (ETo = 0.54) and six in Fresno County (ETo = 0.31), three of the growing regions with the largest production of processing tomatoes in the state.

The selected fields had been cultivated under SDI for a minimum of 2 and a maximum of 9 years. Fields comprised a range of different management conditions typical of processing tomato production in California, including different bed sizes (60 versus 80 inches [in], or 1.5 versus 2 meters [m]), the number of consecutive years in tomato production and the planting of fall/winter crops in the fields (table 1).

Main characteristics and management practices of the 16 fields sampled

TABLE 1. Main characteristics and management practices of the 16 fields sampled

Preplant soil sampling was carried out in all 16 fields from late February to mid-May, depending on the planting schedule and before the application of any fertilizers. In each field, five random locations were selected and a systematic sampling was carried out using a soil probe at regular (5 in, or 13 centimeter [cm]) intervals from the center of the bed to the center of the furrow. At each sampling point, two sets of soil from 0 to 10, and 10 to 20 inches (0 to 25, and 25 and 50 cm) in depth were taken and composited per depth. The exact position of the five sampling locations (± 9.8 feet, or 3 m) was recorded using GPS latitude-longitude coordinates in order to collect plant and soil samples from the same locations at harvest. Harvest NO3 concentrations were measured before the incorporation of vine residue by taking one core 10 inches from the center of the bed to a depth of 20 inches at each of the five locations per field.

Preplant soil samples were collected at 5-inch intervals from the center of the bed towards the center of the furrow.

Preplant soil samples were collected at 5-inch intervals from the center of the bed towards the center of the furrow.

Analysis of soil samples

The soil samples were stored in plastic bags, transported to the laboratory and stored at 4°C. Gravimetric soil moisture content was determined immediately after collection by drying a subsample at 221°F (105°C). In addition, a 10-gram subsample was immediately extracted with 2M potassium chloride (KCl) solution for the colorimetric analysis of NO3 concentration (Doane and Horwath 2003). Available Olsen-P was analyzed colorimetrically after extraction with sodium bicarbonate (NaHCO3) (Kuo 1996). Exchangeable K was determined by inductively coupled plasma atomic emission spectrometry (ICP-AES) on an air-dried and ground preplant soil subsample after extraction with ammonium acetate (Thomas 1982).

N uptake and use efficiency

Crop N uptake was determined by hand-harvest at the preplant sampling locations. Briefly, we sampled a length of 1 meter along the bed and all plants within this meter were counted and cut at soil level. Fruit and vines were separated, weighed and a subsample of both components selected for further determination of dry mass and percentage N (% N) through dry combustion on a C and N analyzer (Costech Analytical Technologies Inc., Valencia, CA) (Dumas 1848).

Vine and fruit biomass and % N per plant were calculated and then extrapolated to the rest of the field using plant density of the area harvested. Apparent nitrogen use efficiency of the tomato crop (NUEC) was calculated as the ratio between N uptake by the tomato crop, including fruit and vine sampled at each field, and the available N, taking into account both the preplant soil NO3 and the fertilizer inputs reported by the growers.

Nitrogen outputs were calculated based on the marketable yields reported by the growers and the average N content of the fruit sampled from the hand-harvest plots. Apparent nitrogen use efficiency of the harvested fruit (NUEF) was calculated as the ratio between N outputs in the harvested fruit and the available N, including preplant soil NO3 and fertilizer inputs.

Weighing of the vine biomass, left, and fruit biomass, right, collected at each location within a field. Vine biomass, which is incorporated into the soil after harvest, contributed an average N input of 109 lb/ac.

Weighing of the vine biomass, left, and fruit biomass, right, collected at each location within a field. Vine biomass, which is incorporated into the soil after harvest, contributed an average N input of 109 lb/ac.

P levels and distribution

Twelve of the 16 fields showed significantly higher Olsen-P concentration in the upper layer of soil than the deeper layer (fig. 1). Concentrations were homogeneous across the beds, with only two fields showing significant differences between sampling points (data not shown). Significant differences in extractable P between sampling distances from the center of the bed were observed in the Yolo growing region, with higher concentrations closer to the center of the bed (fig. 1).

Change in PO4− content of the soil at different distances from the center of the bed and at two depth intervals (0 to 10, and 10 to 20 inches) in Yolo, San Joaquin and Fresno counties. Statistical significance of the depth, distance and the interaction between them (depth*distance) is shown at each of the three growing regions.

Fig. 1. Change in PO4 content of the soil at different distances from the center of the bed and at two depth intervals (0 to 10, and 10 to 20 inches) in Yolo, San Joaquin and Fresno counties. Statistical significance of the depth, distance and the interaction between them (depth*distance) is shown at each of the three growing regions.

No significant differences between growing regions were detected (p = 0.77), although average concentrations in the 0 to 20 inches soil layer tended to be highest in the Fresno (13.7 ± 3.1 parts per million, ppm) area, followed by the Yolo and San Joaquin areas (12 ± 1.7 and 10.6 ± 2.9 ppm, respectively).

Our study showed that Olsen-P was not lower within the root growth area than outside of it. This finding was in contrast to the earlier suggestion that the amount of available P can substantially decline close to the drip tape because of concentrated root feeding (Hartz and Hanson 2009). In fact, in this study, within the Yolo County area, Olsen-P concentrations were higher closer to the center of the bed and decreased toward the furrows.

The majority of the fields in this study showed average P concentrations lower than 15 ppm in both layers (table 2), within the threshold value of 12 to 20 ppm, where there is potential for a yield response to a P application. Generally, fields with < 15 ppm of available P would respond to a P application, whereas fields with more than 25 ppm would be unlikely to do so (Hartz 2008). In this study, only one of the fields had extractable P higher than 25 ppm. These results show that some of the fields could benefit from additional P fertilization, yet current fertilization practices are effective in avoiding P depletion in the root-feeding zone.

Preplant concentration of Olsen-P and exchangeable K in the 16 fields sampled

TABLE 2. Preplant concentration of Olsen-P and exchangeable K in the 16 fields sampled

K levels and distribution

Soil exchangeable K content was mostly homogeneous within the beds, and no depletion was observed close to the drip tape in any of the three growing areas (fig. 2). The lack of K depletion in the root zone may be because potassium can easily be supplied through fertigation, with the advantage of little potential for fixation before the plants take it up since K fixation in interlayer sites of soil minerals mainly takes place during drying following water additions (Cassman et al. 1990). As shown in table 2, average field exchangeable K concentrations were generally high and well above 130 to 150 ppm (0.33 to 0.38 meq/100 g [grams]), which has been defined as the threshold for yield responses in furrow-irrigated processing tomato in California (Hartz 2002; Hartz and Hanson 2009; Miyao 2002).

Exchangeable K content of the soil at different distances from the center of the bed and at two depth intervals (0 to 10, and 10 to 20 inches) in Yolo, San Joaquin and Fresno counties. Statistical significance of the depth, distance and the interaction between them (depth*distance) is shown at each of the three growing regions.

Fig. 2. Exchangeable K content of the soil at different distances from the center of the bed and at two depth intervals (0 to 10, and 10 to 20 inches) in Yolo, San Joaquin and Fresno counties. Statistical significance of the depth, distance and the interaction between them (depth*distance) is shown at each of the three growing regions.

For drip irrigation, yield thresholds have been estimated to be higher at 200 to 300 ppm (0.51 to 0.77 meq/100 g), although there is still limited information available in this respect (Hartz and Hanson 2009). All fields were above 200 ppm (0.51 meq/100 g), meaning that yield increases resulting from K additions could not be expected; however, K applications benefit fruit quality even at levels that are not yield limiting (Hartz et al. 2005).

High exchangeable K is not rare in processing tomato soils; concentrations ranging from 187 to 331 ppm (0.48 to 0.85 meq/100 g) have been previously reported for the Yolo growing region (Hartz et al. 2005). Concentrations reported in our survey are, however, well over these values, particularly in Fresno County (1.20 ± 0.12 meq/100 g) followed by San Joaquin (0.95 ± 0.14 meq/100 g) and Yolo counties (0.75 ± 0.12 meq/100 g), with significant differences between the three growing areas (p < 0.01). Exchangeable K was similar at the two depths in Yolo County (fig. 2), whereas K concentrations were higher in the upper soil layer in Fresno and San Joaquin counties (p < 0.01 and p < 0.05, respectively). In the fields in San Joaquin County, K concentration tended to decrease from the center of the bed toward the furrow.

NO3 levels and NUE

Preplant NO3-N in the depth interval of 0 to 20 inches (0 to 50 cm) ranged from 45 to 438 lb/ac (50 to 491 kg/ha) among all the fields. The average NO3-N content in this layer was significantly higher in San Joaquin and Fresno counties (232 ± 31 and 216 ± 54 lb/ac, or 261 ± 34 and 243 ± 61 tn/ha, respectively) than in Yolo County (70 ± 8 lb/ac, or 79 ± 9 tn/ha) (p < 0.001).

The growers reported seasonal fertilizer N inputs ranging from 115 to 320 lb/ac (129 to 360 kg/ha), bringing total available N (preplant NO3 and fertilizer N) to range from 209 to 758 lb/ac (235 to 852 kg/ha) (table 3). According to the hand-harvest data, average whole plant N uptake was 274 lb/ac (308 kg/ha), with a range of 150 to 401 lb/ac (167 to 451 kg/ha) among all the fields. The results of our survey suggest that N fertilization could be decreased without yield penalty in some of the fields, especially those in Fresno and San Joaquin counties.

Preplant N levels, N inputs, N uptake in the crop and residual soil N in the 16 fields of the study

TABLE 3. Preplant N levels, N inputs, N uptake in the crop and residual soil N in the 16 fields of the study

Preplant NO3 concentrations were positively correlated with the number of consecutive years that the fields were cropped with processing tomatoes (R2 = 0.67; p < 0.01). In Yolo County, the number of years of consecutive tomato was between 0 and 2, whereas in San Joaquin and Fresno counties it was between 0 and 5 (table 1). These differences in years of consecutive tomato production may, in part, explain the differences in preplant NO3 levels observed among the processing tomato growing areas. Another likely reason for the higher preplant NO3 levels in Fresno County may be the lower rainfall in this area. Lower precipitation and higher evaporation rates in Fresno may lower leaching and promote buildup of NO3 closer to the soil surface, whereas in Yolo County, which receives more rainfall, some of the residual NO3 may have been leached below 20 inches (50 cm) during the rainy season.

Crop marketable yield reported by the growers in the different fields ranged from 39.9 to 63.1 tn/ac (90.7 to 143.3 Mg/ha) (table 3), being higher in the Fresno (57.1 ± 2.9 tn/ac, or 130 ± 6.5 Mg/ha) than the San Joaquin and Yolo growing regions (51.9 ± 4 tn/ac, and 49.9 ± 2.6 tn/ac or 116.7 ± 9 Mg/ha and 112.3 ± 5.85 Mg/ha, respectively). Similar crop yields have been reported by Hartz and Bottoms (2009) for Yolo County.

Tomato plants took up between 150 and 401 lb/ac of N (table 3), of which they allocated between 82 and 251 lb/ac to fruit production, representing between 55% and 63% of total plant N. Fruit N allocation was, in most cases, lower than that reported by Hartz and Bottoms (2009) for processing tomatoes with adequate N fertilization. Across the 16 fields studied, the apparent NUEC was highly variable, ranging between 1.25 and 0.52 (table 3), and being higher for Yolo County (0.92 ± 0.11) than for Fresno and San Joaquin counties (0.80 ± 0.08 and 0.78 ± 0.10, respectively). Nitrogen outputs in the harvested crop ranged from 93 to 174 lb/ac (105 to 196 kg/ha; table 3), and the apparent N use efficiency of the harvested fruit (NUEF) was between 0.15 and 0.64 (table 3).

NUEC values close to or above 1 show that soil sources other than fertilizer or preplant N contributed to plant uptake. In-season soil mineralized N and NO3 in irrigation water can be substantial sources of N for the tomato plants in addition to fertilizer or preplant N. To estimate potential mineralizable N, subsamples of 10 grams of air-dried soil from the surface layer, 0 to 10 inches (0 to 25 cm), of the 16 fields were incubated in the laboratory under aerobic conditions at 55% water holding capacity. After 105 days, mineralization of organic N sources provided an average of 53 lb/ac (60 kg/ha) as NH4+ and NO3, with some fields producing as much as 82 lb/ac (91 kg/ha) (table 3). Earlier, Krusekopf et al. (2002), following a similar procedure, arrived at the same average estimate of mineralized N of 53.4 lb/ac (60 kg/ha) in a study involving 10 tomato fields in the Sacramento and San Joaquin valleys.

Vine biomass, which is incorporated into the soil after harvest, contributed an average input of 109 lb/ac (122 kg/ha) (table 3) and could represent a large part of this potentially mineralizable N pool. In addition to the N that becomes available during crop growth, NO3 in the irrigation water can also be a substantial source of N. No data was collected in this study regarding the NO3 content of irrigation water at the different fields. One of the growers reported that an average of 21 lb/ac (24 kg/ha) was supplied to the crop in the irrigation water. If these two N inputs (i.e., mineralization and irrigation water) are taken into account, then the actual crop NUE is lower than reported here.

In the present study, postharvest, or residual, NO3 concentrations measured to a depth of 20 inches ranged from 43 to 392 lb/ac NO3-N (48 to 441 kg/ha), with an average of 141 lb/ac NO3-N (159 kg/ha) (table 3). This survey showed high residual levels of NO3 in some tomato fields. Fields exhibiting low NUE and high levels of residual NO3 have a greater leaching potential during the irrigation season and/or during winter. These fields would benefit from fertilizer applications that are adjusted according to preplant soil NO3 concentrations.

Nutrient distribution

No general pattern in NO3-N distribution around the drip tape was observed across the 16 fields, although significant differences in NO3-N concentration between sampling distances from the center of the bed were observed for the majority of the 16 fields (data not shown). When the data was averaged across each growing region, fields from Fresno County showed a higher NO3-N concentration at 15 and 20 inches (38 and 51 cm) than 5 inches (13 cm) from the center of the bed, particularly in the upper layer, 0 to 10 inches (0 to 25 cm), of soil; whereas in Yolo County, NO3-N concentrations decreased with increasing distance from the drip tape (fig. 3).

Concentrations of NO3-N at the two sampling depth intervals (0 to 10 and 10 to 20 in) were generally similar. Significant differences were only observed in Fresno County (p < 0.01, fig. 3), supporting the hypothesis that in areas with lower precipitation, more NO3 may accumulate in the upper layer, whereas NO3 in the soil surface layer is leached to lower layers in areas receiving more precipitation, homogenizing NO3-N concentration in the soil profile.

NO3− content of the soil at different distances from the center of the bed and at two depth intervals (0 to 10, and 10 to 20 inches). Average NO3− content and standard errors by county for each layer and 5-inch lateral distance are shown. Statistical significance of the depth, distance and the interaction between them (depth*distance) is shown at each of the three growing regions.

Fig. 3. NO3 content of the soil at different distances from the center of the bed and at two depth intervals (0 to 10, and 10 to 20 inches). Average NO3 content and standard errors by county for each layer and 5-inch lateral distance are shown. Statistical significance of the depth, distance and the interaction between them (depth*distance) is shown at each of the three growing regions.

NO3 sampling protocol

With the information on preplant spatial distribution of nutrient concentrations, we elaborated a sampling protocol that accurately estimates the amount of NO3-N in the top 20 inches (50 cm) of SDI processing tomato fields. The protocol was based on a Minimax analysis by selecting the minimum number of samples within the field and locations within the bed (i.e., distances from the drip tape) that best estimated soil NO3-N based on the criterion of the minimum relative error from the field average. Briefly, for all the fields, the amounts of NO3-N in the two soil layers were summed for each sampling distance from the center. Subsequently, the averages of all possible combinations of sample locations within the bed or within the field were compared to the field average of all the measurements in a given field, and the relative errors were obtained according to the following formula:

where is the average NO3-N concentration for the given combination of 1, 2, 3, 4 or 5 sampling distances within the bed, and is the average NO3-N concentration of the field.

The combination of samples with the lowest relative error across all fields (< 5% from the field mean) and the lowest number of samples taken was selected as the best sampling procedure to estimate average soil NO3-N. Calculations were made separately for fields with 80-inch and 60-inch beds, with SAS version 9.1 statistical software.

We found that in fields with 80-inch (2 m) beds taking two cores at 15 and 30 inches (38 and 76 cm) or at 20 and 25 inches (51 and 64 cm) from the bed center reduced the sampling error to 4% and 3%, respectively (table 4). For 60-inch (1.5 m) beds, taking three cores at 5, 10 and 20 inches (13, 25 and 51 cm) or at 5, 20 and 25 inches (13, 51 and 64 cm) reduced the sampling error to 4% of the field average (table 5). In addition, the Minimax analysis showed that these samples should be taken in at least four different locations within the field in 80-inch (2 m) beds, and in at least three locations in fields with 60-inch (1.5 m) beds.

Average NO3−-N content of the whole field and of samples taken at different distances from the center of the bed across 80-inch beds

TABLE 4. Average NO3-N content of the whole field and of samples taken at different distances from the center of the bed across 80-inch beds

Average NO3−-N content of the whole field and of samples taken at different distances from the center of the bed across 60-inch beds

TABLE 5. Average NO3-N content of the whole field and of samples taken at different distances from the center of the bed across 60-inch beds

This sampling method also guarantees the collection of representative samples for Olsen-P and exchangeable K. In the case of P, in the fields with 80-inch (2 m) beds, collecting two soil samples at 15 and 30 inches or at 20 and 25 inches from the bed center would result in a sampling error of 11% and 12%, respectively. In fields with 60-inch (1.5 m) beds, collecting three soil samples at 5, 10 and 20 inches or 5, 20 and 25 inches would yield a sampling error of 10% and 5%, respectively. In the case of exchangeable K, the sampling error would be significantly lower because of the higher homogeneity of this nutrient's distribution across the beds. In fields with 80-inch (2 m) beds, we observed a sampling error of 3% in either of the combination of sampling distances (15 and 30 inches or 20 and 25 inches) and in 60-inch (1.5 m) beds of 2% and 1%.

The data collected in this study provides a snapshot of current management practices and soil nutrient status for SDI processing tomatoes in California. It shows considerable buildup of residual NO3 in soils, particularly after several years of consecutive processing tomato cultivation. Regular preplant soil sampling using the protocol developed in this study would enable growers to adjust fertilizer rates, reduce the occurrence of excessive NO3 levels and detect suboptimal nutrient levels in their fields. Yet, how much of the pre-plant NO3 available can be accessed by the roots is contingent on the SDI wetting pattern, which may vary among fields depending on soil hydraulic properties.

Return to top

Author notes

We would like to thank the farm advisors Brenna J. Aegerter and Thomas Turini from UC ANR Cooperative Extension, who greatly contributed to the organization of the project and the search for collaborating growers. Authors are also grateful to the California Tomato Research Institute for financial support, as well as the processing tomato growers who participated in this study.

References

References

Cassman KG, Bryant DC, Roberts BA. Comparison of soil test methods for predicting cotton response to soil and fertilizer potassium on potassium-fixing soils. Commun Soil Sci Plant Anal. 1990. 21:1727-43. DOI: 10.1080/00103629009368336 [CrossRef]

Doane TA, Horwath WR. Spectrophotometric determination of nitrate with a single reagent. Anal Lett. 2003. 36:2713-22. DOI: 10.1081/al-120024647 [CrossRef]

Dumas J. Sur les procédés de l'analyse organique. Ann Chim 1848. pp.195-213.

Dzurella KN, Darby N, De La Mora A, et al. Nitrogen source reduction to protect groundwater. Technical report 3. Addressing Nitrate in California's Drinking Water with a Focus on Tulare Lake Basin and Salinas Valley Groundwater. 2012. UC Davis: Center for Watershed Sciences.

Geisseler D, Lundy M, Miyao G. Would a computer-based program be useful to improve irrigation and nitrogen management in processing tomatoes? Sacramento Valley Field Crops Newsletter, Winter 2015. 2015. UC Cooperative Extension Sutter-Yuba Counties. p. 1-2.

Hartz T. Potassium requirements for processing tomatoes. Special Edition: Processing Tomatoes in the San Joaquin Valley. Vegetable Crop Facts, Merced and Madera County. 2002. Merced: UC Cooperative Extension. p. 6-7.

Hartz T. Efficient fertigation management for drip-irrigated processing tomatoes. Edition 11: Processing Tomatoes. UC Cooperative Extension Vegetable Notes: Fresno, Tulare and Kings Counties. 2008. 4(1):2-3.

Hartz T, Bottoms T. Nitrogen requirements of drip-irrigated processing tomatoes. HortScience. 2009. 44:1988-93.

Hartz TK, Hanson B. Drip Irrigation and Fertigation Management of Processing Tomato. 2009. UC Vegetable Research and Information Center.

Hartz T, Johnstone P, Francis D, Miyao E. Processing tomato yield and fruit quality improved with potassium fertigation. HortScience. 2005. 40:1862-7.

Krusekopf H, Mitchell J, Hartz T, et al. Pre-sidedress soil nitrate testing identifies processing tomato fields not requiring sidedress N fertilizer. HortScience. 2002. 37(3):520-4.

Kuo S, Sparks DL, Page AL, Helmke PA, Loeppert RH. Phosphorus. Methods of Soil Analysis. Part 3, Chemical Methods. 1996. Madison, WI: SSSA.

Lecompte F, Bressoud F, Pares L, et al. Root and nitrate distribution as related to the critical plant N status of a fertigated tomato crop. J Hortic Sci Biotech. 2008. 83(2):223-31.

Miyao G. Fertilizer guidelines for processing tomatoes. Special Edition: Processing Tomatoes in the San Joaquin Valley. Vegetable Crop Facts, Merced and Madera County. 2002. Merced: UC Cooperative Extension.

Poch-Massegú R, Jiménez-Martínez J, Wallis KJ, et al. Irrigation return flow and nitrate leaching under different crops and irrigation methods in Western Mediterranean weather conditions. Agr Water Manage. 2014. 134:1-13.

Tei F, Benincasa P, Guiducci M. Critical nitrogen concentration in processing tomato. Eur J Agron. 2002. 18:45-55. DOI: 10.1016/s1161-0301(02)00096-5 [CrossRef]

Thomas GW, Page AL. Exchangeable cations. Methods of Soil Analysis, Part 2. Chemical and Microbiological Properties. 1982. Madison, WI: American Society of Agronomy. p. 159-65.

Citations

The challenge of nutrition management of processing tomatoes in an era of rising yield expectations
T.K. Hartz 2017. Acta Horticulturae (1159):1
http://dx.doi.org/10.17660/ActaHortic.2017.1159.1

Soil testing for P and K has value in nutrient management for annual crops
Daniel Geisseler and Gene Miyao 2016. California Agriculture 70(3):152
http://dx.doi.org/10.3733/ca.2016a0007

Soil nitrate testing supports nitrogen management in irrigated annual crops
Patricia A. Lazicki and Daniel Geisseler 2017. California Agriculture 71(2):90
http://dx.doi.org/10.3733/ca.2016a0027


University of California, 2801 Second Street, Room 184, Davis, CA, 95618
Email: calag@ucanr.edu | Phone: (530) 750-1223 | Fax: (510) 665-3427
Website: https://calag.ucanr.edu