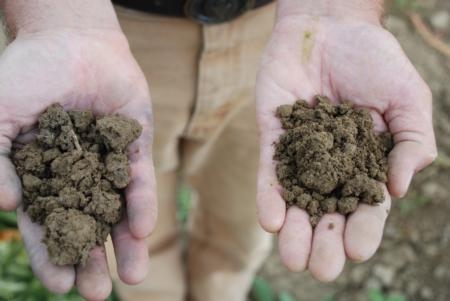
Data in this survey were compiled for two general types of conservation tillage. Tillage practices such as no-till, strip-till, ridge-till and mulch-till, that leave at least 30 percent of the residue from previous crops in place on the soil surface are the typical forms of conservation tillage that are recognized throughout the world. In addition to these practices, “minimum tillage” practices that reduce the overall number of tillage passes by at least 40 percent relative to what was done in 2000, are also included in the institutes’s tally of conservation tillage acreage.
In 2010, conservation tillage systems accounted for about 14 percent of the acreage for the crops that were surveyed including silage and grain corn, small grains for hay, silage and grain, tomatoes, cotton, dry beans, and melons throughout the nine-county Central Valley region. This was an increase from about 10 percent in 2008. Minimum tillage practices were used on about 33 percent of crop acreage in 2010, also up from about 21 percent in 2008.
The largest change in conservation tillage acreage over the 2004–2010 period is found in the amount of corn silage acreage that uses strip-tillage. In 2004, there were only about 490 acres of summer silage corn using strip-till, while in 2010 more than 103,000 acres throughout the San Joaquin Valley dairy region had adopted the use of this form of conservation tillage. The overall use of minimum tillage practices has also greatly increased during this time from about 64,000 acres under reduced pass tillage in 2004 and just over 700,000 acres under minimum tillage in 2010.
|
California conservation tillage acreage survey (2010) for tomatoes, cotton, edible dry beans, silage corn, grain corn, and small grains for grain, hay and silage, December 15, 2011 |
||||||||
|
|
> 30% Residue Cover after Planting |
|
|
|
>40% reduction in total passes |
< 30% Residue Cover after Planting |
Total Acreage |
CT % |
|
Total |
No Till |
RT/ST |
Mulch Till |
CT Total |
Minimum Tillage |
Conventional Tillage |
||
|
Fresno County |
- |
1,280 |
3,331 |
4,611 |
148,800 |
389,688 |
394,299 |
1% |
|
Kern County |
- |
- |
711 |
711 |
- |
220,504 |
221,215 |
0% |
|
Kings County |
3,037 |
54,498 |
32,154 |
89,689 |
44,156 |
228,157 |
317,846 |
28% |
|
Madera County |
100 |
14,909 |
- |
15,009 |
- |
46,511 |
61,520 |
24% |
|
Merced County |
3,000 |
18,100 |
19,866 |
40,966 |
- |
227,928 |
268,894 |
15% |
|
Sacramento |
620 |
559 |
1,866 |
3,045 |
3,568 |
46,913 |
49,958 |
6% |
|
San Joaquin |
2,100 |
- |
- |
2,100 |
150,260 |
276,440 |
278,540 |
1% |
|
Tulare County |
- |
68,478 |
12,270 |
80,748 |
305,184 |
340,382 |
421,130 |
19% |
|
Yolo County |
23,530 |
- |
26,069 |
49,599 |
49,792 |
47,295 |
96,894 |
51% |
|
Total |
32,387 |
157,824 |
96,267 |
286,478 |
701,760 |
1,823,818 |
2,110,296 |
|
For additional information and photos of various forms of conservation tillage, please contact Jeff Mitchell at (559) 303-9689 or mitchell@uckac.edu .