‘Visualizing’ forests from computer and other technological data is common practice in the field of forestry. Forest visualization is used for stand and landscape management and to predict future environmental conditions. Currently, most visualization software packages focus on one forest stand at a time (hundreds of acres), but now we can visualize an entire forest, from ridge top to ridge top. The Sierra Nevada Adaptive Management Project (SNAMP) Spatial Team principle investigators Qinghua Guo, associate professor in the UC Merced School of Engineering; Maggi Kelly, UC Cooperative Extension specialist in the Environmental Science, Policy and Management Department at UC Berkeley; graduate student Jacob Flanagan and undergraduate research assistant Lawrence Lam have created cutting-edge software that allows us to visualize the entire firescape (thousands of acres).

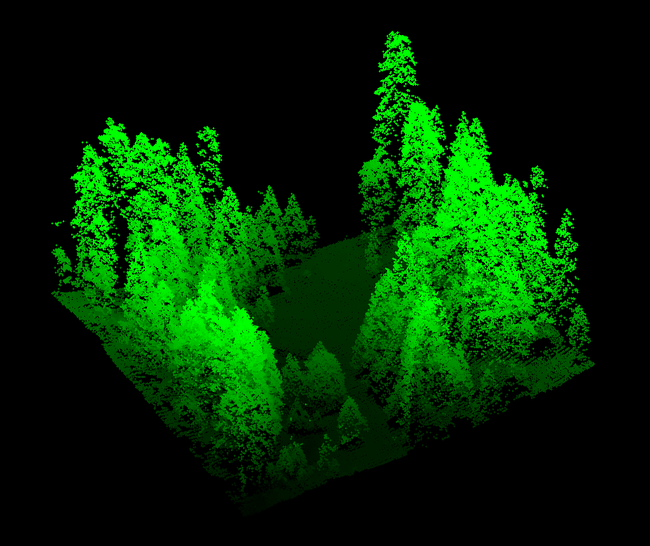
Our new forest visualization software begins by pulling out individual trees from the point cloud. From these individual trees, we extract the tree height and width data. Canopy base height data helps describe the shape of each tree. Then, each individual tree is modeled, and the whole forest is constructed. Visual details such as needles or smooth edges can be added in. This helps to provide a more realistic perspective of the forest than from point clouds alone.
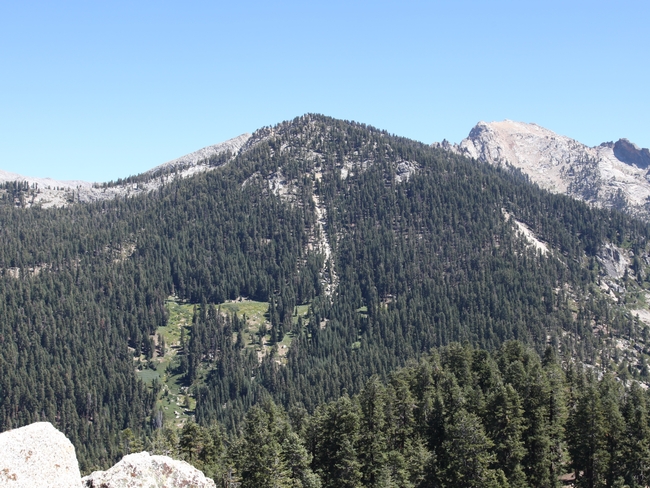
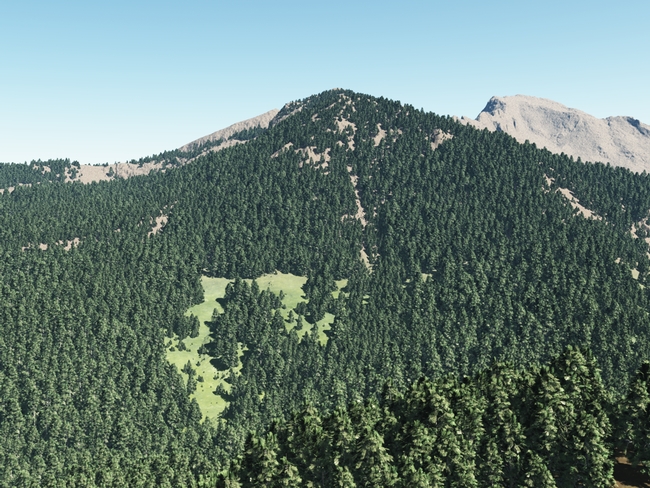
A forested landscape in the Sierra Nevada (left: a photograph taken with a camera) compared to lidar derived virtual forest (right: simulated scene based on the actual location of trees, tree height, and crown size derived from our lidar data, minus the rocks in the lower left-hand corner)
Forest visualization with lidar is useful for helping us understand the complexities in forest structure across the landscape, how the forest recovers from fuels reduction treatments, and how animals with large home ranges might use the forest.
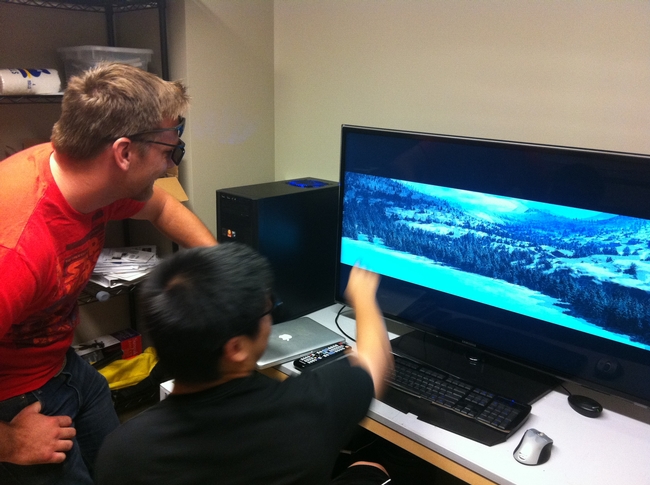
These images, created from lidar data, are still two-dimensional, and thus they lack a sense of depth. To alter that, we have been actively working to bring the created virtual forest into the 3D realm that we are accustomed to seeing in movies or television. Our proposed 3D system relies on stereoscopic imaging to allow individuals to see in 3D. Stereoscopic imaging refers to an optical illusion created by allowing two offset images to be seen by the viewer’s two eyes, independently. The difference in perspective between the left eye and the right eye causes the brain to process the image with depth, which is how current active stereoscopic images are produced in movies or television. By utilizing the fact that the projected forest is virtual, we can then render two offset images to create a new stereoscopic object. From there, a 3D TV easily overlays the two images on top of the other, alternating an image for the left and then right eye, creating an illusion of 3D and depth for the viewer. Again, these visualizations are not of simulated forests, but of our real Sierra Nevada forest, with every tree in the correct place with respect to the other trees, and seen with the correct height.
SNAMP links:
- SNAMP website: http://snamp.cnr.berkeley.edu/
- SNAMP Spatial Team: http://snamp.cnr.berkeley.edu/teams/spatial
- SNAMP Research Briefs (where some of the lidar research has been published): http://snamp.cnr.berkeley.edu/news/categories/research-briefs/


