- Author: Jeannette E. Warnert
For centuries, farmers have used all the colors of the rainbow to assess their orchards: The bright pink of blossoms in springtime, the vibrant green of heathy leaves, the red blush on fruit ready to harvest.
However, there are wavelengths beyond what a human eye can see that also provide valuable information about the crop – including tree vigor, plant stress, water use and fertilizer needs.
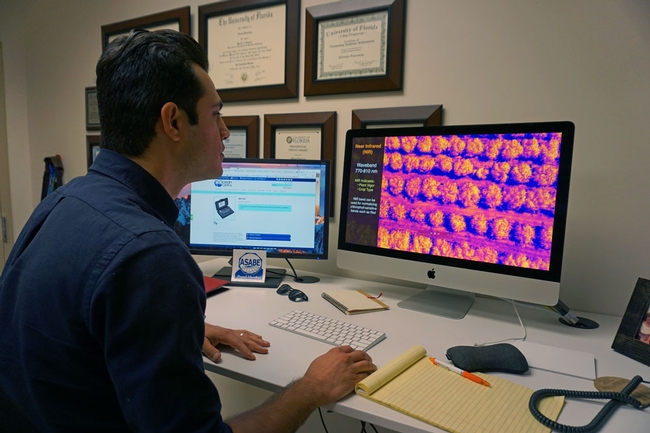
UC Cooperative Extension agricultural engineering advisor Ali Pourreza is peering into these previously invisible colorations to create a virtual orchard that will quickly, easily and inexpensively allow farmers and scientists to manage orchards for optimum production.
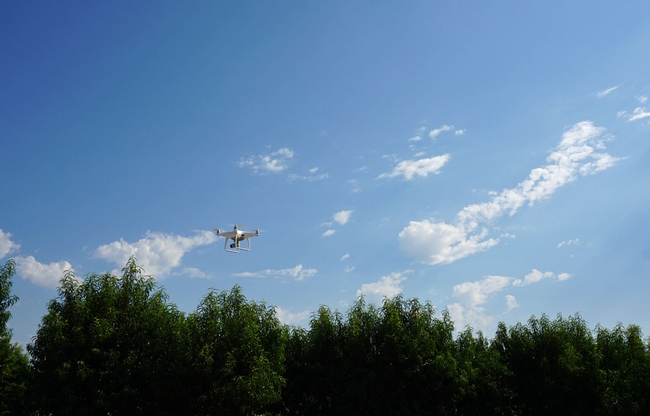
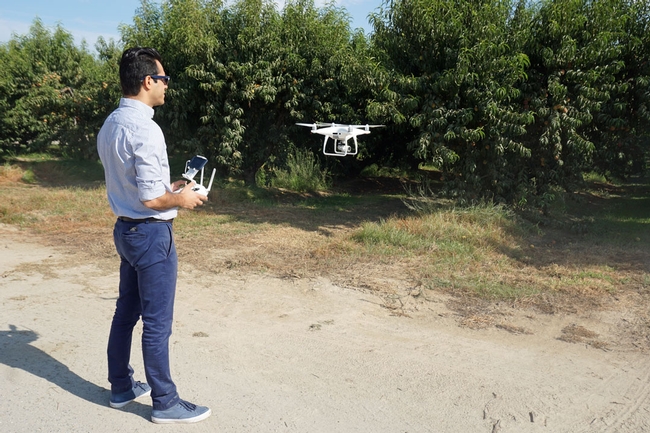
To develop his first virtual orchards, Pourreza launched a camera-equipped drone over an orchard at the UC Kearney Agricultural Research and Extension Center in Parlier. As the drone flies over the trees, it snaps thousands of photos and, using photogrammetry and software that stiches the images together, makes a three-dimensional point cloud model of the orchard.
A computer program can make colors that are invisible to the human eye – such as near infrared, red edge and ultraviolet – into imagery that illuminates key crop health indicators. Near infrared indicates the amount of healthy foliage, plant vigor and crop type. If the trees have low near infrared values, it means the plants are under stress. Red edge indicates plant stress and nitrogen content. High red edge values indicate nitrogen stress and low water content in plant tissues.
Patrick Brown, a pomology professor at UC Davis, is planning to use the virtual orchard to map nitrogen use in citrus.
“We are currently working on developing models to help growers determine their fertilization demands and have been contrasting the results from real orchards with the virtual orchard,” Brown said. “We have already utilized the approach to contrast the estimates of tree growth and yield with whole tree excavations and harvests to help validate the virtual approach and provide a more accurate estimate of tree nitrogen demand.”
Ultimately, Brown hopes to develop a way for growers to rapidly and cheaply estimate the nitrogen demand of their orchards, monitor the status of their orchards and manage nitrogen fertilizer applications.
In addition to the color variations brought to light by the virtual orchard, the system provides detailed data on other aspects of the crop development.
“We can learn canopy height and width, the spacing between the trees, total leaf area, canopy density and the amount of shaded area in the orchard,” Poureza said.
This data is of interest to scientists studying plant development, soil health and irrigation.
For example, UCCE agricultural water management specialist Daniele Zaccaria is researching the impact of soil-water salinity on water use by pistachio trees in the San Joaquin Valley.
“In our on-going research study we are characterizing the functional relationships between soil-water salinity, canopy size and density and evapotranspiration of pistachio trees through the light interception by the canopy,” Zaccaria said. “We plan to work with Ali to see how the virtual orchard approach can represent that and simulate the physical process of soil evaporation and tree transpiration as a result of different canopy sizes and densities intercepting different amounts of solar radiation.”
Zaccaria said he also plans to deploy a similar approach to understand how different canopy sizes, planting densities and row orientations found in commercial citrus orchards in the San Joaquin Valley – from navel oranges, to mandarins and lemons – can affect the citrus water demand and use.
In addition to the rich data that scientists can glean from the virtual technology, Pourreza envisions many applications of this technology for farmers, including yield forecasting, blossom mapping, variable pesticide application and robotic harvesting.


