Before using the tool, we highly recommend you familiarize yourself with a few basic features.
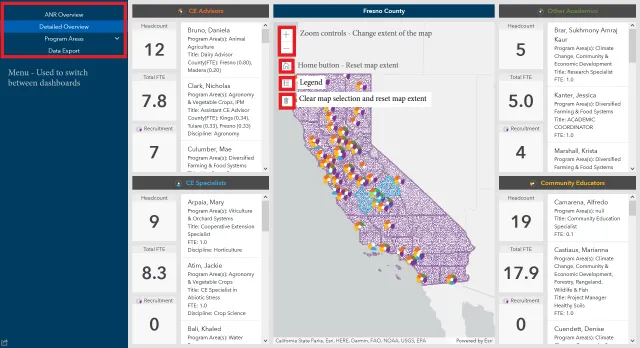
- County Selection: Click on a county on the map to filter all data to that county.
- Menu: Allows you to navigate between different dashboards.
- Zoom Controls: Allows you to change the extent of the map.
- Home: Returns you to the default extent of the map.
- Legend: Shows the description behind the various colors, symbols, and shading. For more information on the data, please see the Data Notes
- Clear Selection: Clears the selected county and resets the map extent.
Viewing Dashboards
Using the ‘Menu’ feature, you can toggle between the following dashboards to see different illustrations of UC ANR’s programmatic footprint:
ANR Overview Dashboard
- Provides a high-level overview of UC ANR’s programmatic and academic footprint, including CE Advisors, CE Specialists, other academics, positions under recruitment, and Community Educators.
- This dashboard also shows where all UC ANR county offices, research and extension centers, and campuses are.
- This dashboard is interactive—by using the ‘Select’ tool, you can see data by county.
Detailed Overview Dashboard
- Provides a detailed overview of UC ANR’s programmatic and academic footprint, including CE Advisors, CE Specialists, other academics, positions under recruitment, and Community Educators
- This dashboard includes academic and programmatic position titles and their FTE split among counties
- This dashboard is interactive—by using the ‘Select’ tool, you can see data by county.
Program Area Maps Dashboard
- This dashboard includes UC ANR UC Cooperative Extension employees who either self-reported working in within program areas or those who are part of statewide programs.
- For example, the Youth Development map includes those formally part of the California 4-H Youth Development Program as well as others who work with youth. Refer to individual position titles to get more information on each position.
- The 12 programmatic area maps were developed to span ANR’s focus areas: Youth Development & 4H, Agriculture & Pest Management, Environmental & Natural Resources, Nutrition, Food, & Health and Innovation & Economic Development.
- This dashboard is interactive—by using the ‘Select’ tool, you can see data by county.
Data Export
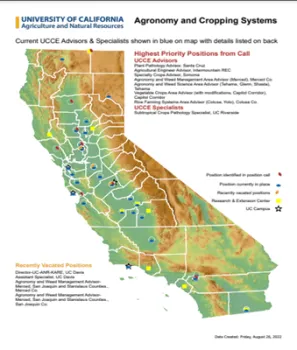
This dashboard allows you to produce a PDF map or an excel table of any of the program areas. The maps will display ANR’s programmatic and academic footprint across the state in a PDF that is printable.
You can also download the raw excel data behind the map, using the ‘Table’ feature.
Example of the Map: