UC ANR programs, UCCE offices using story maps to tell their stories
GIS (Geographic Information Systems) Day is Nov. 20. To celebrate, the Informatics and GIS Statewide Program is highlighting how story maps are increasingly being used in UC ANR. Instead of going through the traditional route of trying to embed multiple photographs, screenshots, charts and tables in a single Word document, more ANR program teams and UCCE offices are finding creative ways to use story maps.
“Story maps are fun and easy to build, and can help program teams and UCCE offices communicate the work they are doing,” said Andy Lyons, IGIS program coordinator.
CE Offices across the state have come up with creative ways to use story maps to educate their clientele and spice up their annual report. Statewide Programs such as Environmental Stewards are also using story maps for technical training. Still other projects are using story maps to communicate their impact related to climate smart agriculture or California rangelands. To find examples of how story maps are being used within UC ANR and inspire more users in the ANR community, IGIS has built a story map collection.
RECs are also getting in on the action. Adina Merenlender, UC Cooperative Extension specialist in conservation science, used a story map to create the Hopland Research and Extension Center Land History.
“We wanted to share the land history of HREC on the REC webpage in an engaging way and take advantage of different types of content including photos, timelines and text,” said Merenlender. "It's been great to be able to share the land history of HREC including information about the Indigenous people, injustices and traumas tied to the area's colonial past and recognize the resilience and value of the Hopland Band of Pomo Indians.”
Story maps are a great way to tell your story using visually engaging content and narratives. They allow you to embed web-maps, high-resolution photos, dashboards and videos from YouTube, among other things.
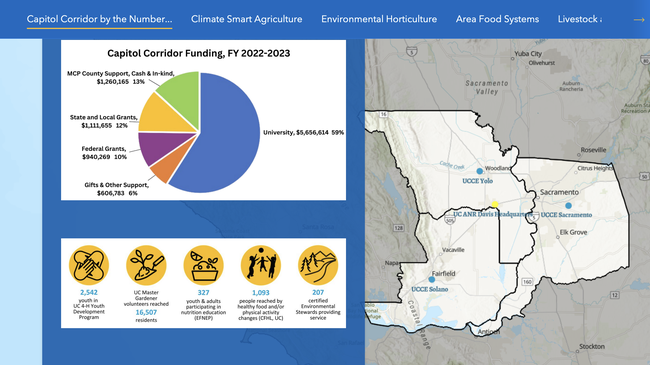
"Story maps have proven to be a fantastic tool with an easy learning curve, making it accessible and straightforward to use,” said Nicholle Stein-Peterson, who created the UCCE Capital Corridor Annual Report Story Map. “Moving away from the typical multi-page PDF was a refreshing change, and it made the process even more enjoyable. The enthusiastic feedback we've received has been truly motivating. I loved how, with minimal customization options, it allowed our annual report to look consistently polished and aligned with our brand.”
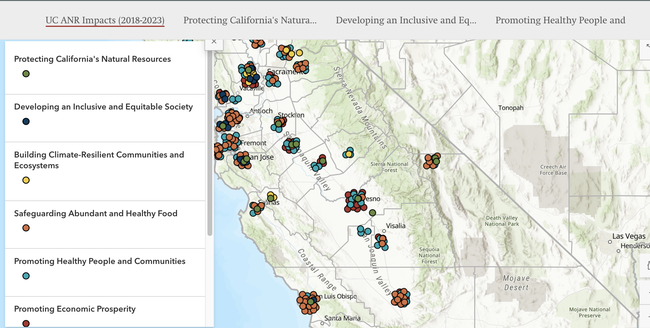
“The UC ANR Impact Story Map is a compilation of UCCE measured condition changes to help advance our efforts on measuring and communicating public value impact,” said Christina Becker, program policy analyst for Program Planning and Evaluation.
IGIS will offer an Intro to Story Maps workshop on Jan. 24, 2025. For more information, or to discuss an idea for a story map, contact Priyanka Vyas, GIS analyst, at pdvyas@ucanr.edu.


