Posts Tagged: rainfall
What is subsoil and how does it help a garden?
This is for readers who may have heard of subsoil, but don't really know what it is, let alone...
Anthony on park bench
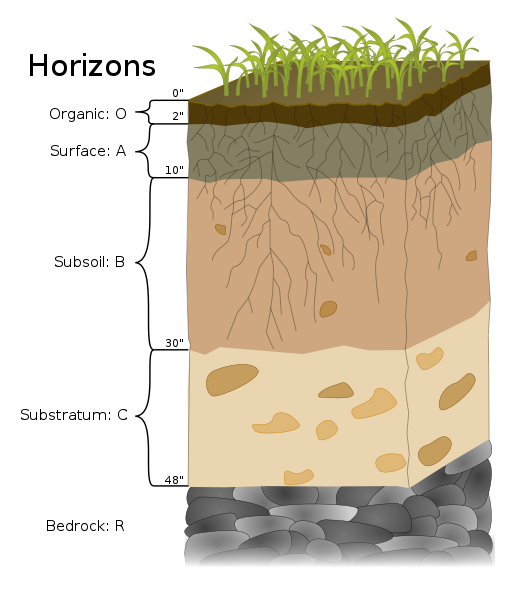
Soil Horizons, Wikimedia commons.
Don't wait too long to irrigate your wheat: maintaining yield potential in this winter's dry period
Long dry periods are not uncommon in the Sacramento Valley between January and February. Despite...
Learning More About Climate Change.
By Susanne von Rosenberg, UC Master Gardener of Napa County By now, most of us are...

Global temperature change. (abcnews.go.com)

Rain gauge and thermometer. (leevalleytools.com)

This is an example of a digital version, too. (rainmanweather.com)

Frost free season getting longer. (climatecentral.org)

California hottest years on record . . . the last 10. (ca.news.yahoo.com)

Irrigation controllers may need to keep working through fall and winter. (amazon.com)

California Climate Change Indicators Report. (oehha.ca.gov)

Indicator of polar climate change. (sites.google.com)
Which Way Weather?
In 2018 the Ojai Valley Land Conservancy (OVLC) accepted a grant from the Resources Legacy Fund on behalf of Watershed Coalition of Ventura County (WCVC) for a study of projected climate changes in Ventura County. OVLC contracted with Drs. Nina Oakley and Ben Hatchett, climatologists with the Desert Research Institute (DRI), to evaluate historic climate variability and projected changes in Ventura County. This information is needed to “paint a picture” of future climate in the watersheds of Ventura County (Ventura River, Santa Clara River, and Calleguas Creek) to support and inform climate change-related decision-making. This study provides important information for the amendment to WCVC's Integrated Regional Water Management (IRWM) Plan
You can find a copy of the report on the DRI website at: https://wrcc.dri.edu/Climate/reports.php.
To view presentations and other information from the two WCVC Climate workshops conducted with Drs. Oakley and Hatchett in October of 2018, and April of this year please visit: http://wcvc.ventura.org/documents/climate_change.htm
Some of those most interesting findings for me, are the historical data. For example, data for the years 1896 – 2018, show a tendency toward increasing maximum temperatures over the period, especially the last 10 years (Fig 1.2). But most interesting, is the increasing minimum temperatures (Fig 1.3) as compared to the maximum temperatures. Winter where is thy sting? The 2018-19 winter was the coldest in my memory, with the heater on full time at night, but there was no general frost damage this year. I can remember 1990 and 2007.


Precipitation in the South Coast region exhibits high interannual variability over the period examined. No notable long-term trends are observed (Fig. 1.4). Since approximately 2000, the 11-year running mean decreases, associated in part with the 2012–2019 drought. It is unclear whether this trend will continue in subsequent years.

There's a lot more information in the report. READ On.
But something to keep in mind, is that we had a terrible heat wave last July, and it could easily happen again. Growers who had their trees well hydrated before the heat arrived, sustain less or no damage to the trees and much less fruit drop. Trees that were irrigated on the day it started to get hot, never had a chance to catch up with the heat. Once the atmosphere starts sucking the tree dry, water movement through the soil, roots and trunk cant keep up with the demand. Weather forecasting is pretty accurate 3 days out, and if heat is forecast, get those trees in shape. You can run water to reduce the temperature and raise the humidity in the orchard to reduce transpirational demand which helps some.
Something we learned last year. What we saw and what to expect:
https://ucanr.edu/blogs/blogcore/postdetail.cfm?postnum=27676
Map of elevational changes in Ventura County and how

elevation ventura
School Gardens Are Vital!
As a grandmother of three darling children, I worry about so much: Are they happy? Are they...
