Posts Tagged: fertigation
Precision Ag? Avocado? Citrus? Cherimoya?
My dad always said that if you can learn one good thing from a meeting, it was a good meeting. Here's a webinar that might offer something good to for tree growers. Listen in and make up your mind.
Webinar: California & Chile: Opportunities for Precision Agriculture in Climate Change Adaptation and Mitigation.
Agenda & Speakers
Introduction
- Dr. Amrith Gunasekara, Science Advisor to the Secretary, CDFA
Opening Remarks
- Dr. Pablo Zamora, Associate Director, UC Davis Chile
- Marcela Rondon, Agricultural Attaché , USDA FAS
Panel 1: Innovation in precision agriculture
- Dr. Tom Shapland, Co-founder and CEO, Tule Technologies
- Andreas Neuman , President, UAV IQ
Panel 2: Seeing it in action: Operations that have successfully adopted precision ag tech
- Allison Jordan, Vice President of Environmental Affairs, Wine Institute
- John Erb, Vice President for Sustainable Communities and Resource Solutions, Driscoll's
- Dr. Alvaro Gonzalez, R&D Assistant Manager of the Center for Research & Innovation, Concha Y Toro
Panel 3: Looking ahead: Promising research into the world of precision agriculture
- Dr. Chandra Krintz, Professor, UC Santa Barbara
- Dr. Carlos Flores, Program Coordinator Agronomy and Environment , UC Davis Chile
Register here:
https://register.gotowebinar.com/register/2276456747899022083

irrigATING CITRUS
Organic Nutrient Management in California Is NOT the Same as Other Places in the US
Nutrient availability from organic sources has been considered “slow release” by many growers and advisers. This may be true in environments are colder and especially soils are cooler. Organic nutrients are dependent on microbes to break down materials and release those nutrients, and when soils are cold, microbes can't do their thing. Soils in much of agricultural California tend to be warm and lack the freezing conditions that occur in many soils in the continental US. Imagine how much microbial activity occurs in the Mid-West when soils cool down to 32 deg F at a four inch depth and deeper. The top layers of soil are where organic matter accumulates and where most microbial activity occurs. When soils cool below 50 deg F, nitrogen leaching becomes less common, because less activity is occurring which also coincides with much less plant growth.
Soils in coastal California rarely fall below 50 deg F in the surface layers, so microbial activity is ongoing, all year long. So the question is, how “slow acting” are organic fertilizers? A recent study by Tim Hartz, Richard Smith and Mark Gaskell looked at release rates of injectable organic fertilizer and found that much of the nutrient release occurs within about a week after application depending on the formulation and temperature during the study. The results conform to another study that they did where they evaluated the nitrogen release rates of dry formulations of organic fertilizers – compost, manures, feather meal, etc.
Aside from the issues of the higher costs of these materials and their potential clogging, there is the issue of application timing. In the case of avocados and citrus, adequate levels of nitrogen are needed in the trees going into to fruit set in order to optimize set. And then after fruit set, in order to maintain growth into the fast growth period, again nitrogen needs to be adequate. Using organic fertilizers with a rapid conversion to useable forms of nitrogen, means that application timing should coincide with these critical periods in tree phenology or growth cycle.
Using information on organic nutrient management based on work from cold soil climates needs to be carefully evaluated before applying it to California soils. One of the most common problems in organic production is nitrogen management. Part of the problem is the cost of supplemental nitrogen amendments, but also learning to anticipate when that applied nutrient becomes available to the plant. Developing better estimates for local release rates and patterns will better help manage organic nutrient sources.
Read more:
Nitrogen Availability from Liquid Organic Fertilizers by T.K. Hartz, R. Smith and M. Gaskell
http://horttech.ashspublications.org/content/20/1/169.full
Summary: Limited soil nitrogen (N) availability is a common problem in organic vegetable production that often necessitates additional N fertilization. The increasing use of drip irrigation has created a demand for liquid organic fertilizers that can be applied with irrigation. The N availability of three liquid organic fertilizers was evaluated in an incubation study and a greenhouse bioassay. Phytamin 801 contained fishery wastes and seabird guano, while Phytamin 421 and Biolyzer were formulated from plant materials. The fertilizers ranged from 26 to 60 g·kg−1 N, 8% to 21% of which was associated with particulate matter large enough to potentially be removed by drip irrigation system filtration. The fertilizers were incubated aerobically in two organically managed soils at constant moisture at 15 and 25 °C, and sampled for mineral N concentration after 1, 2, and 4 weeks. In the greenhouse study, these fertilizers and an inorganic fertilizer (ammonium sulfate) were applied to pots of the two organically managed soils with established fescue (Festuca arundinacea) turf; the N content of clippings was compared with that from unfertilized pots after 2 and 4 weeks of growth. Across soils and incubation temperatures, the N availability from Phytamin 801 ranged from 79% to 93% of the initial N content after 1 week, and 83% to 99% after 4 weeks. The plant-based fertilizers had significantly lower N availability, but after 4 weeks, had 48% to 92% of initial N in mineral form. Soil and incubation temperature had modest but significant effects on fertilizer N availability. Nitrification was rapid, with >90% of mineral N in nitrate form after 1 week of incubation at 25 °C, or 2 weeks at 15 °C. N recovery in fescue clippings 4 weeks after application averaged 60%, 38%, and 36% of initial N content for Phytamin 801, Phytamin 421, and Biolyzer, respectively, equivalent to or better than the N recovery from ammonium sulfate.
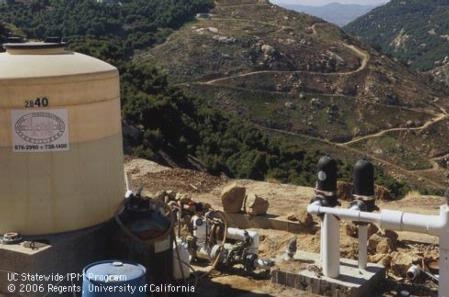
fertilizer injector
If you are interested in growing pomegranates while maximizing water and nitrogen use efficiency, you may want to register for a meeting that will be held at Kearney on October 2, 2014.
Individuals interested in growing pomegranates with surface or subsurface drip irrigation are invited to attend a meeting at Kearney Agricultural Research & Extension Center (KARE) on October 2, 2014, to learn about improving pomegranate fertigation and nitrogen use efficiency. To attend, a reservation made with Diana Nix at 559-46-6500, extension 0, is required.
The field day will share the results of a fertigation study at KARE that uses high frequency drip and subsurface drip irrigation/fertigation systems. Check in is at 9:30 am, presentations start at 10:00 am, and the tour of the research plot begins at 11:00 am. The meeting will adjourn at noon.
The agenda includes:
- Introduction, objectives, orchard configuration and operation
- Evapotranspiration, crop coefficient and lysimeter management
- Yields, water use efficiency, and nitrogen use efficiency
- Soil matric potential measurements and hydraulic gradient calculations in the subsurface drip irrigated lysimeter
- Tissue responses to high frequency injected nitrogen at three levels of nitrogen
- Canopy cover and leaf chlorophyll measurements
- Conclusions and questions
For additional information, please contact Kevin R. Day, UC Cooperative Extension advisor in Tulare County, specializing in fresh-shipping deciduous tree fruits, cultural practices and production, fruit growth and development, pruning and training systems, at 559-684-3311, or Claude J. Phene, President of SDI Plus, at 559-298-0201.
Freshly harvested pomegranates in a bin.
Fertigating through drip does not always result in even nitrogen applications
An important benefit of drip irrigation is the ability to apply fertilizer through the irrigation water, permitting growers to spoon-feed nutrients, such as nitrogen (N), to their crops. By avoiding applications of large amounts of N fertilizer when the crop is small and uptake rates are low, losses of nitrogen by leaching can be minimized. Also, unlike furrow and overhead sprinklers, drip can deliver fertilizer in the zone where roots are most concentrated.
While drip fertigation offers several advantages for managing nitrogen fertilizer during the season, success depends on the management of the drip system and using best practices for fertigation. Drip systems with poor distribution uniformity may likely cause fertilizer to be unevenly distributed within a field. Also, the strategy of injecting fertilizer into a drip system can affect the distribution of fertilizer to the crop. Proper fertigation requires injecting at a steady rate and at a location that provides sufficient mixing of fertilizer with irrigation water. To assure that the fertilizer uniformly distributes within the field after an injection, sufficient irrigation time with clean water is needed so that all of the fertilizer is flushed out of the drip tape before the irrigation ends.
For drip to be economical for vegetable growers on the central coast, most farming operations retrieve drip tape after each crop is harvested and repair and reuse the tape for 8 to 12 crops. Breaks and leaks in the tape are repaired using a splicing machine (Figure 1). Growers have expressed concern that fertigating through their drip systems is not resulting in even applications of N fertilizer after the tape has been reused for multiple crops. Splicing machines often do not fully repair leaks in tape, and emitters tend to plug over time unless the tape was adequately maintained by flushing and chemical treatment.
In response to grower concerns, we evaluated the uniformity of applied water and nitrogen fertilizer for surface placed drip in 11 commercial lettuce fields during the fall of 2012 and during the spring of 2013.

Fig. 1. Splicing machines are used to repair leaks and breaks in drip tape
Procedures
All fields were planted with romaine or iceberg lettuce varieties on 40-inch or 80-inch wide beds. At each site irrigation, pressure, and fertilizer uniformity were evaluated during a single irrigation event. Field sizes ranged from 8 to 20 acres, and the maximum row lengths ranged from 600 to 1340 ft. Drip tape at all field sites was 7/8 inch diameter, medium flow tape (0.34 gpm/100 ft), but varied by manufacturer and age. The location where fertilizer was injected into the irrigation system, and start and end time of the fertigation, as well as the duration of the irrigation, were recorded. Before irrigating, couplers fitted with ¼ gallon per hour pressure compensating emitters that were spliced in to the drip tape at 24 locations within the field, representing the head, tail and middle areas. Water from these emitters was collected into 5 gallon containers during the entire irrigation (Figure 2) and analyzed for NO3-N and NH4-N. The discharge rate of 4 emitters and pressure of the tape was measured near each of the 24 fertilizer sampling locations (total of 96 emitters). Mass (lbs) of N applied at each of the 24 collection locations within a field was estimated by multiplying the measured discharge rate of the drip tape by the irrigation time and by the concentration of N in the collected water. Uniformity of applied water, tape pressure, and fertilizer was calculated by comparing the lowest 25% of measurements to the average of all 24 measurements. In addition to evaluating fertilizer distribution uniformity, we evaluated the time for fertilizer to travel to the furthest distance from the injection point by injecting food dye for a 5 minute period into the irrigation system and monitoring the water for color at the furthest point from the injection location.

Fig. 2. Low flow (1/4 gph) pressure compensating drip emitters were used to collect samples of irrigation water during the entire irrigation cycle.
Results
Distribution uniformity of applied water for the 11 fields averaged 73% and ranged from 38% to 88% (Table 1). The industry standard for irrigation uniformity of surface drip is 85%. Fertilizer application uniformity averaged 67% and ranged from 46% to 82%. The distribution uniformity of the drip systems of 7 fields evaluated was greater than 74% (avg = 82%) and fertilizer uniformity was greater than 72% (avg = 77%) (Figure 3).
One of the causes for poor distribution uniformity of some drip systems may have been related to pressure. Pressure uniformity averaged 80% and ranged from 43% to 99% (Table 1). Average pressures in the drip tape ranged from 3.5 to 13.8 psi (Table 2). Where the system pressure averaged 4.3 psi, the tape discharge rate was 30% less than the manufacturer's rating. Irrigation distribution uniformity decreased substantially when the average field pressure was less than 5 psi (Figure 4). Additionally, a substantial percentage of emitters of some drip systems were plugged (Table 2) which would reduce irrigation system uniformity. Leaks were evaluated in 5 fields and ranged from 1 to 5 leaks per 1000 ft of tape (Table 2). Significant leaks can potentially reduce drip uniformity by lowering the downstream pressure. Other limitations to good drip uniformity included mixing different types of tape in the same field, fluctuating pressure during the irrigation, and row lengths longer than 800 ft.
Field 8 had a high uniformity of pressure and irrigation distribution but a low fertilizer uniformity. We speculate that the fertilizer which was injected at a “T” connecting the valve in the field with the submain did not have sufficient time to mix with the irrigation water before the flow split into opposite directions. Hence, the average concentration of N on one side of the field was approximately half the concentration measured on the other side of the field. The distribution uniformity of fertilizer on individual sides of the fields was greater than 87%.
With the exception of field 8, fertilizer distribution uniformity was closely related with irrigation system uniformity (Figure 4). Fields with the lowest fertilizer uniformity were operated at the lowest average pressure and/or had the highest level of plugged emitters (Table 2).
Fertilizer was injected at the well in 4 of the fields and at the submain valve in the other 7 fields (Table 3). Injections were made simultaneously using 2 valves at 3 of the fields. Fertilizer was injected during an average of less than 30 minute period often at the beginning of the irrigation (Table 3). The time required for the fertilizer to travel to the furthest point of the irrigation system averaged 42 minutes but ranged from as short as 22 minutes to as long as 1 hour. Field size, row length, and injection location appeared to affect the travel time of the fertilizer. The average time for flushing the fertilizer was 3.75 hours, which was ample time to allow the fertilizer to completely flush from the system. The irrigation industry recommends that for long irrigations (> 4 hours), fertilizer should be applied in the middle of the irrigation cycle. Only at field 10 was the fertilizer applied during the middle of the irrigation. The long flush time after injecting could potential leach nitrate forms of fertilizer below the root zone of the crop. On average, half of the applied fertilizer N measured in the collection buckets was in the nitrate form.
Conclusions
This survey of commercial lettuce fields demonstrated that N fertilizer applied by drip has an average distribution uniformity of 77% when the injection is properly made and the drip system is operated and maintained to achieve an average distribution uniformity of 82%. The results also showed that N fertilizer applied by drip is frequently distributed to fields unevenly due to poor uniformity of the drip systems, or because proper injection procedures were not followed. Operation procedures observed at these sites would suggest that irrigators may need training to better understand the principles of fertigation so that fertilizer is applied at the highest uniformity possible, and in a manner that will prevent leaching losses of nitrate.
Acknowledgements
We thank the California Leafy Green Research Board for funding this project and the many growers that cooperated with the field trials.
Table 1. Summary of irrigation, fertilizer, and pressure uniformity of drip irrigated lettuce fields.

Table 2. Drip tape characteristics at commercial lettuce sites.

Table 3. Irrigation summary for drip irrigated lettuce fields.


Fig. 3. Relationship between distribution uniformity of retrievable drip systems and fertigation uniformity. Each symbol denotes a commercial lettuce field evaluated during the study.

Fig. 4. Effect of tape pressure on the distribution uniformity of retrievable drip systems. Each symbol denotes a commercial lettuce field.
