Posts Tagged: nitrification
Changes to Soil Following Application of Mustard Seed Meal and Crab Meal
Below is a look at what happens to a soil following application of mustard seed meal (MSM) at 1.5 T per acre and mustard seed meal (again 1.5 T per acre) + crab meal (500# per acre) as separate treatments two weeks after fumigation with Ally 33 (67% AITC, 33% chloropicrin applied at 340# per acre on Oct 7).
Grower standard was methyl bromide/chloropicrin applied at 350# per acre. Planting took place Nov 3.
A soil sample taken on Nov 7 did not show differences in soil aspects analyzed between any of the treatments, although ammonium - N concentrations were surprisingly high (30 ppm and up) and nitrate - N numbers tended to be quite low (6 ppm and below).
Remarkably, look what has happened in the 4 weeks since that sample. Bear in mind that the grower has since sprinkled overhead several times and we had a good amount of rain as well. Commenting continues below the tables.
Unless otherwise indicated, units are in ppm of dry soil.
Table 1A. Soil analysis from December 7, 2016
|
Sample |
pH |
EC (dS/m) |
Nitrate – N |
Ammonium – N |
|
Methyl bromide grower standard |
7.4 |
0.9 |
11.3 |
4.7 |
|
Mustard Seed Meal |
7.1 |
1.7* |
34* |
20* |
|
Mustard Seed Meal + Crab Meal |
7* |
1.8* |
32* |
12* |
*Student's T-Test; different from grower standard at 5% level of significance.
Table 1B. Soil analysis from December 7, 2016
|
Sample |
(P) |
(K) |
(Ca) |
(SO4) |
(Mg) |
(Mn) |
Fe |
Na in meq/L |
Cl in meq/L |
|
Methyl bromide grower standard |
51 |
148 |
3100 |
278 |
178 |
8.9 |
18 |
1.9 |
3.2 |
|
Mustard Seed Meal |
54 |
190* |
2933 |
318 |
193 |
19.2* |
16 |
1.5 |
1.9 |
|
Mustard Seed Meal + Crab Meal |
60 |
185* |
3100 |
589 |
150 |
20.1* |
16 |
1.5 |
1.9 |
*Student's T-Test, different from grower standard at 5% level of significance.
One sees immediately that the pH has fallen, even significantly, in plots treated with mustard seed meal and mustard seed meal + crab meal. This is not surprising, since in the month's time since the initial sample on Nov 7, the ammonium has clearly nitrified (releasing 2 H+ ions per molecule, in turn acidifying the soil) creating a big pool of nitrates which have gone up significantly over the grower standard.
EC has gone up a bit due to the higher nitrates (NOT because of sodium or chloride), and interestingly levels of manganese (Mn) a mineral sensitive to acidification apparently, have soared in both MSM treated plots. Levels of available potassium (K) have gone up significantly also in MSM treated plots.
Quite interesting on the whole. By the way, a soil report like this makes for pretty good reading, and outside of the EC which is for the time being a little high in the MSM plots, all the other numbers are right where I like to see them.
Stay tuned on this one; we are following all of this trial through the season.
Nitrogen Changes in the Soil, and it Changes Fast
At a recent meeting the question came up about the fate of nitrogen fertilizer applied through the irrigation system. If it is applied as urea, how long does it take to convert it to nitrate? If applied as ammonium, how long does it take to convert to nitrate? Urea and nitrate pretty much move wherever water moves and is very susceptible to leaching. Because of the positive charge on ammonium, it is not as mobile as nitrate, but once bacteria transform it to nitrate, it moves with water.
This is an important question, since if more water is applied than is needed by the plant, the nitrate is going to move out of the root system and no longer be available to the plant and ends up heading to ground water. Reading the literature, growers get the sense that all this transformation takes time, maybe a long time.
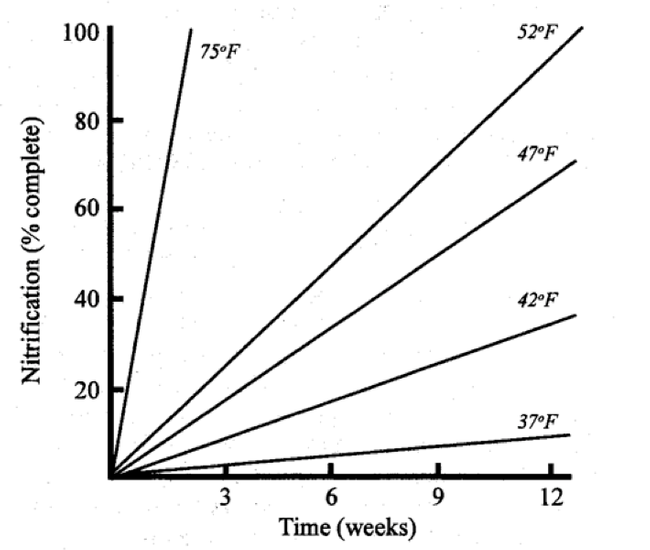
It turns out that soils in coastal California have a pretty rapid conversion of nitrogen. Francis Broadbent at UC Davis did a bunch of studies back in the 1950's and 60's and found enzyme hydrolysis of urea to ammonium occurring within hours. Other researchers have looked at nitrification, the conversion of ammonium to nitrate by soil bacteria, occurring within days and much of the conversion occurring within a week depending on soil temperature (see chart below).
So there is all this nitrate present and the key is what happens to it. It turns out that most plants when actively growing absorb nitrate at about 5 pounds of nitrogen per day. So with a 100% efficiency, applying 20 pounds of nitrogen, all of it would be taken up in four days. Of course, nothing in nature is that efficient. But the point is a big slug of nitrogen applied is not going to be taken up immediately and if more water is applied after that than is needed by the crop, it likely is pushed out of the avocado root zone.
Of course all the nitrogen a plant uses does not come from applied fertilizer. The bulk is coming from soil organic matter that is slowly decomposing. This nitrogen is being released at a rate that is probably in balance with the growth of the tree.
The applied fertilizer, however, is much more unstable and needs to be handled accordingly. The rule of thumb is to break the irrigation application into thirds. In the first third, run the irrigation to fill the lines and wet the soil. In the second third, run the fertilizer. This spreads it through the system and onto the ground. The last third is clear the irrigation system of the material and to move the fertilizer into the root zone. Then given time, the tree will take up the applied nitrogen. At the next irrigation then the bulk of that nitrogen will have been taken up and little will be pushed through the root system.
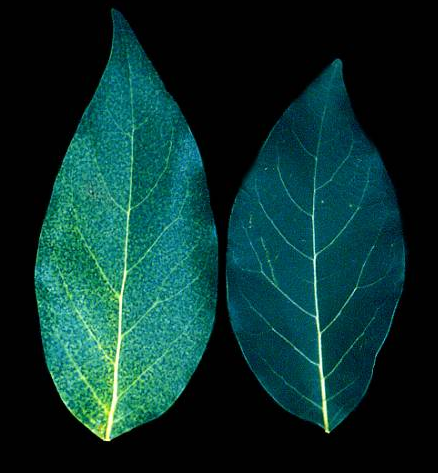
Low and High Nitrogen Avocado Leaves
Chart showing rapid conversion to nitrate with soil temperature
nitrogen avocado
nitrification
Growers and researchers come together for workshop on tomato nitrogen management
The Solution Center for Nutrient Management brought together growers, advisors and university...
