Posts Tagged: spatial
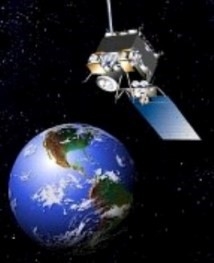
Water Use Where There is NO Weather Station
Spatial Overview - How it Works
The California Irrigation Management Information System (CIMIS) currently manages over 145 active weather stations throughout the state. Archived data is also available for 85 additional stations that have been disconnected from the network for various reasons. Most of the CIMIS stations produce estimates of reference evapotranspiration (ETo) for the station location and their immediate surroundings, often in agricultural areas. Because of California's diverse landmass and climate, many locations within the state lack a representative CIMIS station. Some counties, for example, do not have a CIMIS station and others have only one or two stations. As a result, there are significant spatial ETo data gaps, especially in urban areas. In an attempt to mitigate this problem, CIMIS initiated a study to investigate the possibility of coupling remotely sensed satellite data with point measurements from the CIMIS weather stations to generate spatially distributed ETo values (ETo maps).
A contract was awarded to the University of California Davis (UCD) remote sensing group, lead by Professor Susan Ustin, to conduct the study. The Department of Water Resources (DWR) formed an advisory committee comprised of individuals with expertise in remote sensing, GIS, modeling, and water management from DWR and UCD. The committee met, on an as needed basis to discuss new developments and plan future actions. After thorough research, the team decided to use combinations of data derived from satellites and interpolated from CIMIS station measurements to estimate ETo at a 2 kilometer (km) spatial resolution. The resulting product has been vigorously tested and has demonstrated a degree of accuracy that is acceptable for most irrigation applications. The CIMIS program will continue to evolve and expand to meet the future irrigation information needs of California. For a brief description of the methodology used to generate the ETo maps, see the Spatial Model discussion below.
Spatial Model
Daily reference evapotranspiration (ETo) at a 2 km spatial resolution are calculated statewide using the American Society of Civil Engineers version of the Penman-Monteith equation (ASCE-PM). Required input parameters for the ASCE-PM ETo equation are solar radiation, air temperature, relative humidity, and wind speed at two meters height. These parameters are estimated for each 2 km pixel using various methods.
Daily solar radiation is generated from the visible band of the National Oceanic and Atmospheric Administration's (NOAA) Geostationary Operational Environmental Satellite (GOES) using the Heliosat-II model. This model is designed to convert images acquired by the Meteosat satellite into maps of global (direct plus diffused) irradiation received at ground level. The model has also been used with other geostationary satellites such as the GOES. For details on the Heliosat-II model and its accuracy, please refer to the HelioClim web page.
Interpolation
Air temperature, relative humidity, and wind speed values at each pixel were obtained by interpolating point measurements from CIMIS stations. Originally two interpolation methods, Spline and DayMet, were selected based on accuracy of results, code availability, and computational efficiency. Spline – the method currently used – is an interpolation method that fits a surface through or near known points using a function with continuous derivatives. Two- or three-dimensional Spline is used based on which weather parameter is to be interpolated.
The accuracy of both methods has been tested using cross-validation analysis, but DayMet is no longer used. DayMet is an interpolation method that was developed at the University of Montana to generate daily surfaces of temperature, precipitation, humidity, and radiation over large regions of complex terrain. It determines the weights associated with a given weather station for each point where weather parameters are to be determined depending on the distance and density of the stations.
The accuracy of ETo values estimated from these methods depends on many factors. For example, solar radiation remotely sensed through GOES is significantly affected by such factors as cloudiness and snow cover. Therefore, mountainous areas with snow cover and coastal areas with cloud and fog are more susceptible to errors. Also, interpolation accuracy is affected by the density of the weather stations and geographic features of the region. CIMIS stations are purposely placed in irrigated, open, flat areas – usually valleys – to provide the best reference data for adjacent farmlands and other irrigated areas. As a result, interpolation in valleys between CIMIS stations may not provide accurate data for mountainous terrain. Despite these potential problems, however, we believe the ETo estimates provided will be superior to only using data from a distant weather station with a different microclimate. For CIMIS station Siting criteria click the “Siting” tab.
Further Details
For detailed descriptions of the methodology used to map daily ETo, refer to the RESOURCES navigation button https://cimis.water.ca.gov/Resources.aspx
If you would like to get ETo data created using the methods described here, you may do so by logging into your account, clicking on the SPATIAL navigation bar, then on the Spatial Report tab. If you do not have a CIMIS account, you can create one by registering with us. Please note that CIMIS data is provided free of charge and registration is required for statistical purposes only. https://cimis.water.ca.gov/Default.aspx
satellite weather station
Living on the Edge
Congratulations to Hoang Danh “Derrick” Nguyen, a graduate student in the Christian...
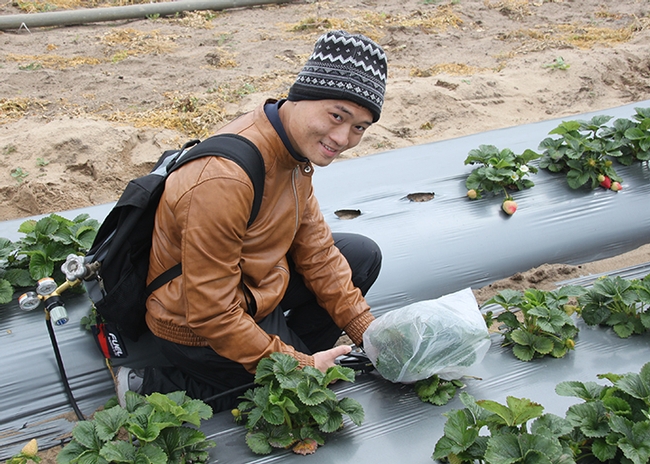
Hoang Danh "Derrick" Nguyen, who is studying for his master's degree in entomology, is shown here sampling insects from strawerry plants. (Photo by Christian Nansen)
Insects 'Living on the Edge': UC Davis Student Derrick Nguyen's Article in Prestigious Journal
DAVIS--Aerosmith sang about “Livin' on the Edge,” but many species of insects show a...

Hoang Danh “Derrick” Nguyen, who is studying for his master's degree in entomology with major professor Christian Nansen, is shown here sampling insects from strawberry plants. (Photo by Christian Nansen)
More from the Spatial Data Science Bootcamp
A couple of weeks ago, I was fortunate enough to attend the Spatial Data Science Bootcamp at UC Berkeley. This three-day training event focused on all aspects of GIS and spatial data from an open source perspective. As I've spent my entire career thus far in a heavily Esri-based environment, it was really eye-opening to see all that it out there in the world of open source/open data.
We covered multiple facets of the spatial data world from database systems like PostgreSQL to web mapping and visualiztions using Leaflet and D3. I'd have to say that I was most intrigued by the potential of Leaflet, a lightweight, easily customizable JavaScript library that looks like it could really make creating web mapping applications so much easier as well as allowing for cleaner, simpler final outputs.
I'm really excited to see how these different technologies can be utilized to help IGIS to better serve both ANR and the public.
IGIS Goes to Bootcamp!
A little over 1 week ago ESRI and UCANR's IGIS program sponsored the Spatial Data Bootcamp for Professionals held at UC Berkeley. At this Bootcamp we delved into the quickly evolving world of Open Source Systems, GIS, and visualizations. These systems included QGIS, PostgreSql, PostGIS, Leaflet, and D3 to name just a few.
As I worked with these new system I could not help but think about the different tools and resources that we could provide to the UCANR Network. These tools could include custom web mapping and analysis, the application of the R statistical package and the python programming language to spatial data, or the use of D3 to create interactive visualizations. In the future IGIS hopes to use these technologies to better extend UCANRs work and extension activities to the general public and to those within the organization.
If you'd like to know more about these new tools and techniques please contact me or others at the IGIS Program.
Cheers,
Shane Feirer
stfeirer@ucanr.edu
