
- Author: Michelle Leinfelder-Miles
- Contributor: Mark Lundy
- Contributor: Taylor Nelsen
Over the last several months, a team from UC Cooperative Extension has been conducting trials with wheat growers to better understand nitrogen (N) management under local conditions. The trials are funded by the CDFA Fertilizer Research and Education Program and demonstrate practices that UC Small Grains Specialist, Mark Lundy, has been investigating for several years, namely the use of N-rich strips in the field, a soil nitrate (NO3-) quick test, handheld canopy reflectance devices, and drone imagery. The N-rich strips serve as zones of soil N adequacy, and the soil NO3- quick test, canopy reflectance devices, and drone imagery serve to characterize differences between the zones of N adequacy and the rest of the field. Our trials implement these practices across variable soil and climatic conditions so that we can extend the information across wheat-growing regions of the state. Integral to these trials is identifying growers who are interested and able to shift at least half of their seasonal N budget from a pre-season to an in-season N application. Our goal is to help growers and consultants learn and implement these practices to guide nitrogen fertilization in wheat, for economic and environmental efficiency outcomes.
At the Delta location on Tyler Island, we are trialing these practices on high organic matter soils. The field has two different soil types: Gazwell mucky clay and Rindge mucky silt loam. The Gazwell series is characterized as having approximately 11 percent organic matter in the top foot of soil, and the Rindge series has approximately 18 percent organic matter in the top foot of soil. The grower's pre-plant aqua ammonia application provided approximately 60 pounds of N per acre, and the wheat was planted on November 15th. After planting, we flagged off three zones for the N-rich strips – two in the Gazwell soil and one in the Rindge soil. Each strip was 90 feet wide by 180 feet long. (While, in practice, N-rich strips do not need to be this large, we made ours this large so that we could also make observations from satellite imagery.) We took soil samples and performed the soil NO3- quick test (described below). On November 25th, we applied urea to the N-rich strips at a rate of approximately 62 pounds of additional N per acre. We timed our application ahead of a storm in the following days (approximately 0.5 inches, according to the Staten Island CIMIS station).
The soil NO3- quick test is performed in the field and provides a quick, inexpensive estimate of nitrogen availability in the soil. We performed the quick test just after planting to establish baseline conditions and then again each time we used the canopy reflectance devices and collected drone imagery, which we started at tillering (Feekes 2-3, Figure 1, see below). For the quick test, it is important to get representative soil samples, staying away from field edges and from the borders of the N-rich strips. We collected and aggregated several subsamples from the top 12 inches, from both inside and outside the N-rich strips. The soil was mixed with a calcium chloride solution, and then the test strips were dipped into the soil-water solution. The color on the strip is compared to the color chart on the bottle. In an organic soil, we consider a test strip reading of 10 ppm and above to be adequate soil N, and in a mineral soil, a test strip reading of 20 ppm and above would be adequate. (This is due to the higher bulk density of a mineral soil compared to an organic soil.) The quick test reading is not the same as what a lab would determine for the same sample. Mark and his team are preparing an online tool that will convert the quick test reading to the lab-equivalent value of NO3--N and the fertilizer equivalent in pounds of N per acre, based on soil type. We would expect to see higher soil NO3- in the N-rich strips compared to the surrounding field unless heavy rainfall resulted in leaching. (Consider the benefits of only leaching N from small plots rather than the entire field!) For fertilizer decision-making, the quick test readings are best considered in combination with plant reflectance measurements (see below). On their own, however, they do provide an estimate of nitrogen fertilizer equivalency that is available to the crop.
We have used Greenseeker NDVI devices and drone imagery to characterize canopy color of the N-rich strips and the surrounding field (Figure 2, see below). NDVI stands for normalized difference vegetation index and is a measurement of green vegetation that picks up differences that the human eye cannot detect. It allows us to make inferences about canopy cover and plant N status, and when considered with soil NO3- status, we can have even more confidence in our fertilization decisions. For example, if soil NO3- differs between the N-rich strips and surrounding field, and we observe a difference in canopy reflectance, then we have confidence – based on previous years of research – that the crop will respond to additional N fertilizer. If we don't see a difference in canopy reflectance, we would recommend postponing application of additional fertilizer and continue monitoring, or we would recommend adjusting the application to account for the available soil N. At tillering, we started sampling for soil NO3- and canopy reflectance on 14-day intervals. In February, we started seeing slight differences in Greenseeker canopy reflectance between the N-rich strips and the surrounding field, but the differences were not evident in the drone imagery. There was no rain on the horizon at that time and no opportunity to apply additional N. By early-March, the grower made the decision not to apply additional N this year, and we, in UCCE, needed to reduce activities due to the Covid-19 outbreak. We will, however, harvest the trial to determine whether there are yield or quality differences between the N-rich strips and the field.
In the future, I will use this blog to extend further information about the trial, including data for the Delta site. More immediately, the research team will be producing a series of weekly articles in the month of May that will be posted to the UC Small Grains Blog to provide more in-depth information on each of the practices. We will also be creating videos to demonstrate how to implement these practices. Consider subscribing to both blogs to be notified of new content.


Figure 2. Drone image of a field in Solano County where N-rich strips are implemented. (Photo courtesy of Mark Lundy and Taylor Nelsen, UC Davis.)

- Author: Michelle Leinfelder-Miles
It is the time of year when the harvest of our summer crops has concluded. Some growers may be planting small grains, and let us hope that winter rains nourish these crops. I received an inquiry from a grower at the end of harvest regarding nutrient removal with the harvest. This grower, in particular, had questions about how much potassium (K) is removed with the grain and straw/stover of a crop. Alternatively, we can think about how much K is added to the soil when crop residues are incorporated. This grower farms on a low K soil in the Delta and wants to know how much K could be available for his tomatoes next season, a crop that has high K demand. 
The California Department of Food and Agriculture Fertilizer Research and Education Program (CDFA FREP) provides crop fertilizer guidelines for nitrogen (N), phosphorus (P), and K. These guidelines were developed by Daniel Geisseler, Nutrient Management Specialist at UC Davis, using research results from California and elsewhere when California information was not available. The guidelines for wheat state that the concentration of K in the grain is 0.4-0.5%, and the concentration of K in the straw is approximately 1.5%. What this means is that for a wheat field that yields 3 tons/acre, 24-30 lbs K/acre would be removed with the grain (0.004 or 0.005 * 6000 lbs grain/acre = 24-30 lbs K/acre). Likewise, 90 lbs K/acre (0.015 * 6000 lbs straw/acre = 90 lbs K/acre) would be removed with the straw if the straw is not incorporated, assuming that approximately one ton of straw is produced per ton of grain. For corn, the grain is approximately 0.4% K, and the stover is about 1.5-2.5% K. Whether the corn is harvested for grain or silage, approximately 40 lbs K/acre will be removed with the grain at harvest (assuming a 5-ton crop). If the corn is harvested for silage, or if the stover is removed, then approximately 150-250 lbs K/acre will also be removed with the stover (again, assuming a 5-ton crop). If the stover is incorporated, then the grower is returning this amount back to the system.
The grower also asked how soon the K would be available for a subsequent crop (like his tomatoes) if he incorporates the crop residues. To get an answer for this question, I consulted with UC Davis graduate student, Jordan Wade, and UC Davis professor of biogeochemistry, Will Horwath. Both of them surmised that the K should become available fairly quickly because K is not a structural component of the plant. Contrasting K and N, for example, K is floating around in the cells in a soluble form; whereas, N is bound with carbon, forming structural parts of the plant. K is in a form that plants can use (it does not need to be mineralized into a plant-available form, as with N), so when the crop residue is incorporated and breaks down, the K should be readily available for plants, unless it gets adsorbed to soil particles.
In agricultural areas where little-to-no “maintenance” K has been applied over the years, it is possible that crops have depleted soil K. The FREP guidelines recommend applying K to wheat fields if the pre-plant soil test is less than 40 ppm. In corn, it is recommended to apply K if the pre-plant soil test is less than 50 ppm. It is recommended to take pre-plant soil samples for nutrient testing before each new crop.

- Author: Michelle Leinfelder-Miles
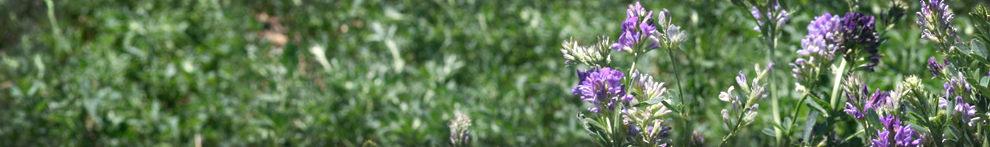
In late August, I was requested by a crop consultant to visit an alfalfa field in the Delta that was exhibiting symptoms like those in the picture. The leaves had little white spots near the margins, and generally, the plants had not grown well after the previous cutting. These symptoms are characteristic of potassium (K) deficiency. Delta soils are often deficient in K, so the consultant was going to follow-up with a soil nutrient test. deficiency in alfalfa exhibits white spots on the leaves.")
Fall is the season in which to address alfalfa fertilizer needs. Two nutrients that alfalfa frequently needs are phosphorus (P) and K. [Nitrogen fertilizer (N) is seldom required or profitable in alfalfa because root nodules contain N-fixing Rhizobium bacteria.] P and K should be applied between October and February because it could take 60-90 days for the crop to fully respond to fertilizer application.
A deep-rooted crop, alfalfa can scavenge nutrients from where other crops cannot, but because it has a long growing season, alfalfa has a long season of nutrient demand. Additionally, each cutting removes large amounts of nutrients with the plant tissue. Therefore, proper nutrition is important in maintaining alfalfa yield and quality year after year.
P – important for seedling vigor, root development, and early season growth – is the most commonly deficient nutrient because it can get tied up by the soil. P deficiency may be difficult to diagnose because it can be mistaken for moisture stress, but in general, plants are stunted and have smaller leaves. K is often required because large amounts of it are removed with each cutting. Additionally, sandy soils and/or soils with a long history of alfalfa production can be low in K.
Soil sampling is a reliable way to assess P and K deficiency, but tissue sampling is another way to test for deficiency. P is deficient when soil levels are 4-P (when plant samples are taken at 1/10 bloom). K is deficient when soil levels are 1/10 bloom).
Use a granule (0-45-0, 11-52-0) or liquid (10-34-0) fertilizer to correct P deficiency. These sources are the most economical. If soil or plant tissue tests show deficient levels, then apply P at a rate of 120-180 lbs P2O5/acre (if yield was around 8 tons/acre) and at a rate of 180-270 lbs P2O5/acre (if yield was around 12 tons/acre). Use muriate of potash (0-0-52) to correct K deficiency, or use potassium sulfate (0-0-52, 18% sulfur) if sulfur was also deficient. Correct K deficiency by applying it at a rate of 300-400 lbs K2O/acre (if yield was around 8 tons/acre) and at a rate of 400-600 lbs K2O/acre (if yield was around 12 tons/acre). Single applications of P should not exceed 100-150 lbs P2O5, and single applications of K should not exceed 200-300 lbs K2O. If soil or tissue tests indicate that higher rates are needed, then apply half of what is needed in late fall/early winter and the other half after the second or third cutting. Both P and K are effectively taken up by plants whether pre-plant incorporated or surface applied in established stands. Use these rates to guide your fertilizer applications – remembering that soil type, climate, and yield will influence fertilizer needs – and keep good records of all laboratory results, fertilizer applications, and crop observations. These records will be helpful in developing a long-term, economical fertilization program.
Additional information on how to soil and tissue sample, as well as tables to guide adequate nutrition, are available from this handout.

