
Applying the right amount of water in each irrigation event is essential to improve both water and nitrogen use efficiency. When irrigation is excessive, water can be lost through deep percolation and/or runoff, carrying soluble nutrients such as nitrate with it. On the other hand, short irrigation durations usually augment the need for increased irrigation frequency, in addition to shortening the root zone depth and restricting the volume of soil a crop uses to explore water and nutrients. Increased susceptibility to drought stress and yield reduction are typical consequences of recurring short irrigation durations. Such conditions are most common during peak production, when the crop is well established and its canopy fully developed, especially if accompanied by warm and dry weather conditions. As a simple analogy, a fully established strawberry crop with most of its roots reaching down to 14 inches depth is less likely to sustain significant yield losses after a few days of limited irrigation, compared to a crop with root depth limited to 8 inches. This difference is even more important in soils of low water holding capacity (e.g. sandy, sandy loam, loamy sand) and during warm and dry weather conditions, such as the Santa Ana winds.
Determining Irrigation Duration using ET data
The most suitable and accurate method for determining irrigation duration of soil-based production of berry and vegetable crops is the ET-based method. Evapotranspiration (ET) is the sum of vaporization processes that occur in a field. If the water vaporizes from the plant surface or soil surface, the process is called evaporation. Water vaporizing inside the plant leaves and diffusing through the leaf pores to the ambient air is called transpiration.
The ET-based method consists mainly of using two parameters to determine the crop evapotranspiration (ETc): the reference evapotranspiration (ETo) and the crop coefficient (Kc).

ETc = ETo x Kc
ETc – crop evapotranspiration is the maximum ET of a specific crop where the crop growth and production is not limited by water availability or plant stress.
ETo - reference evapotranspiration is the ET of a reference surface (usually a grass) not short of water. The only factors affecting ETo are climatic parameters, which can be measured by weather stations. ETo data is provided by the California Irrigation Management Information System, or CIMIS. CIMIS maintains approximately 150 weather stations throughout California that provide ETo and other climatic parameters free of charge to the public.
Kc - crop coefficient values are factors that are multiplied by ETo to estimate ETc. Whereas ETo accounts for weather variation, Kc factors account for crop morphology and physiology. Usually, the bigger the canopy, the higher the Kc.

The importance of relying on weather station data for determining irrigation duration is emphasized in the graphs below, where daily ETo values vary by orders of magnitude in a matter of a couple of days. These variations are common and make it challenging to use a fixed irrigation schedule where the durations and intervals between irrigations are kept the same for weeks.
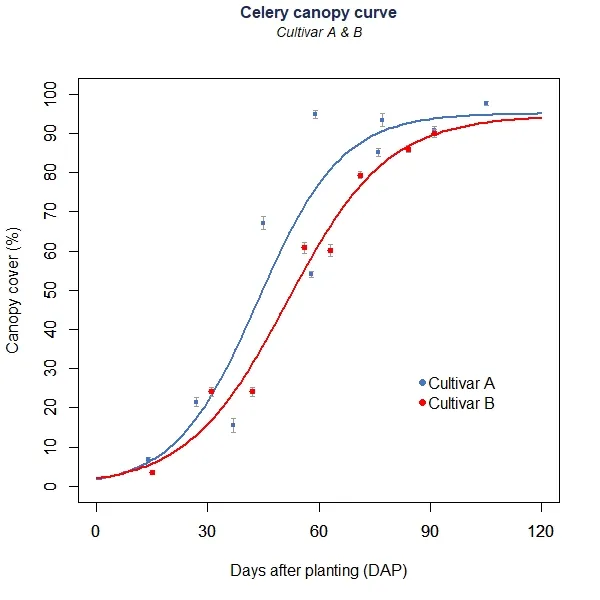
In addition to frequent changes in weather (ETo) patterns, the crop canopy (and its Kc) also changes at an variable rate. The three images below illustrate canopy cover measurements of a celery crop taken with an NDVI camera. Multiple canopy coverage measurements taken throughout the crop cycle can provide a better understanding of how the crop canopy grows, which can be modeled and used to adjust Kc.

The photos above were collected from a celery field as part of a research project designed to assess celery water use throughout the growing season. The higher the canopy area, the higher the Kc and water use.
For more information on crop coefficients, click here.
Irrigation Calculator
This calculator determines crop ET since the last irrigation based on weather data from local weather stations associated with crop crop canopy size. It can be used on a smartphone (saved to home screen as an app), or on a desktop/laptop through a web browser like Chrome.
This version is available for strawberry, celery, cabbage, broccoli and cauliflower: https://ucanr-igis.shinyapps.io/irrigation-calc/
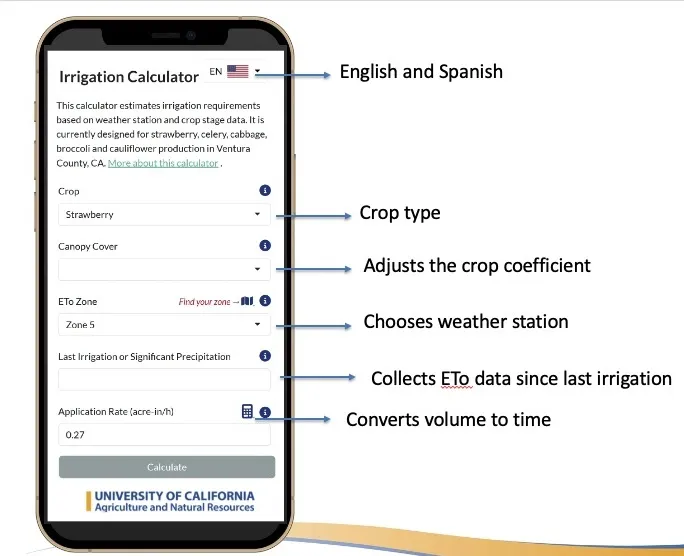
Instructions: enter crop type, canopy cover estimation (use Canopeo if unknown), choose the ETo zone based on field's location (click on map for details), and select the day of the last irrigation or significant precipitation in the calendar. A default application rate is chosen for each crop, and it can be modified by clicking in the calcalculator button. Click "Calculate" to view result in hours&min and inches/hour.
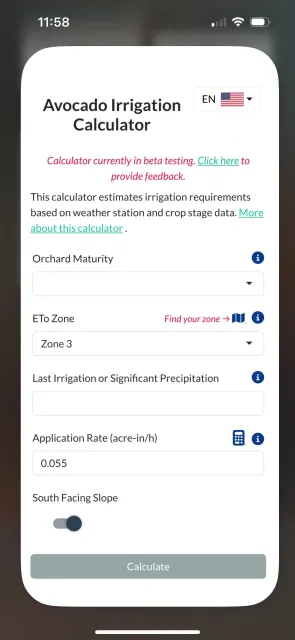
This version is available specifically for avocado: https://ucanr-igis.shinyapps.io/irrigation-calc-avo/
Using CropManage for irrigation recommendations
CropManage is a free web-based software that makes irrigation recommendations based on current ETo data from CIMIS and crop parameters created with local research. Once a profile and field are setup, the software creates irrigation recommendations with only a couple clicks. For details about how CropManage works, click here.