Create an Attendee Map for an Event
Andy Lyons
October 2022
IGIS Tech Notes describe workflows and techniques for using geospatial science and technologies in research and extension. They are works in progress, and we welcome feedback and comments below.
Summary
Attendee maps are a nice way to get participants excited about an event. Whether your event is in-person, virtual, or hybrid, a map of where people are coming from can instill a sense of community and help people make connections.
This Tech Note will demonstrate how to make an Attendee Map from a registration list using ArcGIS online, and embed it in your event web page.
Design goals
There are of course many ways to make web maps. They can be static or interactive, simple or complex. Here our design goals shall be:
- A fairly simple web map that primarily shows where attendees are coming from across California and to a lesser extent other states.
- We want a background that includes state boundaries and major cities, but not much else. We don't want to distract from the dots.
- To protect privacy, we'll only map attendees to their city, and omit personal details like name or affiliation. When you click on a dot, a popup window will show the number of attendees from that city, but nothing else.
- We'll create an interactive version of the map, so people can zoom and pan around, and embed it on the event website. But we won't embed it on the landing page, because interactive maps can take some time to load and add interactivity that may not be expected. Instead, we'll add a static thumbnail image on the landing page, that takes you to a dedicated Attendee Map page where the map is the main content.
- The embedded interactive map should be as large as possible, but must also be responsive. This means it will automatically get smaller on smaller devices (e.g., phones), as opposed to be spilling beyond the screen dimensions.
- Our attendee map should also be easy to update. When we get new registrations, we want to be able to add them to map in as few steps as possible.
Attendees of the (fake) Master Beekeepers 2022 Annual Conference
Are you ready to build this thing?
Step by Step
We can divide the steps to build our attendee map into five sections:
- Design the registration form to collect location information
- Turn the registration list into a CSV file formatted to be the source for a web map
- Design the web map on ArcGIS.com
- Embed the web map in your event webpage
- Update the CSV file when you get more registrations
1. Add Locations Questions to the Registration Form
It goes without saying that if you want to make an attendee map, you need to ask people where they're coming from! You can save yourself a lot of headaches by a few practices:
- Ask people to entire their location in several short-answer questions (e.g., city, state, and country), rather than one big text box. This will make the information more consistent and thus easier to map.
- City and state are usually enough to make a map. You can add zip code if you'd like.
- If your attendees are coming from multiple countries (not uncommon with virtual events), you'll need to add a question for 'country'. You should also change the question 'State' to 'State / Province', and 'Zip' (if you use it) to 'Zip / Postal Code'. Remember that postal codes outside the US often include letters.
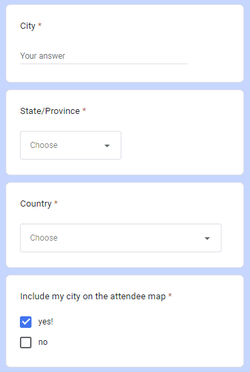
- Use drop-down boxes for state and country. This will reduce spelling issues that can create errors on the map, can save you from having to manually standardize abbreviations, capitalization, etc. You can put the most common choices (i.e., 'CA', 'United States') at the top of the list for user convenience, and have an 'Other' option if needed. Click the links below to copy-paste a list of states and countries into your registration form editor.
Lists of US states and countries
You can copy-paste the following lists of US states and countries into your registration form editor.
- If you want people to appear on the map, make the location questions on the registration form required!! At a minimum city, state, and potentially country should be required.
- We won't map the exact location of people, but if privacy is a concern, consider an 'opt-in' question on your registration form. It can be as simple as a check box that says "include my city on the attendee map". Making the default option 'yes' is probably a good idea if you think most of your attendees will want to be on the map.
2. Format the registration list as a CSV file for the map
Now that we have a well-designed registration form, the next step is to convert the registration list into a CSV file that is ready to upload to ArcGIS.com.
Exactly how you do this will vary tremendously depending which registration system you're using (i.e., Google Forms, ANR Survey Tool, EventBrite), and which spreadsheet or data wrangling tool you use (e.g., Excel, R). But the end goal in all cases is a very simple CSV file with two columns:
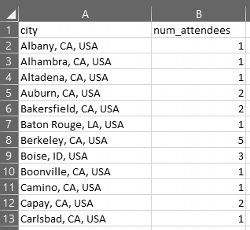
You may be wondering - where are the longitude and latitude coordinates? The short answer is that ArcGIS.com will look them up when you upload the CSV file. As long as the location info is formatted using a convention that ArcGIS can recognize (like 'city, state, country'), and there are no spelling errors, it will be able to correctly locate the city.
Tip: To make updating easier later on, give your CSV file a generic name like "event_attendees.csv", as opposed to a file name that has the date or version included (e.g, "reg_list_v3_sept-15.csv"). This is because ArcGIS only allows you to update a web layer by uploading another CSV file with the exact same file name.
Some general cleaning steps for your registration list include:
- Verify there are no duplicate records (e.g., sort the list by last name or email).
- Verify there there are no registration entries for people who have canceled.
- If you have an opt-in question, make sure registration entries have been filtered appropriately.
- Verify the 'city' column contain actual city names, the 'state' column contains valid state names, and so on. You'd be amazed what people sometimes enter in registration forms!
- In order to compute the number of attendees per city, the column(s) with location info (e.g., city, state) must use the exact same spellings and capitalization. If you had a well-designed registration form, this should be easy. But if needed, you may have to manually make state names uniform (e.g., 'Californa' --> 'CA'), make everything all caps, delete trailing and leading white spaces, etc.
- You can leave the location fields as separate columns, or join them together in a single column. But if you're going to compute the number of attendees per city using Excel Pivot Tables (see next), you're better off combining them in a single column.
Computing the Number of Attendees Per City with Excel Pivot Tables
There are a number of ways to compute the number of attendees per city. If you know R you can do it in a single line of code. In Excel you can use Pivot tables:
- Write an formula to combine city + state + county in a single column
- Select the combined location column then go to Insert >> Pivot table. Tell it to put the pivot table on a new sheet.
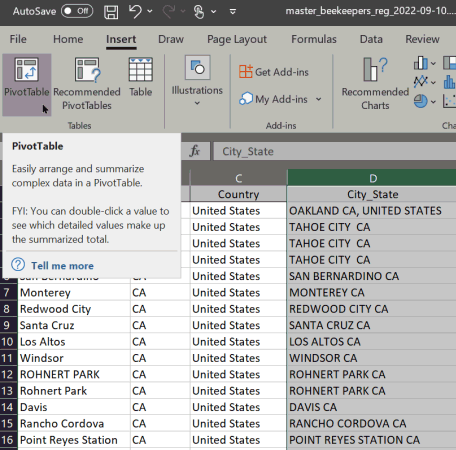
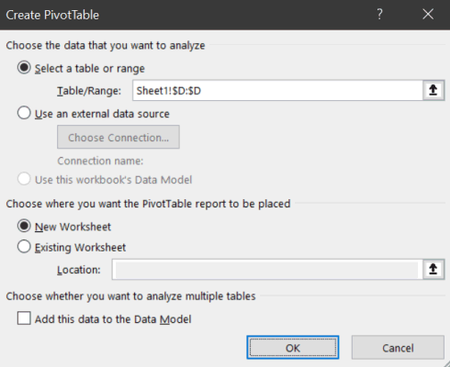
- Drag the location column to the 'rows' and 'values' boxes
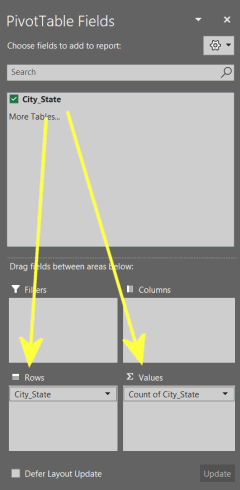
- Save the pivot table as a CSV file
- Open the CSV file in notepad or Excel, and verify that everything looks ok (i.e., no attendee names, no subtotal rows at the bottom, no blank lines, etc.)
Does your CSV file look like the one above? If so you're now ready to make the web map!
3. Create the web map on ArcGIS.com
- Log into ArcGIS.com
- On the 'Content' tab, create a new folder for your attendee map (recommended)
- Click 'New Item' then drag 'n drop CSV file to upload:
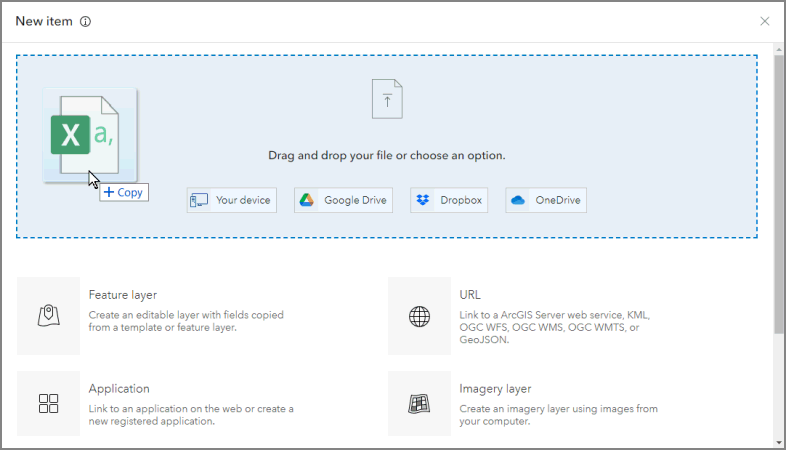
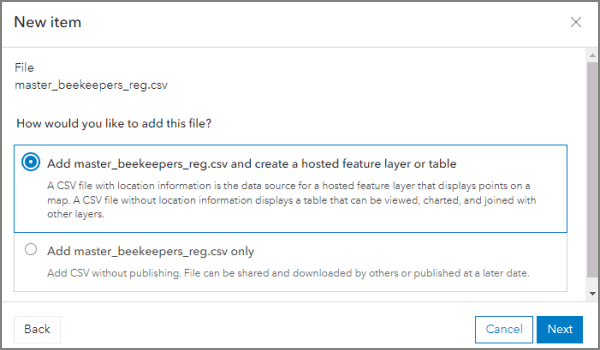
- When asked, choose to publish the CSV as a hosted feature layer:
- Confirm the fields you want to publish:
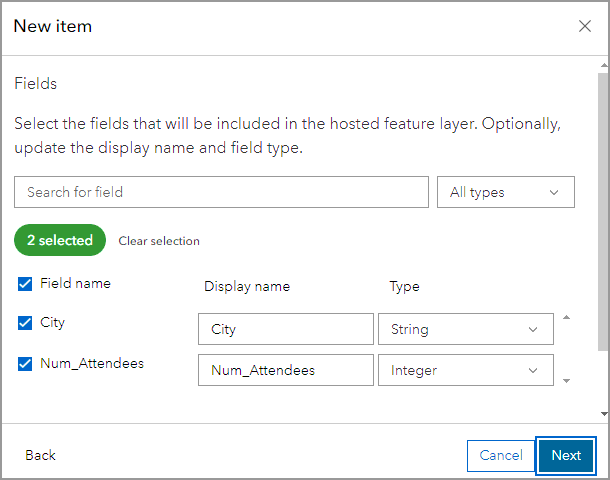
- Confirm the location field(s):

- Open the Feature Layer in the Map Viewer Classic
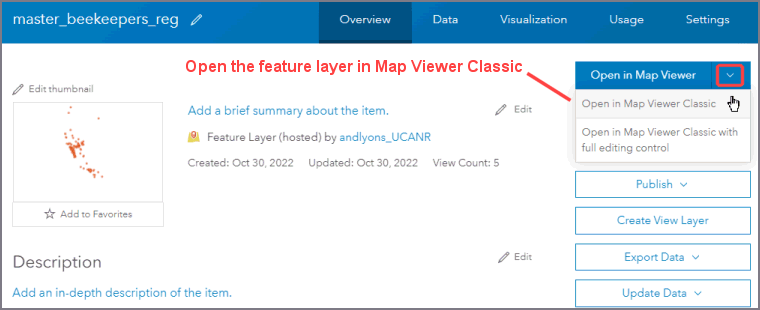
Note: As of October 2022, the Map Viewer Classic is the recommended web map editor for embedding a simple web map like an attendee map. The 'new' web viewer has a lot of extra bells and whistles, but none of them are useful or relevant for this use case. Furthermore, the 'new' web map viewer does not support embedding, so you have to go thru several additional steps of creating an additional web app for your web map, configuring it, writing your own embed code, etc. This may change in the future when the 'new' web maps catch up to the 'old' version, but for now the Map Viewer Classic viewer is recommended.
- Select a basemap:
Tip: select a simple basemap to emphasize the attendee locations
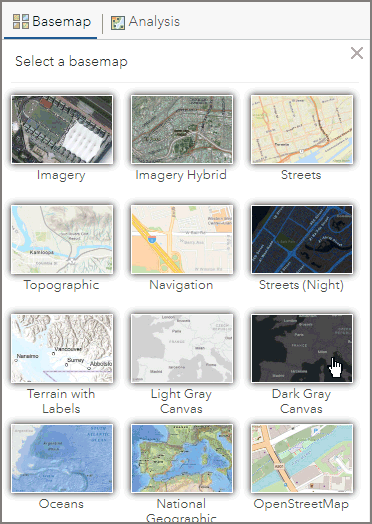
- If your basemap uses reference labels, make them a separate layer. This will prevent the labels from being drawn on top of the attendee points when zoomed in, and potentially obscuring them.

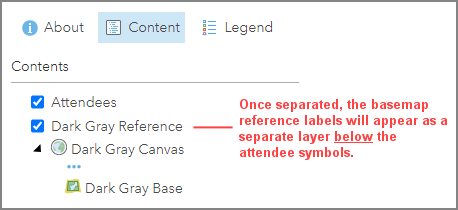
- Rename the layer to something like 'Attendees':
a) Click on the layer to see the options
b) Click the three dots
c) Select 'Rename' from the popup menu

- Edit the symbology for the points:
a) Click on the layer to see the options
b) Click the Symbology button:
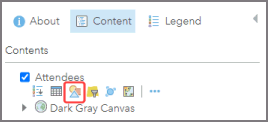
- Select a numeric column for the attribute to show, then goto Options under 'Counts and Amounts (Size)'
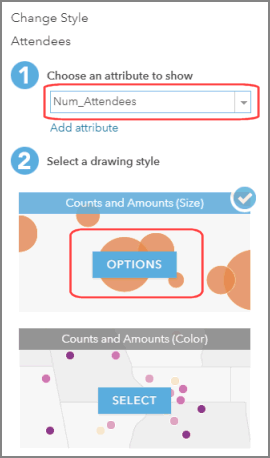
Tip: You can symbolize the points by color instead of size, or even use a heat map! Experiment to find the options that work best for your event.
- Set the graduated symbol size options:

- If you haven't already, save your map.

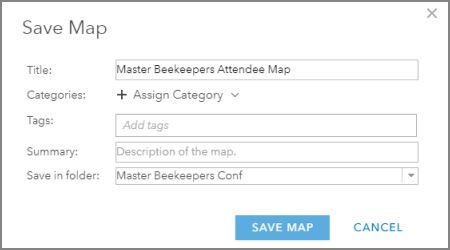
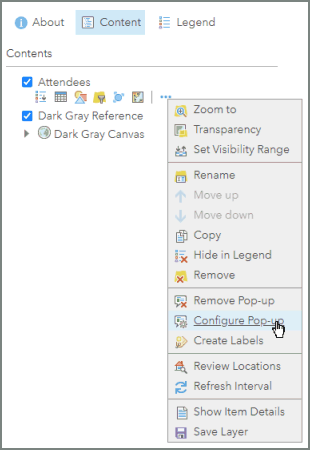
- Configure the pop-ups:
a) Click on the layer name to see the buttons below it
b) Click the three dots
c) Select 'Configure Pop-up'
Tip: if you don't want pop-ups, select 'Remove pop-up'
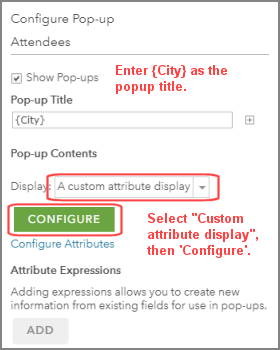
- Customize the pop-up:
a) Modify the pop-up title with the name of the city
b) Select 'Custom attribute' display and click the 'Configure' button
- Edit the Custom attribute display:
a) You can type any text in the custom display
b) To insert an attribute field value, type its name in curly braces (click the '+' button)
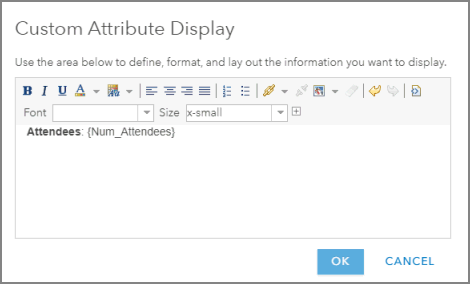

- At this point your web map is basically done. Remember to Save it before doing anything else.
4. Embed the Map in Your Event Webpage
Finally, we have a web map that's ready to embed. In general, interactive web maps should made as wide as possible, to give people the ability to zoom and pan around with the mouse, open pop-up windows, etc.
Another goal is to make it responsive, which means the 'frame' for the embedded map will be smaller on small devices, rather than spill off the page. Viewing interactive maps on small screens can also affect where to put the zoom controls, home button, etc. Catering for small devices is one of the reasons we decided to keep the overall design pretty clean.
The Map Viewer Classic can generate the embed code for you. This is extremely helpful and one of the reasons we decided at the beginning to use the MVC rather than the new web map viewer, which requires you to embed your web map in an web app, then figure out the embed code yourself.
- To generate the embed code:
a) Zoom to the extent you want shown when the map opens
b) Click the Share button
c) Share the map with Everyone.
d) Click 'Done'. If prompted to also update the sharing settings of the layers, select 'Yes'.
e) Come back to the 'Share' settings and click 'Embed in Website'

- Set your embed options, then click the 'Copy HTML' button:

- Paste the embed code in your event web page
How and where you place the embed code depends on your web platform.
Option 1: Plain HTML
If you're not using any Content Management System (like WordPress, Site Builder, etc.), you can just paste the embed code into the 'source view' of your web page where you want it to appear.
Option 2: A CMS based on Bootstrap (including ANR SiteBuilder)
If you're using a web platform based on Bootstrap, you can copy the embed code in the 'source view' of a textbox.
If you want the map frame to be responsive, you'll need to do a little bit of editing to the embed code. Editing the embed code is not hard, but first you have to decide whether you want the aspect ratio of the map frame to be 16:9 (wide), 4:3 (standard), or 1:1 (square). The final results should look like the one below (the green text are the bits that are new / modified from the embed code generated by the Map Viewer Classic). See notes below for details.
<div class="embed-responsive embed-responsive-16by9">
<iframe width="500" height="400" class="embed-responsive-item" frameborder="0" scrolling="no" marginheight="0" marginwidth="0" title="Master Beekeepers Attendee Map" src="https://ucanr.maps.arcgis.com/apps/Embed/index.html?webmap=8d178d00f8c54ad18443c640f1a48863&extent=-128.5995,31.7048,-102.6938,43.0488&home=true&zoom=true&previewImage=true&scale=false&disable_scroll=false&theme=dark"></iframe>
</div>
Notes:
- As shown above, to make the map responsive you wrap the <iframe> within a div that has two bootstrap classes. Depending on the desired aspect ratio of map frame, you can swap in one of the following for the 2nd Bootstrap class (details):
.embed-responsive-21by9
.embed-responsive-16by9
.embed-responsive-4by3
.embed-responsive-1by1
- As shown above, the iframe tag should also be given: class="embed-responsive-item"
- The height and width attributes of the iframe tag should be omitted entirely (or set to "100%", their default values). The dimensions of the iframe will instead be determined by the enclosing div.
- Insert https: in the src URL
- Many of the map properties are defined by parameters in the URL. For example if previewImage=true, a static image will be displayed while the map is loading. Feel free to experiment with these to see the effects.
- The initial map extent is also saved in the URL. The easiest way to change that is to go back to the Map Viewer Classic, zoom to the extent you want to be initially visible, and re-generate the embed code.
Other embedding tips:
- If you don't have much space to embed the map, consider inserting a small, static thumbnail image that is hyperlinked to another page with the full map. The easiest way to make a thumbnail image is by taking a screenshot (i.e., Print Screen), and then crop and resize it in an image processing program (like Paint).
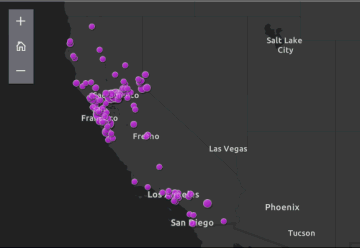
Click on the static thumbnail image
to go to a full size version of the map.
- If you're working with ANR SiteBuilder, don't be alarmed by the small size of the map preview in the editor. It will appear at the proper size on the final page.
5. Update the Map
If your event registration changes, you should be able to update the map without having to repeat everything from scratch.
The first step is to re-generate the CSV file. If you used Excel with the pivot-table method shown above, you'll have to repeat all those steps. If you used R or another scripting tool to compute the number of unique attendees per city, simply repeat the workflow.
The updated CSV file must have the exact same columns as the original, and the exact same file name. If you want to keep the original CSV file for posterity, rename it or move it to a different location.
After you've created an updated version of the CSV file with the same structure and file name, you simply update the attendee Feature Layer. Go back to the Content tab in ArcGIS.com, click on the Feature Layer, and update the Data source:

After you've updated the Feature Layer data, if you refresh the map you should see the new data!
Conclusion
There are a number of steps to creating an attendee map from an event registration list, but once you've gone through the process once or twice it gets a lot easier. The trick is to be thoughtful about how you prompt for location information on the registration form, so you don't have to do a lot of data cleaning, and to keep visual appearance fairly simple.
There are of course many variations to this basic recipe. If you found this useful or would like to suggest a variation, please leave a comment below. And of course we would love to see your attendee maps!
This work was supported by the USDA - National Institute of Food and Agriculture (Hatch Project 7003843; Meyer).