Total harvested acres
Grape Notes
Article

Production and economic trends for San Luis Obispo and Santa Barbara County vineyards

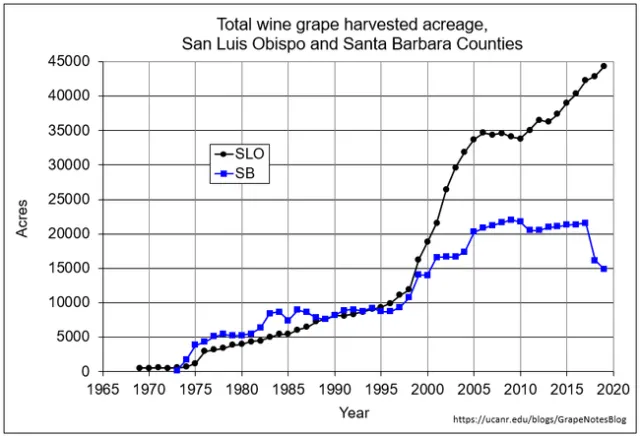
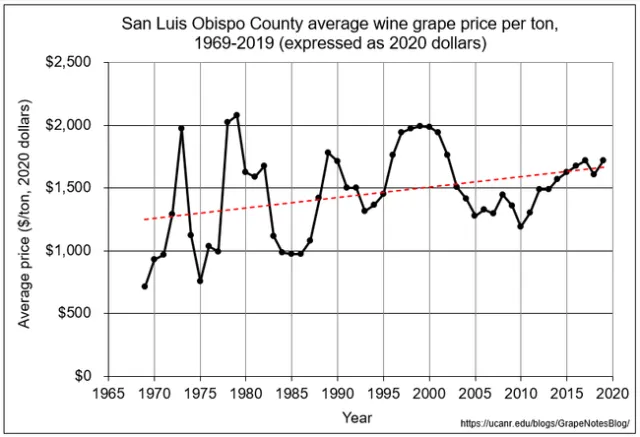
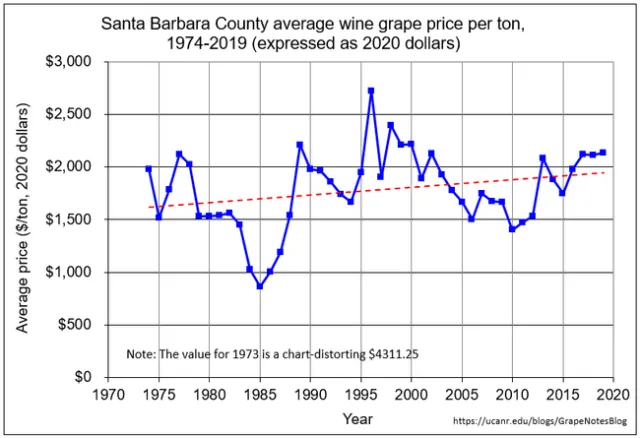
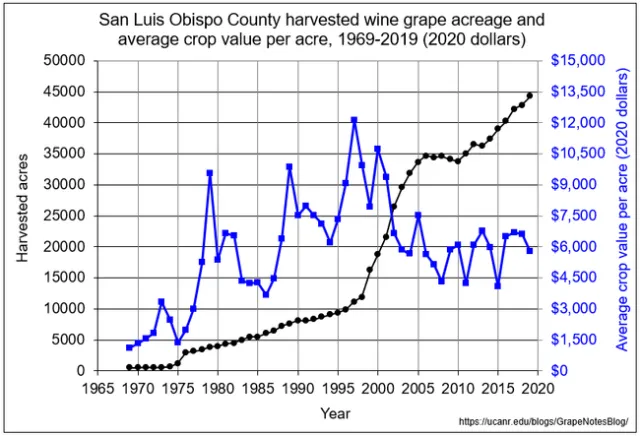
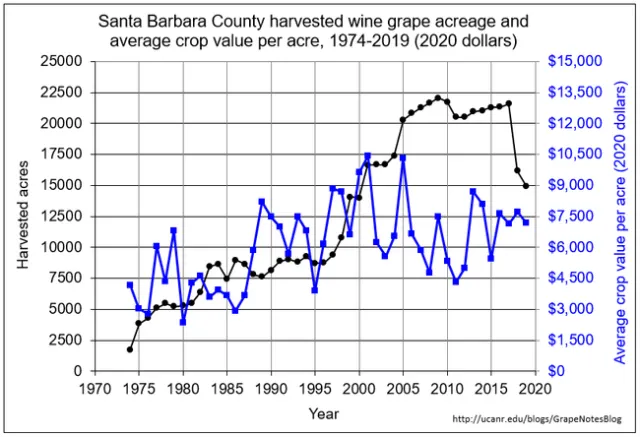
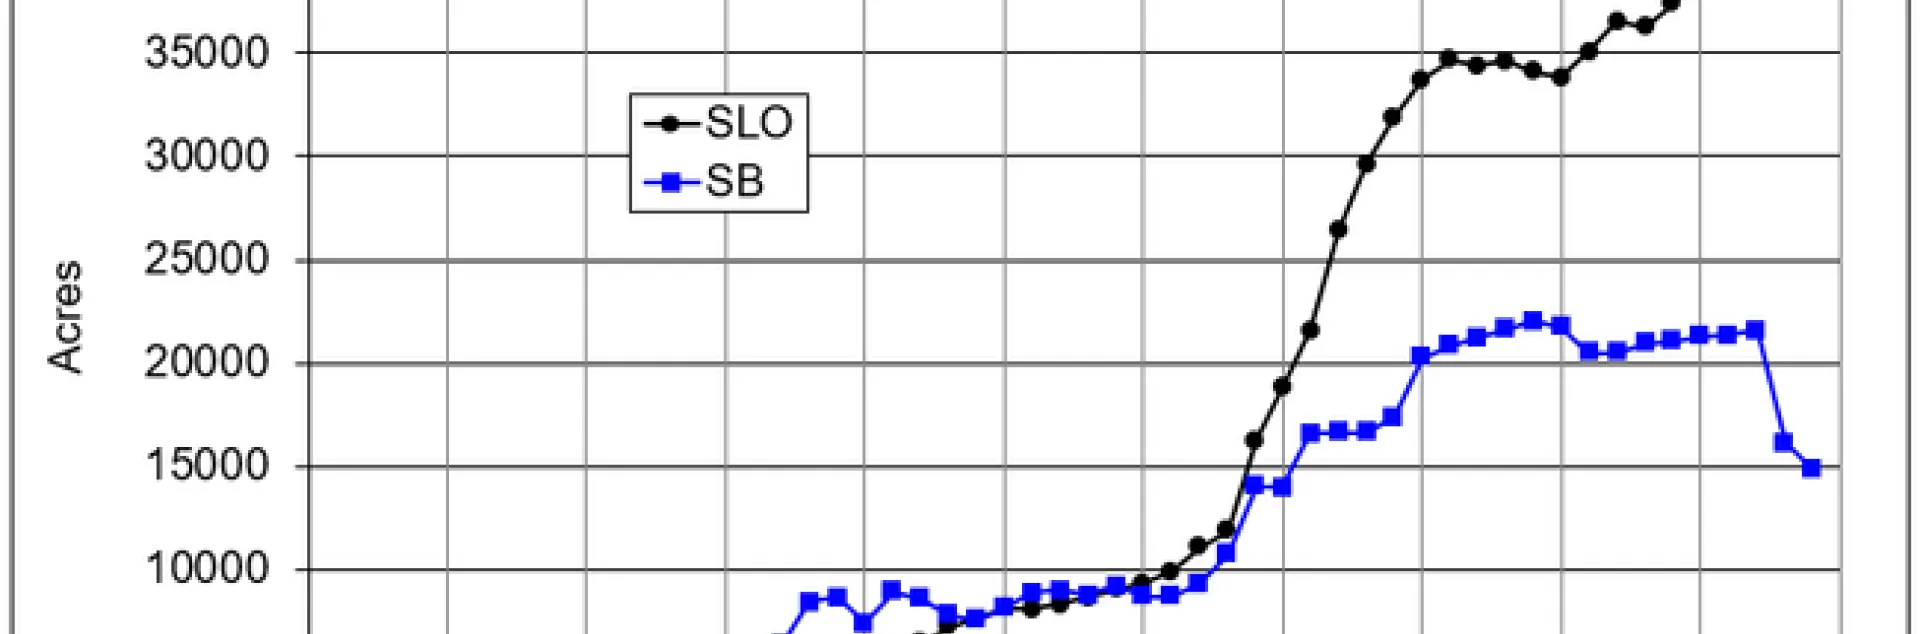
The following charts are updates of similar ones first presented here in 2015; they now include values through the 2019 harvest. They are helpful to appreciate the divergent paths that the wine grape industries in each county have been experiencing in recent years.

This difference can be explained in large part by the unequal crop options that are available for producers in the different counties. Farmers in much of Santa Barbara County have a large range of potential crops to choose from, including citrus, berries, flowers, cannabis, etc. The notable decline in wine grape acreage in that county in recent years likely reflects the shift in cropping to these other options which may offer better returns currently. Conversely most of the wine grape regions of San Luis Obispo County do not have the same number of crop options, due to the limitations of climate, water availability, and County restrictions on crops such as cannabis. Wine grapes are a very suitable crop for the particular growing conditions in the county, but the lack of alternative crops presents additional challenges during periods of excessive wine grape supply.

The charts tend to speak for themselves, so it will be left to the reader to draw their own conclusions.

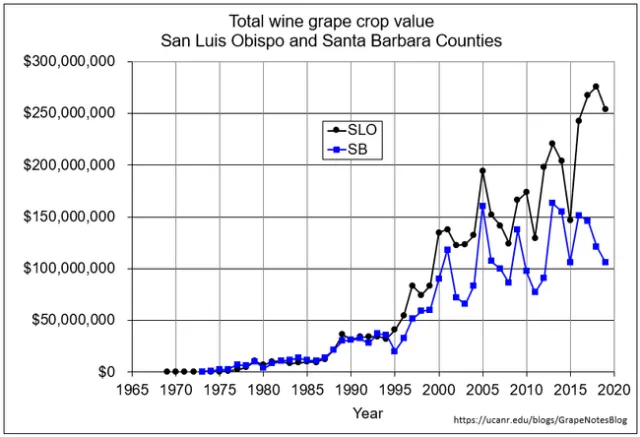
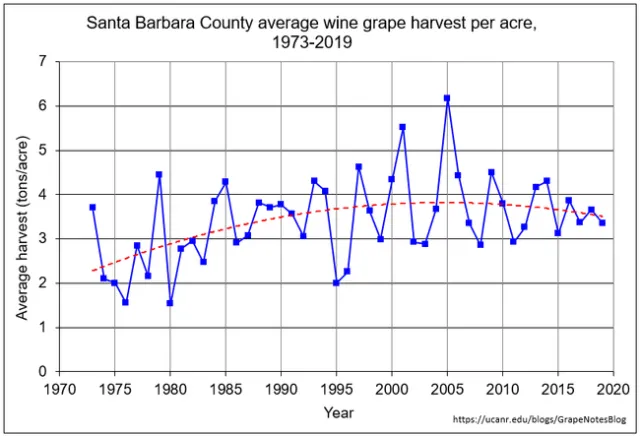
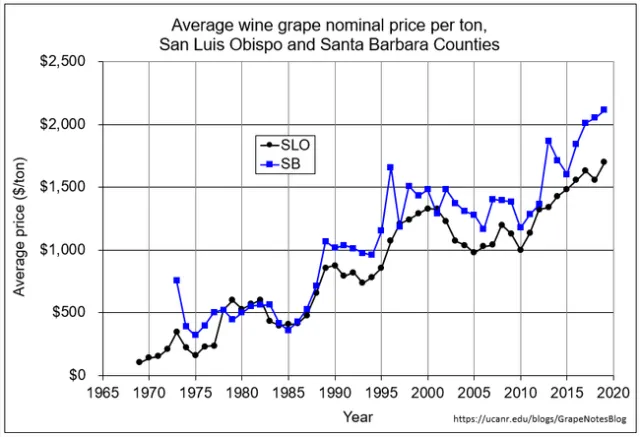
The data sources are the Ag Commissioner Crop Reports for SLO and SB Counties. Four of the charts use dollar amounts adjusted for inflation using the CPI Inflation Calculator, to Oct 2020 values.

The Excel data files used to make these charts are available for download on the UCCE website.

Total harvested acres
Line graph showing total wine grape harvested acreage in San Luis Obispo and Santa Barbara counties increasing over time.
Total production
Line graph comparing total wine grape production (tons) in San Luis Obispo and Santa Barbara counties over time.
Total crop value
Line graph showing total wine grape crop value rising in both counties over time.
SLO tons per acre
Line graph of San Luis Obispo County average wine grape yield per acre from 1969–2019.
SB tons per acre
Line graph of Santa Barbara County average wine grape yield per acre from 1973–2019.
Nominal price per ton
Line graph comparing average wine grape price per ton in San Luis Obispo and Santa Barbara counties.
SLO adjusted price per ton
Line graph of inflation-adjusted average wine grape price per ton in San Luis Obispo County (1969–2019).
SB adjusted price per ton
Line graph of inflation-adjusted average wine grape price per ton in Santa Barbara County (1974–2019).
SLO acreage and crop value per acre
Line graph showing San Luis Obispo County harvested acreage and average crop value per acre over time.
SB acreage and crop value per acre
Line graph showing Santa Barbara County harvested acreage and average crop value per acre over time.
SLO bearing non bearing acres
Line graph showing bearing and non-bearing wine grape acreage trends in San Luis Obispo County (1999–2019).
Similar information on bearing vs. non-bearing acreage is not available from the Santa Barbara County Crop Report.