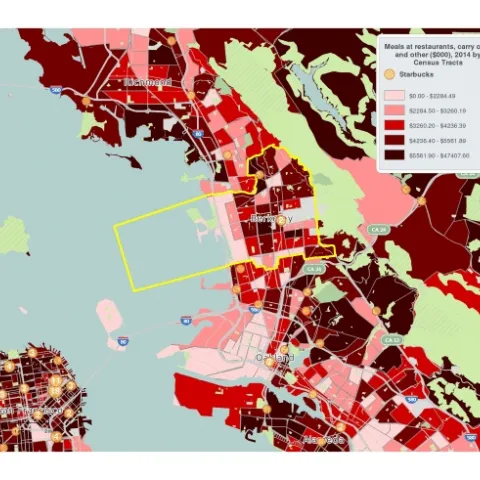
Today I went to a great D-Lab Workshop on Demographic Mapping Tools. Berkeley's GIS and Map Librarian, Susan Powell walked us through the use of several very easy to use mapping tools available through UC Berkeley. Both are really great for quickly visualizing data from many different sources.
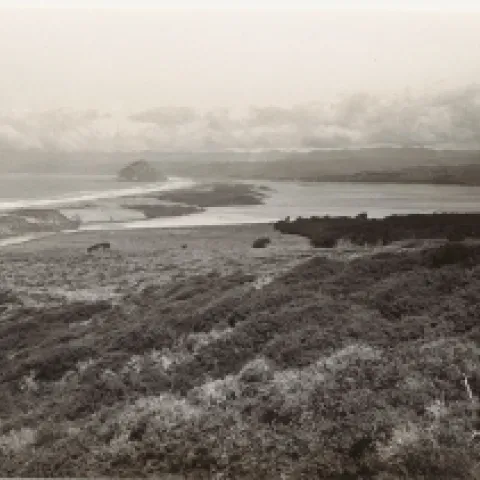
Plus sa change, plus sa la meme chose. Thanks to Heather Constable, who went out exploring near Morro Bay. Here is one of her retakes. Date of original photo: Feb 25, 1936, taken in San Luis Obispo County, California, US. Looking north toward Morro Bay.
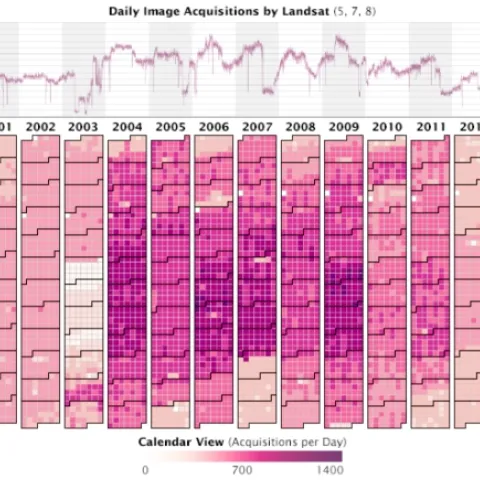
Very nice overview of how the Landsat archive has jump started new avenues in earth science, ecoinformatics, and public communication and participation. In 2008, the U.S. Geological Survey took 3.6 million images acquired by Landsat satellites and made them free and openly available on the Internet.
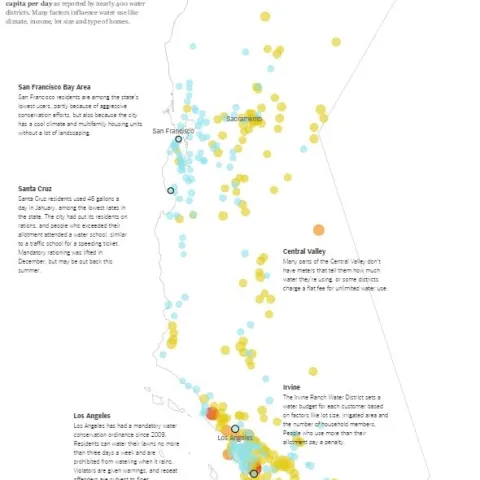
In response to Gov. Jerry Brown's announcement yesterday, calling all California residents to reduce water use by 25%, the folks at the New York Times put togther a nice interactive map. The map shows residential water use in California in gallons per day.
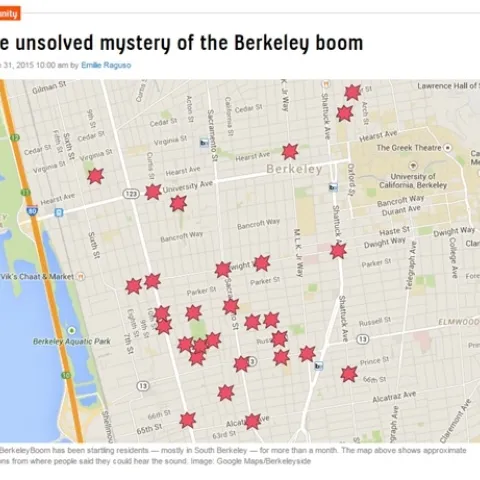
Last night we heard the Berkeley Boom again. Weve been hearing this thunderous boom quite frequently in the last month here in Berkeley, but this one sounded bigger than most. Car alarms went off on the street. The dog jumped. What IS that? I wondered aloud.