- Author: Michael D Cahn
CropManage Workshop
Monterey County Agricultural Center Conference Room
1432 Abbott St, Salinas CA 93901
Thursday, May 1st 2014
(8:30 am – 12 pm)
We will offer a hands-on training to learn in depth about the features of CropManage, a free decision support tool for water and nitrogen management of coastal crops. In addition to head and romaine lettuce, CropManage now supports broccoli, cauliflower, cabbage, and strawberries.
This training will provide an opportunity to learn how to use CropManage for improving the efficiency of your farming operations or for adding value to your consulting services. We will provide in depth hands-on training so that you can learn step-by-step how to navigate and use CropManage for assisting with fertilizer and water management decisions and record keeping. Wi-Fi internet access is available at our conference room so please bring a laptop or tablet computer so that you can follow along as we tour through the features of the software. There should be sufficient time to answer questions as we cover the following topics:
Agenda:
8:30 – 9:00 Registration and Refreshments
9:00 – 9:30 Introduction to CropManage
9:30-10:15 Getting started with CropManage
10:15 (Break)
10:30 – 11:00 Using CropManage for decision support and record keeping
11:00- 11:30 Navigating around and advanced features
11:45-12:00 Discussion of new features or changes needed.
To keep the group size manageable so that we can provide individual help, we would like to limit the workshop to 30 participants. If you have attended previous workshops and or feel proficient in using the on-line tool, then you are welcome to just attend the second half of the workshop (10:30-12 pm). Whether or not you plan to attend the entire or part of the workshop, please RSVP in advance by sending an email to larriaga@ucdavis.edu or mdcahn@ucdavis.edu with the subject heading “CropManage workshop” and let us know the number of participants in your group. We will email you a confirmation. Thank you, and I hope to see you soon.
Respectfully,
Michael Cahn, Irrigation and Water Resources Advisor
Monterey, San Benito, and Santa Cruz Counties
- Author: Laura Murphy
- Author: Michael D Cahn
- Author: Richard Smith
Nitrate test strips are an affordable tool for quickly measuring nitrate (NO3) in soil and water, and can help farmers and crop advisers adjust fertilizer inputs to match the nitrogen (N) needs of various types of crops. There are now a variety of brands of nitrate test strips available, many of which are manufactured for testing the quality of aquarium water, but may also be suitable for soil testing. All of the brands of test strips are used in a similar fashion: the strip is briefly dipped into an extractant solution (for soil) or in water, and allowed to develop color during a standard interval of time, usually ranging between 30 and 60 seconds. After color develops on the strip, a color chart, calibrated to either parts per million (ppm) of NO3 or expressed in ppm equivalents of nitrogen (NO3-N), is used to determine the NO3 concentration of the sample. Multiplying Nitrate-N concentration by a factor of 4.43 converts the reading to NO3 concentration. Because the strips may continue to develop color with time, it is important to always read the strips at a standard time interval, or the measurements will not be accurate or repeatable. More detailed information on using the nitrate test strips for monitoring soil nitrate levels was presented in several of our past bulletins, newsletters, and blogs.
Depending on the soil type and crop nutrient requirements, vegetable farmers need test strips that are accurate for soil NO3-N concentrations ranging between from 5 to 30 ppm, which would roughly correspond to a range of 10 to 60 ppm of NO3 in the nitrate quick test extract solution. For strawberry production, and other crops that have a slower N uptake rate than vegetables, growers need test strips that are accurate over a narrower range of soil NO3 concentrations (5 to 15 ppm NO3-N in soil). Past studies have demonstrated that the Merckoquant test strip are accurate for measuring soil NO3-N in the range of 10 to 40 ppm. Because more brands of test strips have become commercially available in recent years with varying ranges of sensitivity, and the need to identify test strips that are accurate for measuring low concentrations of soil NO3-N (0 to 15 ppm), we evaluated the accuracy and ease of using six commercially available brands of test strips over a range of nitrate concentrations found in commercial agricultural fields.
Procedures:
A stock solution of a known NO3 concentration was prepared by dissolving a measured weight of sodium nitrate (NaNO3) into 1 liter of distilled water. This stock solution was further dilluted with distilled water to standard nitrate concentrations that matched the values of the color chips of the various test strips evaluated in this study. The NO3 concentration of each standard solution was confirmed by spectrophotometric analysis.
Each brand of strip was evaluated at NO3 concentrations corresponding to the color chips provided by the manufacturer. The Hach Aquacheck and Lamotte Instatest NO3/NO2 strips differed from the other brands because the color chips were calibrated in equivalents of NO3-N rather than NO3. For convenience of displaying and comparing the data, results for these two brands were converted to NO3 (by multiplying the NO3-N values by 4.43). The Merckoquant NO3/NO2 test strip was the brand originally tested by UC Cooperative Extension for use with the soil nitrate quick test, and was considered the standard in this evaluation. This strip measures to a maximum of 500 ppm NO3, but was only evaluated up to 250 ppm NO3 (56 ppm NO3-N) for this test.
Each brand of test strip was evaluated 4 times for each standard NO3 solution corresponding to the manufacturer's chip color chart. The procedure that we followed to determine NO3 concentration was to dip the strip briefly in solution, and hold it horizontally after removing it, allowing color to develop for the interval specified by the manufacturer. Most strip manufacturers recommended a 1-minute time interval between wetting and reading the strip color. The manufacturer for API 5-in-1 and LaMotte Instatest 5-Way recommended reading test strips after 30 seconds, but results appeared to be more accurate after a 60 second interval, therefore all results reported for these strips are from readings taken 60 seconds after placing the strip in the test solution. After waiting the specified interval, the color of the test strip was compared to the color chips provided by the manufacturer. If the test strip color matched one of the chips, then the value of the chip was recorded. In many cases, the color of the test strip was between 2 of the standard chips, and in these cases an estimate was made based on comparing the intensity of the color development with the 2 closest matching chips. Because this method relies on visual observations, all tests were made in a room with ample lighting and by one observer.
Results:
The mean NO3 values measured using different brands of test strips were compared to the standard solution values in Table 1. Some brands of test strips appeared to be accurate at specific ranges of NO3 concentration. The Merckoquant NO3/NO2 brand was the most accurate for the full range of NO3 concentrations (Table 1). The next most accurate brand over the entire range of NO3 concentrations evaluated was the LaMotte Instatest NO3/NO2. The Hach Aquacheck was accurate for the range of 10 to 90 ppm NO3 but measured NO3 lower than the standard solutions at concentrations above 100 ppm NO3. The remaining brands of test strips, LaMotte Instatest 5-way, API 5 in 1, Tetra 6 in 1 Easystrips, all measured less NO3 than the standard solutions over the range of 20 to 200 ppm NO3. These strip brands should probably not be used for the soil nitrate quick test and for assessing nitrate concentration in irrigation water.
Although the LaMotte Instatest NO3/NO2 also had good accuracy across the range of 20 ppm to 220 ppm NO3, it did not have a standard color chip for evaluating NO3 at low concentrations, and therefore may not be suitable for strawberries and other crops where soil nitrate is typically in the 5 to 15 ppm NO3-N range. Both the Merckoquant and Hach brands were accurate for measuring NO3 at low concentrations (10 to 40 ppm). Although the Hach Aquacheck strip had a color standard of 5 ppm NO3, the strip was not able to measure NO3 at a concentration below 10 ppm (Table 1).
With the exception of the Merckoquant NO3/NO2, all test strips were purchased online through Amazon.com. The price reported for the strips in Table 1 was the purchase price advertised at the time our study was conducted (January 2014). Some strips were available in larger quantities or from other vendors, for different prices. The Merckoquant NO3/NO2 can be purchased from Cole-Parmer (http://www.coleparmer.com) or at EMD Millipore (http://www.emdmillipore.com).
Summary
We identified 3 brands of test strips that accurately measured NO3 and can be used to quickly assess the concentration of NO3 in soil or water. Both the Merckoquant NO3/NO2and the Hach Aquacheck strips were accurate for measuring concentrations of NO3 as low as 10 ppm, which would roughly correspond to 5 ppm NO3-N in soil. No brand of test strip measured NO3 accurately below 10 ppm. Several brands of strips that measure NO3 in addition to other constituents in water were found to under estimate NO3 concentration, especially at high values. While laboratory analysis of NO3 is generally more accurate than using colorimetric test strips, the strips tested in this study appear to be sufficiently accurate to estimate the level of residual mineral N in soil samples and for determining the NO3 contribution from irrigation water, and should be useful for quickly assessing soil N status before making a fertilizer decision.
Table 1. Comparison of nitrate-test strip and standard solution values.

- Author: Michael Cahn, Irrigation and Water Management Advisor
- Contributor: Thomas Lockhart, Staff Research Associate
- Contributor: Laura Murphy, Staff Research Associate
An important benefit of drip irrigation is the ability to apply fertilizer through the irrigation water, permitting growers to spoon-feed nutrients, such as nitrogen (N), to their crops. By avoiding applications of large amounts of N fertilizer when the crop is small and uptake rates are low, losses of nitrogen by leaching can be minimized. Also, unlike furrow and overhead sprinklers, drip can deliver fertilizer in the zone where roots are most concentrated.
While drip fertigation offers several advantages for managing nitrogen fertilizer during the season, success depends on the management of the drip system and using best practices for fertigation. Drip systems with poor distribution uniformity may likely cause fertilizer to be unevenly distributed within a field. Also, the strategy of injecting fertilizer into a drip system can affect the distribution of fertilizer to the crop. Proper fertigation requires injecting at a steady rate and at a location that provides sufficient mixing of fertilizer with irrigation water. To assure that the fertilizer uniformly distributes within the field after an injection, sufficient irrigation time with clean water is needed so that all of the fertilizer is flushed out of the drip tape before the irrigation ends.
For drip to be economical for vegetable growers on the central coast, most farming operations retrieve drip tape after each crop is harvested and repair and reuse the tape for 8 to 12 crops. Breaks and leaks in the tape are repaired using a splicing machine (Figure 1). Growers have expressed concern that fertigating through their drip systems is not resulting in even applications of N fertilizer after the tape has been reused for multiple crops. Splicing machines often do not fully repair leaks in tape, and emitters tend to plug over time unless the tape was adequately maintained by flushing and chemical treatment.
In response to grower concerns, we evaluated the uniformity of applied water and nitrogen fertilizer for surface placed drip in 11 commercial lettuce fields during the fall of 2012 and during the spring of 2013.

Fig. 1. Splicing machines are used to repair leaks and breaks in drip tape
Procedures
All fields were planted with romaine or iceberg lettuce varieties on 40-inch or 80-inch wide beds. At each site irrigation, pressure, and fertilizer uniformity were evaluated during a single irrigation event. Field sizes ranged from 8 to 20 acres, and the maximum row lengths ranged from 600 to 1340 ft. Drip tape at all field sites was 7/8 inch diameter, medium flow tape (0.34 gpm/100 ft), but varied by manufacturer and age. The location where fertilizer was injected into the irrigation system, and start and end time of the fertigation, as well as the duration of the irrigation, were recorded. Before irrigating, couplers fitted with ¼ gallon per hour pressure compensating emitters that were spliced in to the drip tape at 24 locations within the field, representing the head, tail and middle areas. Water from these emitters was collected into 5 gallon containers during the entire irrigation (Figure 2) and analyzed for NO3-N and NH4-N. The discharge rate of 4 emitters and pressure of the tape was measured near each of the 24 fertilizer sampling locations (total of 96 emitters). Mass (lbs) of N applied at each of the 24 collection locations within a field was estimated by multiplying the measured discharge rate of the drip tape by the irrigation time and by the concentration of N in the collected water. Uniformity of applied water, tape pressure, and fertilizer was calculated by comparing the lowest 25% of measurements to the average of all 24 measurements. In addition to evaluating fertilizer distribution uniformity, we evaluated the time for fertilizer to travel to the furthest distance from the injection point by injecting food dye for a 5 minute period into the irrigation system and monitoring the water for color at the furthest point from the injection location.

Fig. 2. Low flow (1/4 gph) pressure compensating drip emitters were used to collect samples of irrigation water during the entire irrigation cycle.
Results
Distribution uniformity of applied water for the 11 fields averaged 73% and ranged from 38% to 88% (Table 1). The industry standard for irrigation uniformity of surface drip is 85%. Fertilizer application uniformity averaged 67% and ranged from 46% to 82%. The distribution uniformity of the drip systems of 7 fields evaluated was greater than 74% (avg = 82%) and fertilizer uniformity was greater than 72% (avg = 77%) (Figure 3).
One of the causes for poor distribution uniformity of some drip systems may have been related to pressure. Pressure uniformity averaged 80% and ranged from 43% to 99% (Table 1). Average pressures in the drip tape ranged from 3.5 to 13.8 psi (Table 2). Where the system pressure averaged 4.3 psi, the tape discharge rate was 30% less than the manufacturer's rating. Irrigation distribution uniformity decreased substantially when the average field pressure was less than 5 psi (Figure 4). Additionally, a substantial percentage of emitters of some drip systems were plugged (Table 2) which would reduce irrigation system uniformity. Leaks were evaluated in 5 fields and ranged from 1 to 5 leaks per 1000 ft of tape (Table 2). Significant leaks can potentially reduce drip uniformity by lowering the downstream pressure. Other limitations to good drip uniformity included mixing different types of tape in the same field, fluctuating pressure during the irrigation, and row lengths longer than 800 ft.
Field 8 had a high uniformity of pressure and irrigation distribution but a low fertilizer uniformity. We speculate that the fertilizer which was injected at a “T” connecting the valve in the field with the submain did not have sufficient time to mix with the irrigation water before the flow split into opposite directions. Hence, the average concentration of N on one side of the field was approximately half the concentration measured on the other side of the field. The distribution uniformity of fertilizer on individual sides of the fields was greater than 87%.
With the exception of field 8, fertilizer distribution uniformity was closely related with irrigation system uniformity (Figure 4). Fields with the lowest fertilizer uniformity were operated at the lowest average pressure and/or had the highest level of plugged emitters (Table 2).
Fertilizer was injected at the well in 4 of the fields and at the submain valve in the other 7 fields (Table 3). Injections were made simultaneously using 2 valves at 3 of the fields. Fertilizer was injected during an average of less than 30 minute period often at the beginning of the irrigation (Table 3). The time required for the fertilizer to travel to the furthest point of the irrigation system averaged 42 minutes but ranged from as short as 22 minutes to as long as 1 hour. Field size, row length, and injection location appeared to affect the travel time of the fertilizer. The average time for flushing the fertilizer was 3.75 hours, which was ample time to allow the fertilizer to completely flush from the system. The irrigation industry recommends that for long irrigations (> 4 hours), fertilizer should be applied in the middle of the irrigation cycle. Only at field 10 was the fertilizer applied during the middle of the irrigation. The long flush time after injecting could potential leach nitrate forms of fertilizer below the root zone of the crop. On average, half of the applied fertilizer N measured in the collection buckets was in the nitrate form.
Conclusions
This survey of commercial lettuce fields demonstrated that N fertilizer applied by drip has an average distribution uniformity of 77% when the injection is properly made and the drip system is operated and maintained to achieve an average distribution uniformity of 82%. The results also showed that N fertilizer applied by drip is frequently distributed to fields unevenly due to poor uniformity of the drip systems, or because proper injection procedures were not followed. Operation procedures observed at these sites would suggest that irrigators may need training to better understand the principles of fertigation so that fertilizer is applied at the highest uniformity possible, and in a manner that will prevent leaching losses of nitrate.
Acknowledgements
We thank the California Leafy Green Research Board for funding this project and the many growers that cooperated with the field trials.
Table 1. Summary of irrigation, fertilizer, and pressure uniformity of drip irrigated lettuce fields.

Table 2. Drip tape characteristics at commercial lettuce sites.

Table 3. Irrigation summary for drip irrigated lettuce fields.


Fig. 3. Relationship between distribution uniformity of retrievable drip systems and fertigation uniformity. Each symbol denotes a commercial lettuce field evaluated during the study.

Fig. 4. Effect of tape pressure on the distribution uniformity of retrievable drip systems. Each symbol denotes a commercial lettuce field.

- Author: Richard Smith
The lack of rain in the Salinas Valley brings many concerns. The lack of runoff into lakes San Antonio and Nacimiento of course is a concern for the availability of water to run down the river to recharge the ground water for irrigation purposes. In addition, the lack of rain will affect the levels of salts that remain up in the root zone of the crops. Soil nitrate (NO3-) is one of the anions that will remain in the soil if leaching by winter rains does not occur. Nitrate is highly mobile and can be easily leached with just one or more significant rain storms; figure 1 illustrates nitrate leached from the top foot of soil by a series of storms that delivered 2.0 inches of water over the course of one week in the winter of 2010. High residual soil nitrates may come from several sources: 1) unused fertilizer from the previous crops or fall preplant nitrogen applications; 2) mineralization of crop residues from the previous crop; and 3) mineralization of soil organic matter over the winter (mineralization of soil organic matter is much slower during the winter but will still occur to a minimal degree).
We recently surveyed several soils looking for a site to conduct a fertilizer trial and observed that residual soil nitrate levels were routinely over 20 ppm nitrate-nitrogen. These levels were in contrast with levels that we observed last year following a wet spring where, in general, residual soil nitrate levels were in the 5 – 10 ppm nitrate-nitrogen range. The difference in conditions between a dry winter like this and a wet winter like last year is that it has implications for planning nitrogen fertilizer programs; with soil residual nitrate levels this high, the nitrogen fertilizer needs of the first crop fields will behave like second crop fields in that the robust amounts of residual soil nitrate in the soil that can provide for the crop needs and allow you to reduce nitrogen fertilizer programs.
To illustrate this point, we observed a great difference in the fertilizer needs of first vs second crop spinach during the 2011 growing season. In a first crop spinach planting, residual soil nitrate levels were at 5 ppm at the beginning of the trial. Spinach responded to at-planting applications of nitrogen up to 40 lbs nitrogen/A (Figure 2). The second crop spinach planting had initial levels of residual soil nitrate of 28 ppm nitrate-nitrogen which allowed the grower to skip the at-planting nitrogen application; he made one top-dress nitrogen application two weeks after planting to bring the crop to harvest. The results of a top-dress nitrogen evaluation indicated that there was no improvement in yield beyond 25 lbs nitrogen per acre (Figure 3).
These results indicate the importance of deep percolation of water on residual levels of soil nitrate. Winter rains have the beneficial effect of leaching salts from the soil. It is very unfortunate that nitrate is one of the salts that is leached with the water, but that is the case. In many of the discussions that we have had over the last several years regarding managing nitrogen fertilization more efficiently, we have emphasized that testing for residual soil nitrate is generally most effective for the second crop of the season. However, given the extreme lack of leaching rain events this winter, residual soil nitrate levels are also high at the beginning of the first crop in many areas in the valley and can be taken into consideration when planning nitrogen fertilization.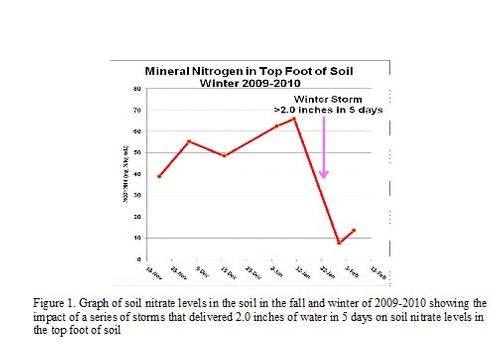

Figure 2. Yield response of first crop spinach under five
application rates of at-planting nitrogen (0 – 80 lbs N/A)

Figure 3. Yield response of second crop spinach under five application rates of top-dressed nitrogen (0 – 105 lbs N/A); no at-planting nitrogen was applied to this planting.
- Author: Richard Smith
- Research Assistant: Aaron Heinrich
Nitrate leaching from vegetable production along the Central Coast is under greater scrutiny and is the subject of proposed regulations by the Regional Water Quality Control Board (RWQCB). The regulations as written have stipulated that leachate from agricultural lands should not exceed the public health limits for nitrate in drinking water of 10 ppm nitrate-nitrogen.
To date there has been little information developed on the quantities of nitrate contained in leachate from lettuce production. In 2009 we conducted a nitrogen fertilizer trial in which we applied 10, 75, 150, 225 and 300 lbs of N/A and water was applied at 116% of evapotranspiration. In order to measure leachate from the plots, suction lysimeters were installed to a depth of 2 feet deep in the soil (photo 1). During each irrigation, suction in the lysimeters was maintained at 20-25 centibars which was assumed to be the leachable fraction of soil water. After each irrigation, leachate was collected and analyzed for nitrate concentration.
The 10 lbs N/A was a low N treatment (and yielded substantially lower than other treatments), but even in this treatment had leachate nitrate-N concentrations substantially greater than the 10 ppm nitrate-N drinking water standard (see graph below) for the majority of the early season. The concentration of nitrate-N in this treatment declined to below the drinking water standard for the final third of the growing season. These data give us a glimpse into nitrate levels of leachate from vegetable production fields. Even treatments with little applied N can have substantial quantities of nitrate in the leachate. This indicates that monitoring of the concentration of nitrate in the leachate may not be a consistently useful tool for understanding the quantity of N leached.


Figure 1: Nitrate-N concentrations in leachate over the growing season of romaine lettuce (for simplicity, we pooled the leachate nitrate levels of the highest three nitrogen fertilizer treatments 150, 225 and 300 lbs N/A, as they were not significantly different from each other)

