- Author: Ian Grettenberger
- Author: Addie Abrams
Two of the worst pests plaguing lettuce growers in the Salinas Valley area are aphids, specifically lettuce-currant aphids (Nasovonia ribisnigri), and western flower thrips (Frankliniella occidentalis). Lettuce-currant aphid is an invasive pest that sets up shop in the heart of the lettuce plant and will render the crop unsellable when it reaches high enough numbers. Thrips can both cause cosmetic damage to lettuce crops and are also responsible for the spread of Salinas impatiens necrotic spot virus (INSV), the fatal lettuce disease that has driven large losses since the 2020 growing season.
While effective tools exist to control both aphids and thrips, they are almost exclusively chemical. Chemical sprays are increasingly under pressure due to changes in the regulatory framework in California as well as the development of pest resistance and discoveries of key chemistries in area watersheds1,2. The UC Davis FiVE lab biological control research program addresses a growing interest in developing alternative tools for managing both pests that do not rely on chemical applications. Biological control provides an opportunity for the management of thrips and aphids that do not rely on chemical tools.
Biological control is defined as the use of natural enemies to control a target pest. Three general categories of biological control could possibly be used as management practices for lettuce pests in the Salinas Valley area:
• Conservation biological control refers to the establishment and maintenance of resources and conditions favorable
• Inundative biological control involves the release of a beneficial insect species in large numbers with the expectation that the beneficials that are released will only provide control for a short amount of time before eventually dying out. Such releases would need to be repeated at regular intervals for the duration of the growing cycle for a crop.
• Augmentative biological control refers to the use of releases of smaller numbers of beneficials to areas where a smaller population of the species already exists, but not in numbers great enough to provide adequate control of the targeted pest species. The goal of augmentative releases is to bolster already-existent populations of beneficial species so they achieve great enough numbers to provide control of the pest or pests of interest.
Conservation biological control in the Salinas Valley
Syrphid flies
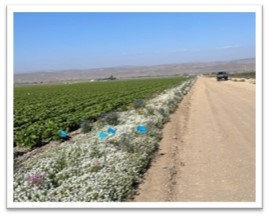
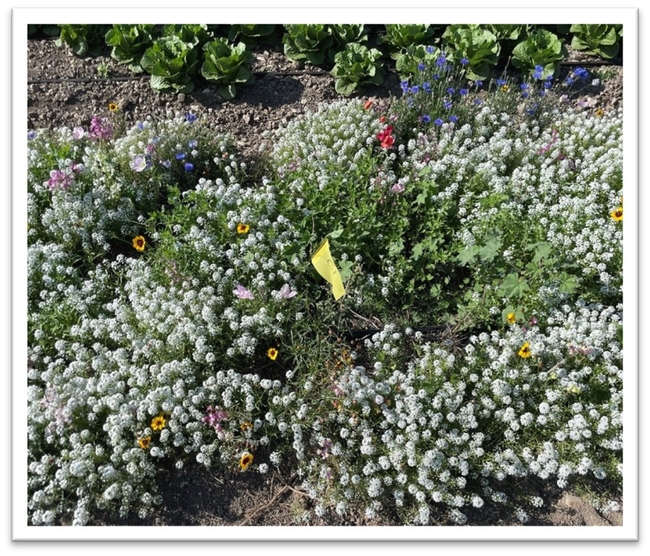
Aphid pests of lettuce have been effectively managed in some lettuce production systems through the planting of sweet alyssum adjacent to and interspersed within crop fields3. Sweet alyssum is a favorite of the Syrphid fly (Diptera: Syrphidae), the primary biological control agent used to control aphid pests in lettuce. Syrphids, also called hoverflies or flower flies, are a family of black and yellow pigmented flies which resemble bees and stinging wasps. The coloration is a protective camouflage; Syrphid flies are harmless to humans. Syrphid adults are frequently seen visiting flowers for their nectar and pollen, which the insect consumes both as an energy source and to support their reproduction.
In exchange the female Syrphid flies will lay eggs in lettuce plants with lettuce aphid infestations, the primary food source for their young. Once the eggs hatch, the syrphid maggots, which are predatory on slow, soft-bodied insects, will feed on the aphids and suppress their population. Syrphid larvae are known to be voracious; some California species have been shown to consume upwards of 100 aphids per day4!
Syrphids are the intended beneficiaries of most conservation biological control in central coast lettuce fields, but other beneficial species take advantage of these resources as well.
Other predatory species love sweet alyssum
Many other biological control agents are supported by insectary plantings5. Ladybird beetles often inhabit lettuce fields and may provide some control of lettuce aphid infestations. Common lacewings (family Chrysopidae) are also found in lettuce fields and insectary plantings. Lacewings, which are only predatory in their immature or larval life stage, can provide biological control services against lettuce aphids and western flower thrips. Minute pirate bug (Orius sp.) and aphid midges (Aphidoletes aphidimyza) have also been observed in and collected from insectary plantings in lettuce fields, but it is not known the extent to which they can suppress populations of lettuce aphid or Western flower thrips.
UC Davis Fi-VE Bug IPM Lab biological control research programs
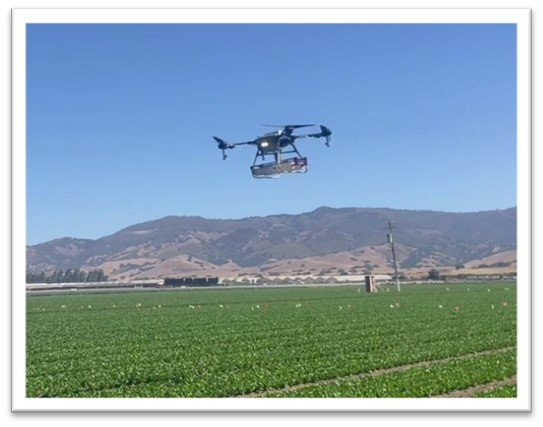
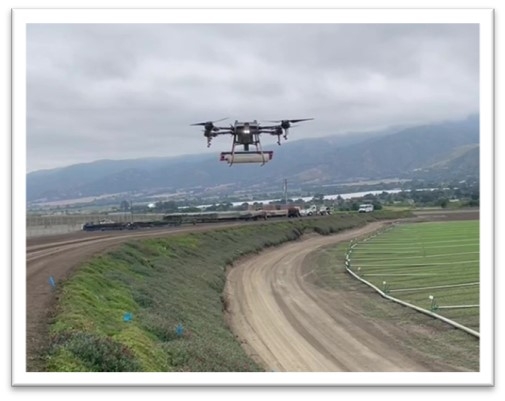
Including insectary plantings to attract naturally occurring predators has historically been the only efficient way to get beneficial species into crop fields. Newly developed technology using drones as a dispersal tool may provide another option for growers interested in using biological control as part of their pest management programs for aphids and thrips. This technology drastically reduces the time and labor required to conduct large releases of laboratory-reared beneficial insects, making the approach more feasible for growers.
As part of a research program funded by the California Department of Pesticide Regulation (CA DPR) and in collaboration with Daniel Hasegawa at USDA-ARS and with Parabug, we are studying the release of biological control agents using drones for the management of aphid and thrips pests of lettuce crops. Our three experimental programs are as follows:

Experiments run by former Monterey County IPM Advisor Alejandro Del Pozo-Valdivia found that a single inundative release of green lacewing eggs (Chrysoperla rufilabris) in lettuce fields reduced aphid pressure six weeks after release6. Our experiment builds on Alejandro's work, examining whether repeated releases of green lacewing eggs throughout the lettuce growing cycle reduce aphid numbers. Additionally, the experiment includes two treatments aimed at suppressing western flower thrips: inundative releases of a species of predatory mite (Amblyseius cucumeris), and a combined release of both predatory mites and green lacewing eggs.
Augmentative releases to bolster non-syrphid predatory species in insectary strips and intercropped alyssum

Other native predators of aphids and thrips are present in the insectary plantings growers use to attract syrphids, but their numbers are too low to provide suppression of thrips and aphids in adjacent crops. These species are reared by commercial insectaries, but using them in an inundative release could prove too costly for growers. Experiments in this program examine the use of smaller releases of these predatory species early in the growing cycle over insectary plantings. The goal is to determine whether the presence of floral resources allows the predators to stick around and build up enough in population to control aphids and thrips in the crop field. Experiments will be conducted with aphid midge (Aphidoletes aphidimyza), an aphid predator, and minute pirate bug (Orius insidiosus), a predator of western flower thrips.
Augmentative releases to manage thrips in non-crop areas
Western flower thrips plague not just vegetable crop fields but also the vegetation surrounding crop areas. In this experiment, we will examine whether releases of cucumeris mites and minute pirate bugs over field edges planted with ice plant will establish these predators in the vegetation and provide long-term suppression of western flower thrips.
Citations
- Deng, X. Study 321: Surface water monitoring for pesticides in agricultural areas in the Central Coast and southern California (2022)
- Gao, Y., Lei, Z. & Reitz, S. R. Western flower thrips resistance to insecticides: detection, mechanisms and management strategies. Pest Manag. Sci. 68, 1111–1121 (2012).
- Brennan, E. B. Agronomic aspects of strip intercropping lettuce with alyssum for biological control of aphids. Biol. Control 65, 302–311 (2013).
- Hopper, J. V., Nelson, E. H., Daane, K. M. & Mills, N. J. Growth, development and consumption by four syrphid species associated with the lettuce aphid, Nasonovia ribisnigri, in California. Biol. Control 58, 271–276 (2011).
- Bugg, R. L., Colfer, R. G., Chaney, W. E., Smith, H. A. & Cannon, J. Flower Flies (Syrphidae) and Other Biological Control Agents for Aphids in Vegetable Crops. (University of California, Agriculture and Natural Resources, 2008). doi:10.3733/ucanr.8285.
- Del Pozo-Valdivia, A. I., Morgan, E. & Bennett, C. In-Field Evaluation of Drone-Released Lacewings for Aphid Control in California Organic Lettuce. J. Econ. Entomol. 114, 1882–1888 (2021).
- Author: Kirsten Ann Pearsons
“In the coastal areas where spotted wilt is a serious problem ... there is much to be learned concerning the seasonal migrations and local host succession of the thrips”
At first, this looks like a quote from 2020 or 2022 made in reference to the recent outbreaks of Impaciens necrotic spot virus (INSV), a thrips-transmitted disease currently affecting lettuce. But the quote is actually pulled from a UC publication titled Thrips of economic importance in California, authored by Professor Stanley Bailey in 1938.
The lettuce industry here in the Salinas Valley has been hit hard by INSV the past few years, and understanding the biology of the thrips that vectors the virus could be critical for management. But as Bailey noted almost 100 years ago, fully understanding the biology of western flower thrips has been elusive for decades.
In Thrips of economic importance in California, Bailey also noted that thrips in coastal areas tend to spend their summers at higher altitudes, but as native hosts dry up, they can concentrate on nearby crops. I wondered if such a migration could help explain the increase in thrips and INSV pressure the past few falls. With advances in thrips collection methods (i.e., sticky cards) and changes in cropping patterns, I was curious -- could we could observe the migration that Bailey described nearly 100 years ago?

Methods: With help from John Massa (Comgro) and a team from Braga Fresh (Eric Morgan, Katie Chiapuzio, and Jaylen Calabro), I set up a loose transect of 10 sticky card traps at about 4' off the ground (Figure 1). The transect spanned 0.38 miles (610 m) and an elevation change of 325 ft (99 m).
The first traps were deployed on June 5th and the last traps were collected on October 25th. We swapped out cards every two weeks for a total of 10 sets of cards. Some cows used two of the lower traps as scratching posts, so we were limited to 8 traps for most of the trial.
Sticky cards were taken back to the lab to count any thrips that fit the general description of Western flower thrips, Frankliniella occidentalis: less than 2 mm long, overall yellow to brown body color. Some larger, black thrips were occasionally found on traps and were excluded from overall counts.
Hypothesis: Thrips migrate down from the hills in late summer and early fall, increasing the thrips pressure in the valley which could increase the risk of spreading INSV.
Expected Results: If thrips counts are high in the hills in summer, but drop as populations rise in the valley, then this would be good support for Bailey's note and my hypothesis (Figure 2A). Alternatively, if thrips populations in the hills are consistent across time (Figure 2B), or if their population fluctuations match what is going on in the valley (Figure 2C), then it is unlikely that a mass migration is occurring.
Results: The transect results are summarized in figure 3. In panel A, the average thrips per week is plotted over time, with cards grouped by location (top of the hill, middle of the hill, or towards the bottom). The bottom traps were mostly surrounded by dried grass, while the top and middle traps were generally near chaparral plants that stayed green and flowering throughout the summer and into the fall. You can see an increase in thrips captures from June into July, followed by a dip in early august, and two more peaks in mid-August and early October (following that three-day heatwave). Compared to the valley counts (red line), the number of thrips captured on the hill was much higher, an average of 13 times higher than in the Valley. Adjusting the scale of the Valley-level trap counts (Figure 3B), we can see the Valley traps somewhat followed a similar pattern - thrips populations peaked in early June, had a few weeks of low counts in early August, then peaked again in mid-August and early October. With some variation, adult thrips captures in the hills followed a similar pattern to those captured nearby in the Valley.
Preliminary Conclusions: Contrary to my hypothesis, this small study does not provide evidence that thrips migrate en masse from the hills into the Salinas Valley. The hills maintained some green vegetation and flowers throughout the year, so thrips may not be driven to the Valley like Bailey described. Instead, the hills supported high thrips population throughout the summer and into the fall, which may have acted more like a continuous source of thrips into the valley. This could have interesting effects on INSV epidemiology, depending on whether the host plants in the hills can acquire INSV.
We of course cannot rely on a single transect in one year to conclude that thrips never migrate en mass into the Valley. This year we had an atypical, cool, wet spring that may have changed if or how thrips migrate. Perhaps migration only occurs in years with a drier, warmer spring. We also cannot discount the fact that the thrips we counted may not all be Western flower thrips; the identification characteristics we used (less than 2 mm long, overall yellow to brown body color) are not diagnostic of Western flower thrips. The next steps in this study would be to set up additional transects next year and live collection of thrips off of vegetation. By setting up additional transects (and getting them set up earlier in the season), we could determine if this preliminary transect was an anomaly, or if thrips are not behaving the way that Bailey described in 1938. Live collection of thrips is necessary to determine what proportion of thrips in the hills are Western flower thrips that can vector INSV. Either way, we are one step closer to understanding the seasonal migrations and local host succession of thrips, which could help us in our fight against INSV.
Much thanks to John Massa, Eric Morgan, Katie Chiapuzio, Jaylen Calabro, Jasmine Rodriguez, Luis Ramirez-Espinoza, and Carlos Rodriguez Lopez!
- Author: Kirsten Ann Pearsons
We are getting to the time of year where lettuce production winds down in the Salinas Valley and ramps up in the desert around Yuma, Arizona. Unlike in the Salinas Valley, the desert has not been hit as hard by Impaciens necrotic spot virus (INSV), the virus that is transmitted to lettuce by Western flower thrips (F. occidentalis). When the virus does show up in the desert, the primary infection can often be traced back to INSV-infected thrips that arrived on vegetable transplants from coastal California (Palumbo, 2022)
These finding stirred up concern in the local ag community – could vegetable transplants also be a significant source of new INSV infections in the Salinas Valley? There are instances where recently transplanted fields start showing INSV symptoms soon after planting (Figure 1), but it is challenging to nail down if they were infected before or after transplanting. After gaining some advice from John Palumbo of the University of Arizona (who has been spearheading the ISNV work in the desert), I set out to sample thrips from local transplant nurseries.
Hypothesis: Vegetable transplants are NOT a major source of INSV-infected thrips in the Salinas Valley. Although this hypothesis may seem contrary to the findings from Yuma, it all comes down to timing of transplant production and background levels of thrips and INSV. As summarized in Figure 2, weekly thrips activity is low in spring and early summer but high in late summer and early spring. [check out an interactive version of these data: Salinas Valley Lettuce Pest Mapping Tool]. This difference in activity somewhat corresponds to when transplants are grown for local use (spring and early summer) versus desert use (late summer and fall). Transplants that are sent to Yuma are grown when thrips populations and INSV pressure has been historically high – putting them at higher risk of carrying INSV+ thrips.

Species confirmation and virus testing: I collaborated with Daniel Hasegawa (USDA-ARS) for species confirmation and virus testing. Daniel and his team used a genetic testing method called multiplex RT-qPCR to determine if the adult and larval thrips were 1) Western flower thrips (F. occidentalis), 2) Onion thrips (Thrips tabaci), or 3) some other thrips species AND if the thrips were carrying 1) INSV or 2) Tomato spotted wilt virus (TSWV, similar to INSV). For small samples (five or fewer thrips), Daniel's team tested each thrips individually. For samples with more than five thrips, they tested half of the thrips as a pooled sample. If this sub-sample tested positive for INSV, a subset of the remaining thrips were tested individually.
Results: From March through May, we only collected 52 thrips, 50 of which were identified as western flower thrips and none which tested positive for INSV or TSWV. In June, collection shot up almost 10-fold and doubled again in July, somewhat tracking the thrips population increase in the valley (Figure 4). In June and July, thrips densities were consistently higher on brassica transplants compared to lettuce transplants (Figure 5).
Despite collecting over 2,000 individual thrips (1,333 adults and 782 larvae), only two samples, or 1.64% of the tested thrips, tested positive for INSV. The two samples which has positive hits for INSV were collected in June, one off or organic broccoli and one off of conventional cauliflower. None of the thrips collected off of lettuce transplants tested positive for INSV.
Preliminary Conclusions: For the Salinas Valley, the thrips populations on transplants appear to mirror the thrips population in the valley. This is perhaps not too surprising since most transplants are grown on uncovered benches near crop fields. Despite lettuce being a better host for Western flowerthrips (Joseph & Koike, 2021), we consistently collected morethrips frombrassica transplants. We attribute this difference to management practices (e.g., insecticide applications on lettuce transplants) and because brassica transplants tend to stay at nurseries for an additional week.
With this in mind, we may expect that transplanted lettuce fields in the Salinas Valley are more likely to be infected by INSV+ thrips coming in from nearby areas (the prior crop, nearby fields, or weedy areas) rather than thrips from transplant nurseries. Although I would expect to find more INSV+ thrips on vegetable transplants in a year with higher INSV incidence (2023 incidence was considerably lower than prior years), the risk of INSV+ thrips coming in from other sources would increase as well.
For the desert, however, the background risk of INSV is much lower because INSV levels drop off over the summer. In this context, even a handful of INSV+ thrips on transplants pose a proportionally greater risk than in the Salinas Valley. Recognizing this risk to growing regions beyond the Salinas Valley, it is important to continue monitoring INSV levels in transplant nurseries and to work with nurseries to minimize the risk of transporting INSV+ thrips.
References:
- Palumbo, JC, 2022. Thrips and INSV Management in Desert Lettuce. University of Arizona VegIPM Update, Vol 13, No 22, Nov 2, 2022. https://acis.cals.arizona.edu/docs/default-source/agricultural-ipm-documents/vegetable-ipm-updates/2022/thrips-and-insv-management-in-desert-lettuce.pdf?sfvrsn=3088b8b9_2
- Joseph, SV, Koike, ST, 2021. Could Broccoli and Cauliflower Influence the Dispersal Dynamics of Western Flower Thrips (Thysanoptera: Thripidae) to Lettuce in the Salinas Valley of California? Environmental Entomology 50, 995–1005. https://doi.org/10.1093/ee/nvab050
Thanks to Daniel Hasegawa and the entire Hasegawa lab (USDA-ARS, Salinas); John Palumbo (University of Arizona); Kevin Costa, Thomas Costa, and Manuel Aguirre (Headstart Nursery); Francisco Castaneda and Omar Saenz (Growers Transplanting); Lupe Guillen, Maria Alfaro, Alejandro Palma-Carias, and Jim Wilkinson (Dole Fresh Vegetables); Jasmine Rodriguez; Luis Ramirez-Espinoza (CSU-MB); and the California Leafy Greens Research Board.
- Author: Kirsten Ann Pearsons
- Author: Yu-Chen Wang
The 2023 Salinas Fall Pest Management Meeting will be held on the afternoon of Tuesday December 5th, 2023
(postponed from the original date of Nov 2)
Pre-registration is encouraged but not required:
https://surveys.ucanr.edu/survey.cfm?surveynumber=41558
Se recomienda inscripción de antemano:
https://surveys.ucanr.edu/survey.cfm?surveynumber=41560
Traducción simultánea al Español
Authors: Ben Lee, Daniel Hasegawa, Ian Grettenberger
We would like to announce the creation of a new web-based tool that will provide more seamless access to pest population data from a pest trapping network. Pests included are thrips, diamondback moth, and aphids.
We wanted to provide growers with a tool to view the most up-to-date lettuce pest population data available and have developed an app to track pest populations over time throughout the Salinas Valley. Our app can be used to quickly view current thrips, diamondback moth, and aphid abundances, where pest populations are increasing the fastest, and how previous years' pest populations responded to changes in temperature. We hope to add more features in the future and are looking forward to feedback from the community for ways to improve our app or what data presentations would be useful in making management decisions.
The trapping efforts were started by former IPM advisor Alejandro Del Pozo-Valdivia and are now operated by Daniel Hasegawa with USDA-Salinas . Pests are trapped on a weekly basis using sticky traps (diamondback moth: pheromone trap, thrips and aphids: yellow sticky card). Ben Lee created this app as a member of the Grettenberger lab at UC Davis.
Click on the links (below) to open the app in your browser or on your phone, and be sure to bookmark for the most up-to-date pest data. These links can also be found on the Entomology section of the UCCE Monterey website Salinas Valley pest monitoring - Monterey County (ucanr.edu)
Desktop version: https://salinaspestmap.shinyapps.io/salinas-pestmap/
Mobile version: https://salinaspestmap.shinyapps.io/salinas-pestmap-mobile/


