- Author: Michael D Cahn
Access to weather data from the California Irrigation Management and Information System (CIMIS) has become easier than ever due to improvements in the website (www.cimis.water.ca.gov). CIMIS is managed by the CA Department of Water Resources.
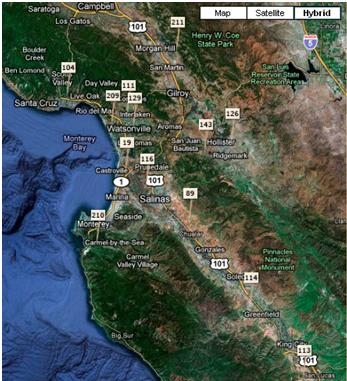
CIMIS is a network of more than 120 weather stations that operate through out the agricultural regions of California. Currently, 13 stations are located on the central coast (Figure 1). All stations record relative humidity, air temperature, wind speed and direction, and solar radiation, and are located above a standard crop of grass or alfalfa, which are referred to as reference crops. Using these weather data and a mathematical model (Penman-Monteith) , potential crop water use, also called evapotranspiration (ETo), of the reference crop can be estimated. A crop coefficient is used to adjust the reference evapotranspiration data to evapotranspiration estimates for other crops, such lettuce, strawberry, or celery. CIMIS weather stations also monitor precipitation and soil temperature, and the stations calculate dew point, net radiation, and vapor pressure from the collected data.
The CIMIS staff has made many improvements in managing the weather data over the years. They use computer algorithms to check for outlying values which are flagged in reports. They have incorporated google maps to help you locate CIMIS stations near your fields (Figure 1), and they have incorporated Satellite weather data to help improve the spatial resolution of CIMIS evapotranspiration estimates.
Perhaps most importantly, the CIMIS staff has simplified getting access to the data. You can have the data emailed to you at a specified interval and also you can specify the format of the data (excel, web report, etc):
- Go to the CIMIS website and sign up for a user ID and password on the My CIMIS tab. (There is no cost for signing up and CIMIS does not send you annoying email solicitations).
- After logging on at the My CIMIS tab, select the station(s) from which you would like to receive weather data. Add the stations to a list.
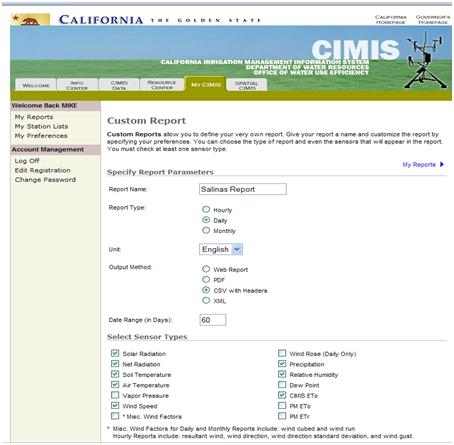
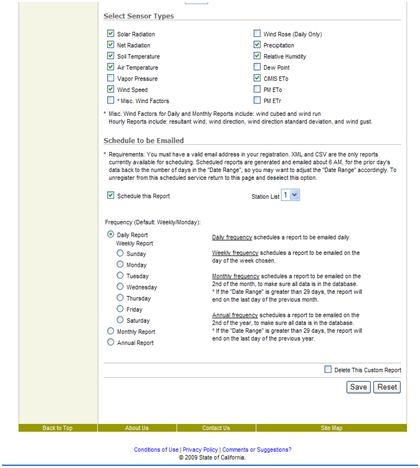
- Under My Custom Report select “customize” to create a report. Choose the file format, station list, weather parameters, and time period (1 week, 2 week etc) that the report should cover (Figure 2). You can check the box to schedule the report to be automatically emailed to you (Figure 3). Note that the CSV format can be imported into Excel. The web report can be viewed directly from your web browser.

Figure 1. Location of currently operating CIMIS weather stations on the central coast as viewed from station location map under the Spatial CIMIS tab. Station numbers are displayed in the white rectangles.

Figure 2. User can select weather data and file format on the Custom report screen of My CIMIS tab.

Figure 3. User can select to have report emailed on the Custom report screen of My CIMIS tab.


