- Author: Luis Espino
I've been receiving reports of high armyworm populations this summer. You can always find some armyworms in rice fields, but I have rarely seen fields that needed a treatment due to armyworm injury.
Defoliation caused by armyworms is not uncommon. However, rice plants have abundant foliage and can take quite a bit of defoliation.
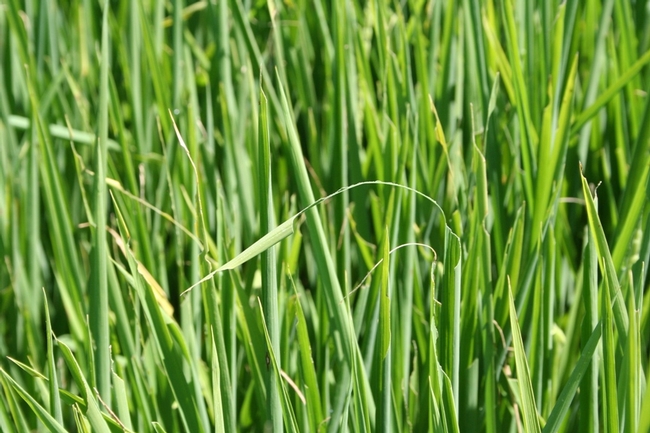
UC guidelines recommend a treatment only if more than 25% of the foliage has been consumed and you still see armyworms in the field.
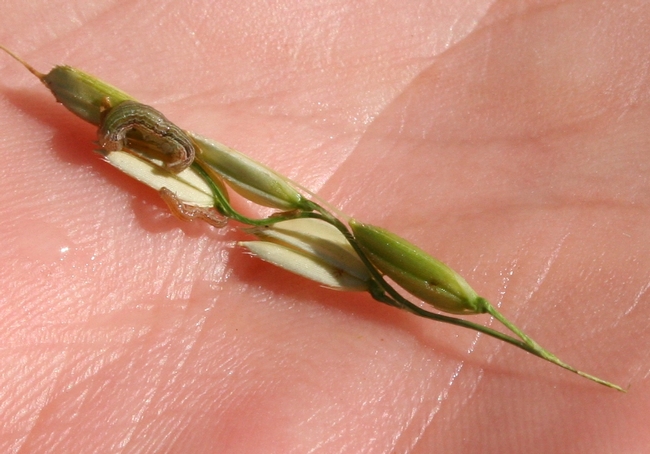
It can be challenging to find armyworms in a rice field. They usually feed at night. During the heat of the day, they hide at the base of the plants where it's cooler. To monitor for armyworms, open the canopy and look down near the water level. Spend a minute or two looking; small armyworms can be hard to see.
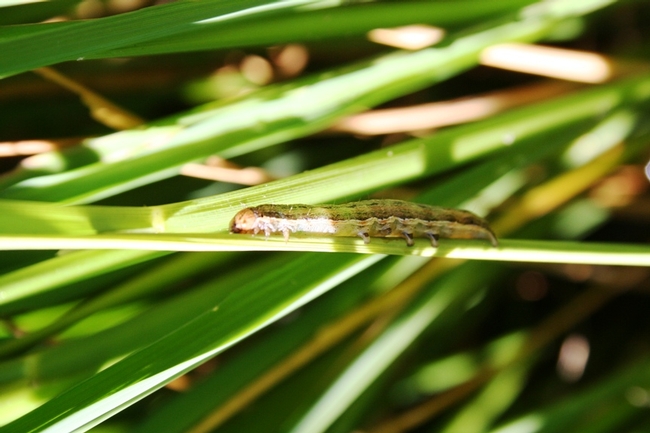
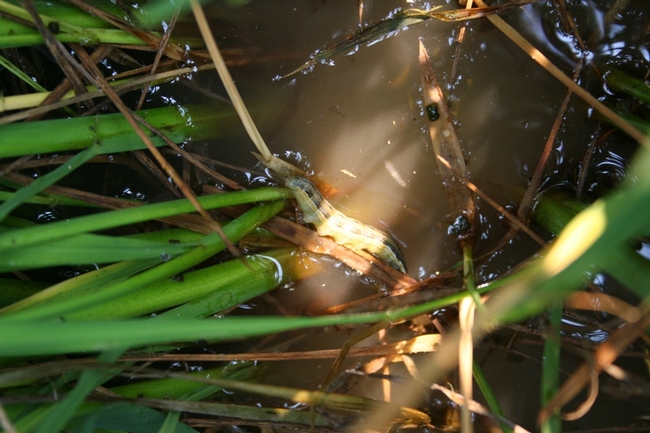
Alternatively, you can shake the plants and observe for worms falling into the water. This is especially effective for large larvae.
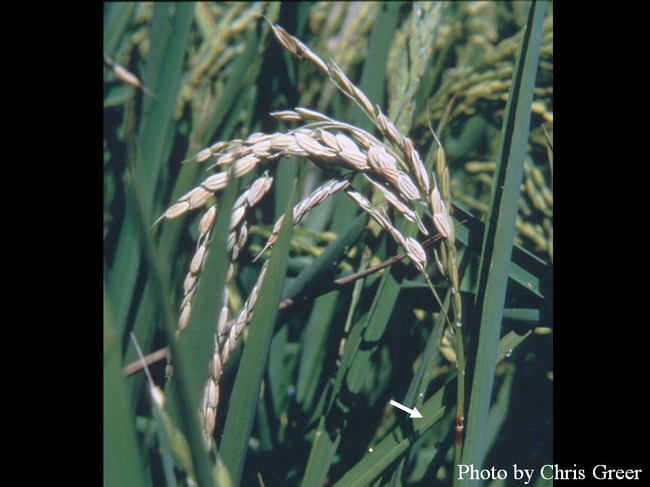
Panicle damage can be severe. Armyworms can feed on developing panicles causing whole panicles or panicle branches to become blank.
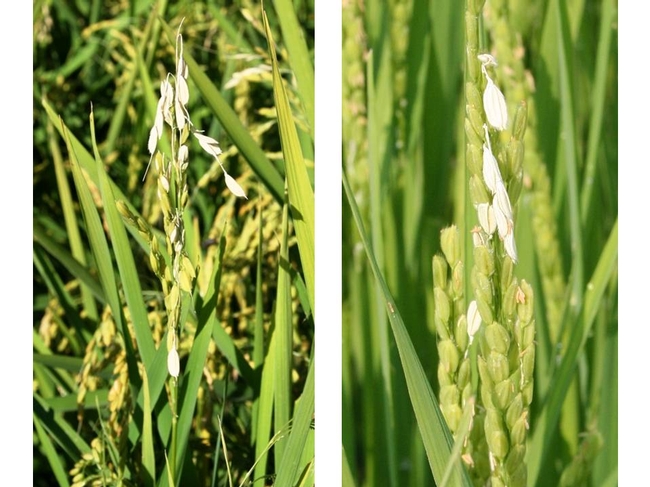
Observe closely where the panicle branch breaks or becomes blank and you will see chewing marks.
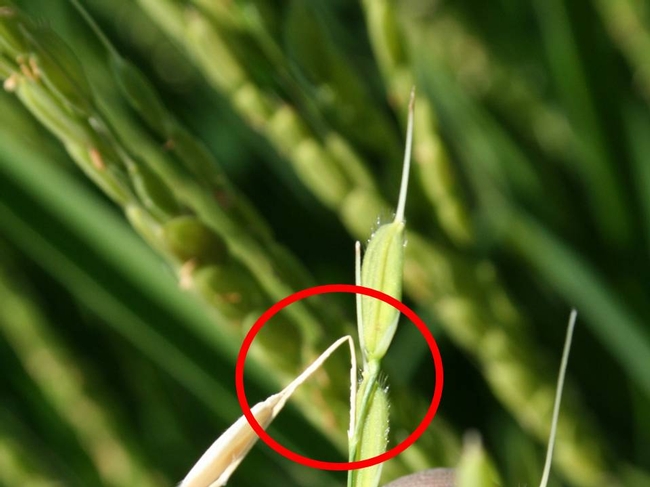
UC guidelines recommend a treatment if more than 10% of the panicles are affected and you still see worms in the field. If you can't find them during the day and are still in doubt, come out during the evening and see if you see any worms in the panicles.
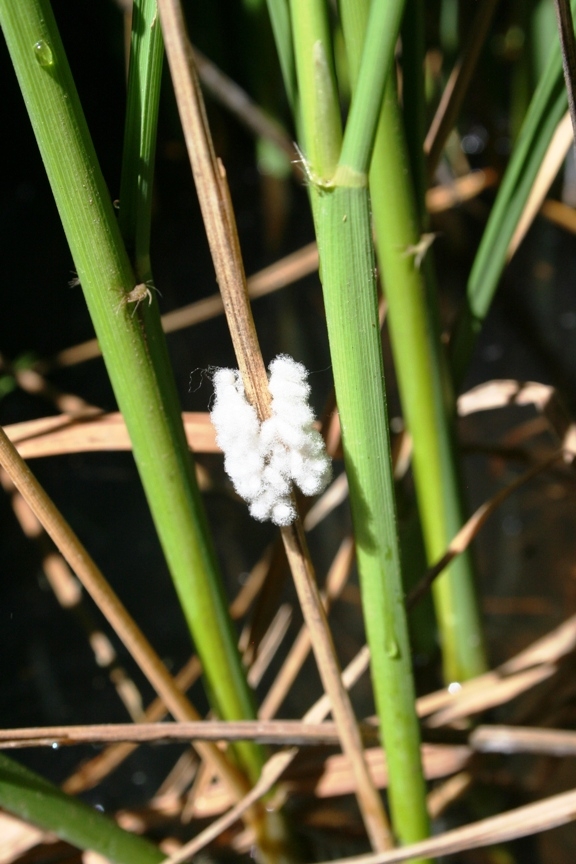
Those fuzzy white cocoons you find at the base of the plants are pupal cases of the parasitic wasp Apanteles militaris. The wasp lays its eggs inside the armyworm, wasp larvae develop and when they are ready to pupate they leave the armyworm and form the white cocoons. This, of course, kills the armyworm.
It's important to remember that armyworms pupate in the soil. In a rice field, when they are ready to pupate, they usually drop to the water and drown. Some may pupate in the foliage at the base of the plants, but there they are easy prey for their natural enemies. If you see injury but the worms are gone, there is no need to worry about the next generation of armyworms.
- Author: Luis Espino
Released August 8, 2011, by the National Agricultural Statistics Service (NASS), Agricultural Statistics Board, United States Department of Agriculture (USDA).
- Posted By: Luis Espino
- Written by: Cass Mutters
Lower limit 55 F, upper limit 100 F
May 1 to August 1
Nicolaus
2009 1513
2010 1335
2011 1278
Durham
2009 1469
2010 1350
2011 1236
Colusa
2009 1600
2010 1413
2011 1344
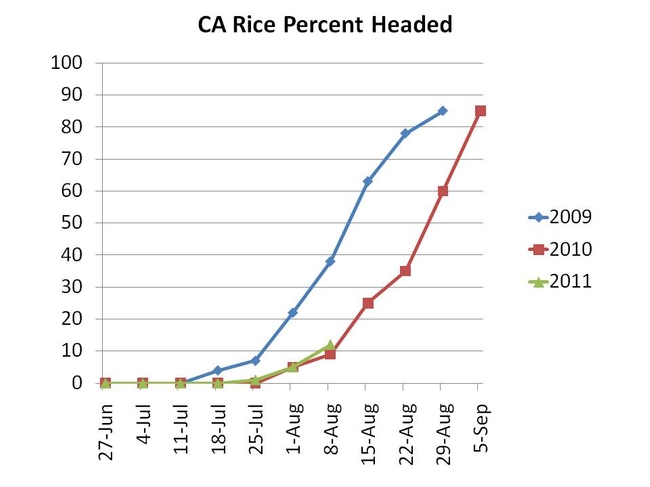
To date 2011 is about 4-6 days behind 2010 and about 10-12 days behind 2009, depending the average number of degree units accumulated in one day used for the calculation.
Interestingly, the south valley is not cooler than the north valley using this measure. Any difference seems to be east to west.
- Author: Luis Espino
Last year we had a bad blast year - several fields that had never experienced blast got the disease and some reported yield losses. This year growers and PCAs are paying more attention to try to prevent the disease from causing damage.
Leaf blast symptoms of the disease begin as small grayish, whitish or bluish spots that enlarge to form diamond shaped lesions.
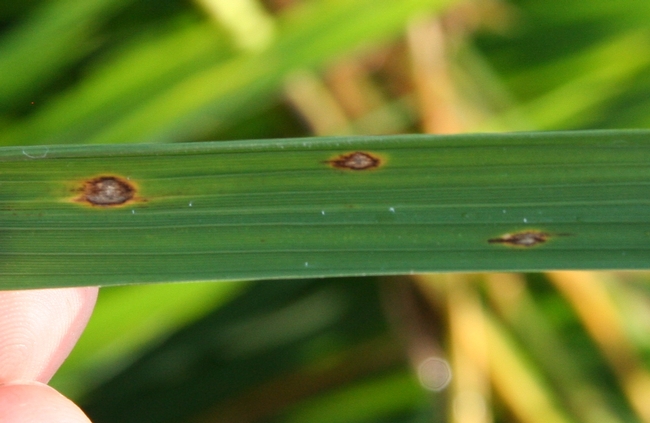
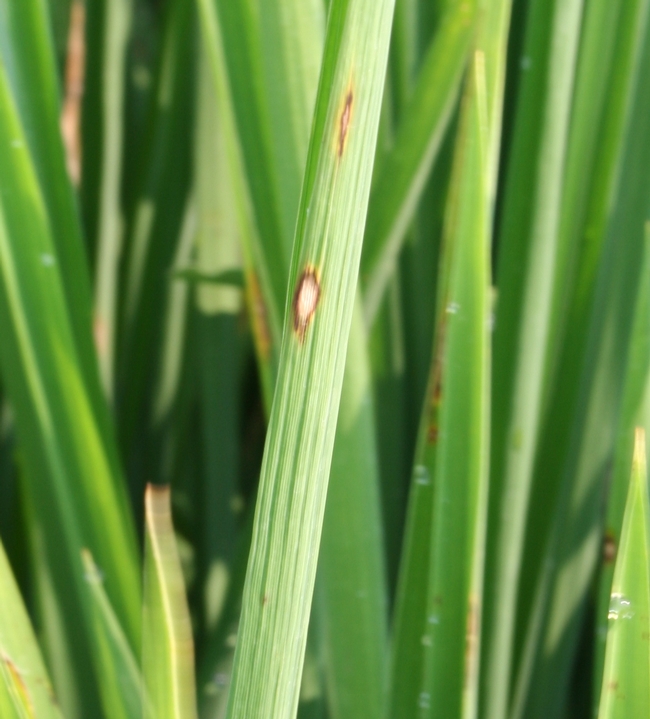
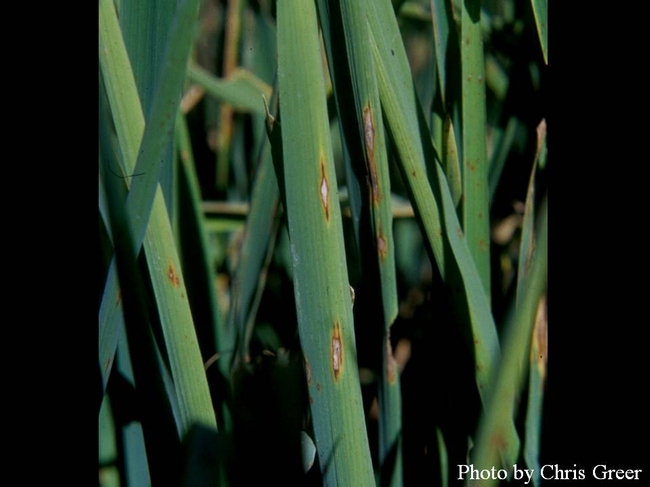
Lesions can coalesce and cover most of the leaf blades, causing "holes" of dead plants. This holes are usually observed at the edge of the field, in areas where nitrogen was overapplied because of overlap during aqua application. Excess nitrogen make plants more susceptible to infection.
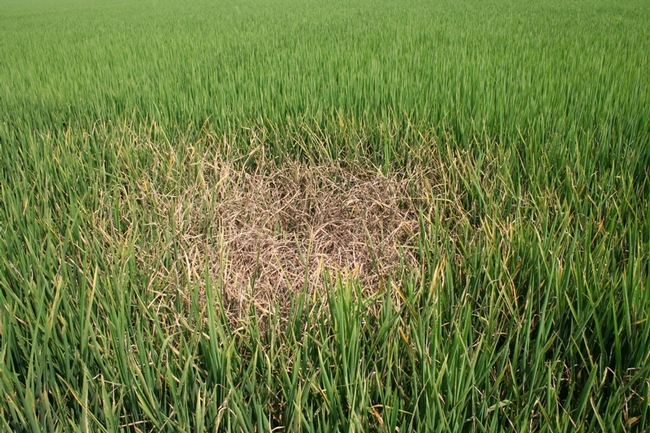
Neck and panicle blast are of economic importance. Infection of the panicles directly reduce yield by causing empty heads that produce little or no grain.
Environmental conditions that favor the disease are extended periods of free moisture on the surface of the plant, night time temperatures between 63-73 F, no wind and high relative humidity.
When treating for blast, time your applications so that the young panicles are protected as they emerge from the boot. The fungicide azoxystrobin inhibits spore germination, and therefore is more effective when applied as a protectant. When using a fungicide, follow label directions and rates.
- Author: Luis Espino
Released June 30, 2011, by the National Agricultural Statistics Service (NASS), Agricultural Statistics Board, United States Department of Agriculture (USDA).
Rice: Area planted to rice in 2011 is estimated at 2.68 million acres, down 26 percent from 2010 and the lowest planted acreage since 1987. Area for harvest is forecasted at 2.65 million acres, down 27 percent from last year.
In all States except California, severe drought conditions, excessive flooding, and higher prices for competing commodities contributed to the decline in rice acres compared to last year. Area planted to rice in Arkansas, the largest rice-producing State, is at the lowest level since 1989. In California, water was in good supply, which allowed growers to plant 3 percent more rice than in 2010.
As of June 19, ninety-seven percent of the rice crop had emerged, on par with the previous year and the 5-year average. Growers in Louisiana and Texas were dealing with salt water intrusion due to the dry conditions. By month's end, 61 percent of the crop was rated in good to excellent condition, compared with 74 percent the same time last year.
Rice Area Planted and Harvested by Class - States and United States:
2010 and 2011
--------------------------------------------------------------------------------
Class and State: Area planted : Area harvested
:---------------------------------------------------------------
: 2010 : 2011 : 2010 : 2011 1/
--------------------------------------------------------------------------------
: 1,000 acres
:
Long grain :
Arkansas .......: 1,595 970 1,590 960
California .....: 6 5 6 5
Louisiana ......: 500 390 495 385
Mississippi ....: 305 185 303 184
Missouri .......: 250 140 248 136
Texas ..........: 185 175 184 173
:
United States ..: 2,841 1,865 2,826 1,843
:
Medium grain :
Arkansas .......: 195 200 194 199
California .....: 510 530 505 527
Louisiana ......: 40 30 40 30
Missouri .......: 3 5 3 4
Texas ..........: 4 5 4 5
:
United States ..: 752 770 746 765
:
Short grain 2/ :
Arkansas .......: 1 1 1 1
California .....: 42 40 42 40
:
United States ..: 43 41 43 41
:
All :
Arkansas .......: 1,791 1,171 1,785 1,160
California .....: 558 575 553 572
Louisiana ......: 540 420 535 415
Mississippi ....: 305 185 303 184
Missouri .......: 253 145 251 140
Texas ..........: 189 180 188 178
:
United States ..: 3,636 2,676 3,615 2,649
--------------------------------------------------------------------------------
1/ Forecasted.
2/ Includes sweet rice.


