
- Author: Surendra K. Dara

Biostimulants are beneficial microorganisms or substances that can be used in crop production to improve plants' immune responses and their ability to perform well under biotic and abiotic stresses. Biostimulants induce plant resistance to stress factors through systemic acquired resistance or induced systemic resistance. When plants are exposed to virulent and avirulent pathogens, non-pathogenic microorganisms, and some chemicals, the systemic acquired resistance mechanism is activated through the salicylic acid pathway triggering the production of pathogenesis-related proteins. On the other hand, when plants are exposed to beneficial microbes, the induced systemic resistance mechanism is activated through the jasmonic acid and ethylene pathways. The jasmonic acid pathway also leads to pathogenesis-related protein production in plants. In other words, when plants are exposed to pathogens, non-pathogens, or other compounds, various defense genes are activated through two major immune responses, helping plants fight the real infection or prepare them for potential infection. Beneficial microbes and non-microbial biostimulants are like vaccines that prepare plants for potential health problems.

Earlier studies in tomato (Dara and Lewis, 2018; Dara, 2019a) and strawberry (Dara and Peck, 2018; Dara, 2019b) demonstrated varying levels of benefits to crop health and yield improvements from a variety of botanical, microbial, or mineral biostimulants and other supplements. Some of the evaluated products resulted in significant yield improvement in both tomatoes and strawberries compared to the grower standard practices. There are several biostimulant products in the market with a variety of active ingredients, and some also have major plant nutrients such as nitrogen, phosphorus, and potassium. Depending on the crop, growing conditions, potential risk of pests and diseases, and other factors, growers can use one or more of these products. A study was conducted to evaluate the impact of various biostimulants on the yield, quality, and shelf life of strawberries.
Methodology
Strawberry cultivar San Andreas was planted late November 2018 and treatments were administered at the time of planting or soon after, depending on the protocol. Each treatment had a 290' long strawberry bed where 10' of the bed at each end was left out as a buffer. Then, six 30' long plots, each representing a replication, were marked within each bed with an 18' buffer between the plots. Since the test products needed to be applied through the drip system, an entire bed was allocated for each treatment, except for the standard program that had one bed on either side of the experimental block, and plots were marked within each bed for data collection. The following treatment regimens were used in the study:
1. Standard Program (SP): Major nutrients were provided in the form of Urea Ammonium Nitrate Solution 32-0-0, Ammonium Polyphosphate Solution, and Potassium Thiosulfate (KTS 0-0-25). Nitrogen, phosphorus, and potassium were applied before planting in November 2018 at 170, 60, and 130 lb/acre, respectively. From 15 January to 9 May 2019, a total of 26 lb of nitrogen, 13 lb of phosphorus, and 26 lb of potassium were applied through 13 periodic applications.
2. SP + Terramera Program: Formulation labeled as Experimental A (cold-pressed neem 70%) was applied at 1.2% vol/vol immediately after planting. Additional applications were made starting from 2 weeks after planting once every two weeks until the end of February (six times), followed by 13 weekly applications from the beginning of March.
3. SP + Locus Low Rate Program: This program contained Rhizolizer soil amendment (Trichoderma harzianum 1X10⁸ CFU/ml and Bacillus amyloliquefaciens 1X10⁹ CFU/ml) at 3 fl oz/acre, humic acid at 13.5 fl oz/acre, and kelp at 6.8 fl oz/acre. The first application was made within 15 days and at 30 days after planting followed by once in February, March, and April 2019.
4. SP + Locus High Rate Program: This program contained Rhizolizer soil amendment (Trichoderma harzianum 1X10⁸ CFU/ml and Bacillus amyloliquefaciens 1X10⁹ CFU/ml) at 6 fl oz/acre, humic acid at 13.5 fl oz/acre, and kelp at 6.8 fl oz/acre. The first application was made within 15 days and at 30 days after planting followed by once in February, March, and April 2019.
5. SP + BioGro Program: Transplants were treated with Premium Plant BB (Beauveria bassiana 1.1%) by spraying 2 fl oz/acre (1.29 ml in 850 ml of water). About 7 weeks after planting, 30 gpa of Plant-X Rhizo-Pro (botanical extracts), 2 gpa of CHB Premium 21 (humic acid blend), 3 gpa of CHB Premium 6 (3% humic acids), and 5 gpa of NUE Flourish 4-12-0 were applied. Starting from mid-February 2019, 15 gpa of Plant-X Rhizo-Pro, 1 gpa of CHB Premium 21, and 2 gpa of CHB Premium 6 were applied four times every 2 weeks until the end of March. Starting from 5 April 2019, 8 weekly applications of 10 gpa of Plant-X Rhizo-Pro, 1 gpa of CHB Premium 21, 2 gpa of Premium 6, and 4 gpa of NUE Flourish 4-12-0 were made until 26 May 2019.
6. SP + Actagro Program: Structure 7-21-0 at 3 gpa and Liquid Humus 0-0-4 with 22% organic acids at 1 gpa were first applied within 1 week of planting and then three more times every 2 weeks until the end of December 2018. Additional monthly applications were made from the end of January to the end of April 2019.
All the fertilizers and treatment materials were applied through the drip system using the Dosatron (Model D14MZ2) equipment. The following parameters were measured during the experimental period from January to May 2019.
Canopy: The size of the plant canopy was determined on 21 January and again on 17 February 2019 by measuring the spread of the canopy across and along the length of the bed from 16 random plants within each plot, and calculating the area.
Initial flowering and fruiting: When flowering initiated, the number of flowers and developing fruits was counted from 16 random plants within each plot on 1 and 16 February 2019.
Fruit yield: Fruit was harvested weekly from every plant within each plot from 3 March to 26 May 2019 on 11 dates and the number and weight of the marketable and unmarketable fruit was determined. Due to a technical error, some of the yield data from an additional date (29 March) were lost and excluded from the analysis.
Fruit firmness: The firmness of two marketable fruit from each of five random plants per plot was measured using a penetrometer on 5 April, and 16 and 26 May 2019.
Fruit sugar content: The sugar content from one marketable fruit from each of 10 plants per plot was measured using a refractometer on 5 April and 26 May 2019.
Leaf chlorophyll content: On 11 March and 31 May 2019, the chlorophyll content of one mature leaf from each of five random plants per plot was measured using a chlorophyll meter.
Postharvest disease: Marketable fruit harvested on 21 and 28 April, and 5 and 26 May 2019 was kept at the room temperature in perforated plastic containers (clamshells) and the growth of gray mold (Botrytis cinerea) or Rhizopus fruit rot fungus (Rhizopus spp.) was measured on a scale of 0 to 4 (where 0=no fungus, 1=1-25%, 2=26-50%, 3=51-75%, and 4=76-100% fungal growth) 3 and 5 days after each harvest.
Data were analyzed using analysis of variance in Statistix software and significant means were separated using the Least Significant Difference means separation test.

Hamza Khairi taking flower and fruit counts (upper) and canopy measurements (lower).
Results and Discussion
Statistically significant differences among treatments were seen for the seasonal total number of unmarketable berries (P = 0.0172), the initial flower and fruit numbers on 1 February (P < 0.0014), the leaf chlorophyll content on 31 May (P = 0.0144), and the disease rating 3 days after the 28 April harvest (P = 0.0065).
Treatments did not differ (P > 0.05) in any other measured parameters of the plant, fruit quality, or yield. However, the total seasonal fruit yield was 13 to 31% higher and the total marketable fruit yield was 10 to 36% higher in various treatment programs compared to the standard program. The seasonal total of unmarketable fruit yield was also 4 to 25% higher in treatment programs than the standard program except that there were nearly 12% fewer unmarketable berries in the Actagro program compared to the standard program.


While treatments did not statistically differ for many of the measured parameters, numerical differences in marketable fruit yield could be helpful for some understanding of the potential of these biostimulants. Additional studies with larger treatment plots would be useful for generating additional data.
Acknowledgments
Thanks to Dr. Jenita Thinakaran for the assistance at the start of the study, Hamza Khairi for his technical assistance throughout the study, the field staff at the Shafter Research Station for the crop maintenance, NorCal Nursery for the strawberry transplants, and Actagro, BioGro, Locus, and Terramera for their collaboration and financial support
References
Dara, S. K. 2019a. Improving tomato yield with nutrient materials containing microbial and botanical biostimulants. eJournal of Entomology and Biologicals, 6 June 2019 https://ucanr.edu/blogs/blogcore/postdetail.cfm?postnum=30448
Dara, S. K. 2019b. Evaluating the efficacy of anti-stress supplements on strawberry yield and quality. eJournal of Entomology and Biologicals, 10 August 2019 https://ucanr.edu/blogs/blogcore/postdetail.cfm?postnum=31044
Dara, S. K. and D. Peck. 2018. Microbial and bioactive soil amendments for improving strawberry crop growth, health, and fruit yields: a 2017-2018 study eJournal of Entomology and Biologicals, 3 August 2018 https://ucanr.edu/blogs/blogcore/postdetail.cfm?postnum=27891
Dara, S. K. and E. Lewis. 2018. Impact of nutrient and biostimulant materials on tomato crop health and yield. eJournal of Entomology and Biologicals, 9 January 2019 https://ucanr.edu/blogs/blogcore/postdetail.cfm?postnum=26054


- Author: Surendra K. Dara
- Author: Dave Peck, Manzanita Berry Farms

Experimental plots in mid January, 2018. Photo by Surendra Dara
In a continuous effort to explore the potential of additive, soil amendment, biostimulant, and other products, a new study was conducted in a conventional strawberry field at the Manzanita Berry Farms in Santa Maria. The following treatments were administered at different times, from planting till the end of production season, as requested by the manufacturer.
- Untreated control: Other than the soil incorporated fertilizers during the field preparation, no other nutrient inputs were added during the study.
- Grower standard: Transplants were dipped in Switch 62.5WG (cyprodinil+fludioxonil, at 5 oz/100 gal) before planting and a proprietary nutrient regimen that included administration of a humic acid-based product was followed.
- Innovak Global regimen: Nutrisorb-L (a blend of polyhydroxy carboxylic acids) at 28 fl oz/ac, starting 2 wk after planting and every 3 wk thereafter through drip. Packhard (carboxylic acids with calcium and boron) at 28 fl oz/ac, starting at the first fruit set (early January) and every 2 wk thereafter as a foliar spray.
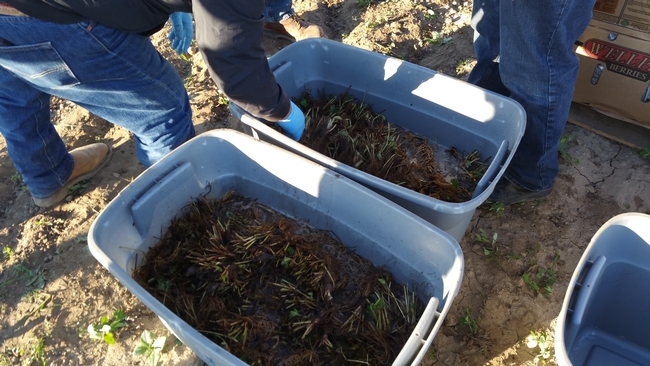
- TerraVesco regimen: A microbe-rich Vermi-extract (worm extract) at 10% vol/vol as a transplant dip for 3 hours, followed by application through drip at 7.5 gal/ac after planting, and again in December, 2017 and January, 2018.
- Fertum regimen: Transplant dip in 1% vol/vol of Germinal Plus (a product from marine algae), followed by drip applications of Booster (a biostimulant and a natural organic fertilizer made from seaweed) at 0.5 gal/ac in late November and late December, 201; Silicium PK (a biostimulant and a natural organic fertilizer based on silicon enriched with phosphorus, potassium and seaweed extracts) at 0.5 gal/ac late December, 2017 and once a month starting from mid February to early July, 2018; and Foliar (a biostimulant and a natural organic fertilizer from marine algae) at 0.5 gal/ac in mid and late January.
- Shemin Garden regimen: EcoSil (a silica fertilizer) at 800 ml/ac once a month starting from early December, 2017 to May, 2018 through drip, and at 200 ml/ac in early May and June, 2018 as a foliar spray; ComCat (based on a plant extract) at 20 gr/ac and EcoFlora (a consortium of Azotobacter spp., Bacillus spp., Paenibacillus spp., Pseudomonas sp., Trichoderma spp., and Streptomyces spp.) at 12 oz/ac one week after EcoSil through drip until May, 2018 and ComCat at 10 gr/ac and EcoFlora at 12 oz/ac as a foliar spray in May and June, 2018.
- GrowCentia regimen-low: Yeti containing 1% bacterial culture (of Pseudomonas putida, Citrobacter freundii, Comamonas testosterone, and Enterobacter cloacae) and 2% alfalfa extract applied at 0.6 ml/gal through drip for 90 min weekly from the first drip application.
- GrowCentia regimen-high: Yeti at 1 ml/gal through drip for 90 min weekly from the first drip application.
- NanoChem regimen: EX10, a biodegradable fertilizer additive containing thermal polyaspartate at 1 qrt/ac through first drip after planting with follow up applications in early January (first bloom), mid February, and mid May, 2018. The active ingredient binds with cations such as ammonium, calcium, copper, iron, magnesium, manganese, potassium, and zinc and improves their availability for the plant.
- BiOWiSH regimen 1: Formula 1 at 1.33 oz/gal for transplant dip followed by 3.53 oz/ac through drip starting 2 wk after planting and every 4-5 wk thereafter.
- BiOWiSH regimen 2: Formula 1 at 1.33 oz/gal for transplant dip followed by 3.53 oz/ac as a foliar srpay starting 2 wk after planting and every 4-5 wk thereafter.
- BiOWiSH regimen 3: Formula 1 at 1.33 oz/gal for transplant dip followed by 3.53 oz/ac through drip starting 2 wk after planting alternated with a foliar spray every 4-5 wk.
- BiOWiSH regimen 4: Formula 1 at 1.33 oz/gal for transplant dip followed by BiOWiSH Crop 16-40-0, a microbial consortium (Bacillus amyloliquefaciens, B. lichenoformis, B. pumilus, and B. subtilis)at 3.53 oz/ac through drip starting 2 wk after planting and every 4-5 wk thereafter.
Each treatment contained a 165' long 5.7' wide bed and replicated four times in a randomized complete block design. A 15' long plot in the center of the bed was marked and netted for collecting yield and some other parameters that were compared. Strawberry cultivar BG 6-30214 was planted on 7 November, 2017. Other than the untreated control, all other products were administered on top of the grower standard fertility program. However, only the grower standard transplants were dipped in Switch 62.5WG before planting.
Various parameters were measured during the vegetative growth and fruit production periods to evaluate the impact of the treatments on crop growth, health, and yield. Data were analyzed using ANOVA and LSD test was used to separate significant means.
Transplant treatment (above) and drip application (below). Photos by Tamas Zold
")

Tamas Zold taking canopy measurements. Photo by Surendra Dara
Canopy growth: Canopy growth was observed on 11 December, 2017, 7 and 30 January, and 8 February, 2018 by measuring the size of the canopy along and across the length of the bed from 20 random plants per bed and calculating the area. Canopy size significantly (P = 0.0261) different among the treatments only on the last observation date where plants treated with EX10 and the GrowCentia product at the low concentration were larger than those in the grower standard.

Electrical conductivity and temperature of soil: From two random location on each bed, electrical conductivity (EC in dS/m) and temperature (oC) were measured about 3 inches deep from the surface on 12 and 25 January, 7 February, 19 March, 18 April, and 29 May, 2018. Only soil temperature on 25 January significantly (P = 0.0007) varied among treatments where the difference between the highest (untreated control) and the lowest (Vermi-extract) values was 0.8oC.

Dead plants: The number of dead plants represents empty spots in the bed due to the death of transplants. There were no obvious signs of disease or a particular stress factor associated with those plants except that they were randomly distributed within each bed and throughout the field. When counted on 18 April, 2018, BiOWiSH regimen 4, Fertum regimen, GrowCentia product at the high rate, and Innovak Global regimen had

Areas where transplants did not establish. Photo by Surendra Dara

Fruit diseases: Fruit harvested on 12 March, 3 and 13 April, and 17 May, 2018 from each marked plot was incubated at room temperature in dark in plastic containers and the fungal growth was rated 3 and 5 days after harvest (DAH) using a scale of 0 to 4 where 0=no fungal growth, 1=1-25%, 2=26-50%, 3=51-75%, and 4=76-100% fungal growth. Botrytis fruit rot or grey mold was predominant during the first two observation dates and the growth of other fungi (possibly Rhizopus spp.) was also seen during the last two dates. In general, fruit disease occurred at low levels throughout the observation period with

Sugar content in fruit: Sugar content was measured from two harvest-ready berries per bed on 17 May, 2018 using a handheld refractometer. Sugar content varied from 8.06 oBx (Innovak Global regimen) to 9.53 oBx (grower standard).

Fruit firmness: Fruit firmness was measured from eight randomly collected harvest-ready berries from each bed on 28 June, 2018. Firmness varied from 0.82 kgf (Fertum and Shemin Garden regimens) to 0.98 kgf (untreated control).

Fruit yield:Strawberries were harvested from 6 February to 22 June, 2018 on 36 dates. When compared to the grower standard, the marketable berry yield was 16.2, 15.1, 13.7, and 13% higher in Fertum regimen, EX10 treatment, Innovak Global regimen, and BiOWiSH regimen 4, respectively. The marketable berry yield was 9.8, 9, 7.5, and 6.8% higher in those respective treatments over the yield from untreated control.


It took 23 harvest dates in three months (from February to April, 2018) to obtain the first third of the total seasonal yield while the remaining two-thirds were obtained from seven harvest dates in May and six dates in June. Marketable fruit yield was higher than the grower standard in all treatments and higher than the untreated control in most treatments.

In general, fruit yields were higher and the pest and disease pressure was lower than usual during the study period. Aleo, a garlic oil based fungicide, at lower label rates was periodically used for disease management and bug vacuums were operated a few times against the western tarnished plant bug as a standard across all treatments.
This study evaluated some treatment regimens as recommended by the collaborating manufacturers and some of them appear to have a potential for use in strawberry production. These results help the manufacturers fine tune their recommendations for achieving better yields through additional studies.
Acknowledgments: We thank the planting and harvest crew at Manzanita Berry Farms for their help with the crop production aspects, Chris Martinez, Tamas Zold, and Maria Murrietta for their technical assistance, Sumanth Dara for statistical analysis, and the support of the industry collaborators who funded the study.


- Author: Surendra K. Dara
- Author: Dave Peck, Manzanita Berry Farms
Various soilborne, fruit and foliar diseases can affect strawberry crop and fruit yields. Chemical fumigants and a variety of fungicides are typically used for managing the disease issues. In addition to the environmental and human health concerns with chemical control options there is a need to improve current disease management with alternatives that include beneficial microbes. Previous studies showed some promise with some of the treatments, but additional studies are required to evaluate the efficacy, which is more evident especially when there is disease incidence.
A study was conducted in summer-planted conventional strawberries in 2016 at Manzanita Berry Farms to evaluate the impact of various beneficial microbial treatments on plant growth, health, and fruit yield. Untreated control and the grower standard practice (Healthy Soil treatment) were compared with MycoApply EndoMaxx (Glomus intraradices, G. aggregatum, G. mosseae, and G. etunicatum), Actinovate AG (Streptomyces lydicus WYEC 108), and Inocucor Garden Solution (Saccharomyces cerevisiae and Bacillus subtilis) applied in the following treatments:
1. Untreated control
2. Grower Standard-Healthy Soil; transplant dip in Switch 62.5WG 5 oz in 100 gal
3. MycoApply EndoMaxx 2 gpa transplant dip (TD)
4. MycoApply EndoMaxx 2 gpa drip at planting (DrP)
5. MycoApply EndoMaxx 2 gpa transplant dip + 2 gpa drip at planting
6. MycoApply EndoMaxx 4 gpa transplant dip
7. MycoApply EndoMaxx 4 gpa drip at planting
8. MycoApply EndoMaxx 4 gpa transplant dip + 4 gpa drip at planting
9. Actinovate AG 6 oz/ac transplant dip + 6 oz drip at planting + 6 oz drip monthly (DrM)
10. Inocucor Garden Solution 1 gpa drip at planting + 1 gpa drip monthly
Transplanting was done on 21 May, 2016 with appropriate treatments administered at the time of planting and thereafter. Study had two blocks of 10 strawberry beds (300' long) and treatments were randomly applied to a bed within each block. Two 15' long plots were marked within each bed for sampling. Canopy growth was measured on June 21, July 5 and 20; powdery mildew severity on August 3, September 1, October 10 and November 16; botrytis severity 3 and 5 days after harvest (DAH) for berries harvested on September 13 and 27, and October 11 and 18; and dead and dying plants were counted on September 16 and October 23. Yield data were collected from August 20 to November 18. Powdery mildew and botrytis fruit rot severity was measured on a scale of 0 to 4 where 0=No disease, 1=1-25%, 2=26-50%, 3=51-75%, and 4=76-100% severity. Data were analyzed and means were separated using LSD test.

Strawberry field and plots on June 9 (above) and August 31 (below).
")
")
Two sampling plots were set up within each bed to collect plant growth, health, and yield data.
Canopy growth: MycoApply EndoMaxxat 2 gpa either as a transplant dip with or without drip application at planting appeared to promote significantly higher growth (P <0.0001) than MycoApply EndoMaxx at 2 and 4 gpa as drip at planting, untreated control, and grower standard. Inoculating the entire transplant with Glomus spp. through a dip appears to be better than application through drip irrigation system.
Powdery mildew: Disease incidence and severity was low during the observation period. When the average of four observations period was compared, the grower standard, MycoApply Endomaxx at 2 and 4 gpa as drip at planting, and the Actinovate treatments had the lowest incidence (P = 0.0271).
Botrytis fruit rot: There was no difference (P >0.05) among the treatments on botrytis when the mold growth on fruit was compared 3 and 5 days after harvest.
Unknown issue: Some wilting and dead plants were found throughout the field during the study. Although symptoms suggested some kind of wilt, laboratory testing did not identify any pathogens. The total number of dead and dying plants was the lowest in Actinovate treatment, but it was significantly different (P = 0.0429) only from the grower standard Healthy Soil treatment.

*Means followed by the same or no letter are not significantly different at the P value indicated in the table.
Fruit yield: There were no statistically significant difference among the treatments and the seasonal total of marketable yield varied between 66 lb/plot in the grower standard and about 76 lb/plot in MycoApply EndoMaxx applied as a transplant dip at 4 gpa.

Total and marketable berry yields and their proportion among different treatments.
We need to continue to evaluate beneficial microbial products and their potential benefit in improve crop health and yields.
Acknowledgements: Thanks to Chris Martinez and Tamas Zold for technical assistance, and Valent USA and Inocucor Technologies for the financial support of the study.

- Author: Surendra K. Dara
Synthetic or chemical or inorganic fertilizers are commonly used in many conventional crop production systems providing essential nutrients necessary for optimal plant growth and yields. While these fertilizers provide plants with readily available nutrients, excessive application could lead to leaching into the ground water or increase the attractiveness of plants to pests and diseases. Organic fertilizers, on the other hand, are generally made from plant or animal sources. Compared to synthetic fertilizers where nutrients are readily available, nutrients are slowly released from organic fertilizers and thus have a lower risk of nutrient leaching. Organic fertilizers add organic matter to the soil, which improves soil structure, water holding capacity, and root growth. Organic matter also supports beneficial microbial communities in the soil that improve nutrient availability to the plant and protect plants from plant pathogens and other stress factors.
Organic fertilizers, especially those made from food waste, have a significant environmental benefit by recycling valuable nutrient and energy resources that would have, otherwise, been wasted (Senesi, 1989). Several studies emphasized the importance of soil organic matter and its positive impact on soil fertility, crop productivity, and environmental sustainability (Tisdall and Oades, 1982; Baldock and Nelson, 2000; Johnston et al., 2009). However, a balanced used of both synthetic and organic fertilizers is a good strategy both to meet plant needs and environmental sustainability (Chen, 2006).
In the United States, food waste at consumer and retail levels was estimated to be about 30% of the food supply, which is equal to 133 billion pounds valued at $161 billion (USDA-ERS, 2016). Food waste is the largest part what goes into landfills and is the third largest source of methane in the United States. Converting food waste into a fertilizer will have a major impact on agriculture and environment.
To evaluate the efficacy of a recycled food waste-based liquid compost on strawberry yield, a study was conducted during the spring of 2013 on a conventional strawberry field at DB Specialty Farms, Santa Maria.
Materials and Methods
Harvest-to-Harvest (H2H), made by hydrolysis of freshly expired produce, meat, and other food items collected from grocery stores, was evaluated alone and in combination with the grower standard. The formulation of H2H used in the study had NPK at 1-1-0, 5-7% of amino acids, 6-8% of lipids, 8-10% carbohydrates, and 20-25% organic matter according to the label. Treatments included i) Grower standard or GS (proprietary fertilizer regimen), ii) H2H at 73 gallons/acre, and iii) H2H:GS at 50:50. H2H was administered through the drip irrigation system 28 March, 9 and 18 April. Each treatment had a block of about 1.6 acre that were adjacent to each other. On six randomly selected beds within each block, a 40-plant section was marked as a sampling plot. Yield data were collected from these plots from 4 April to 20 May on 10 sampling dates following grower's harvest schedule.
Data were analyzed using analysis of variance and significant means were separated using Tukey's HSD test.

AndresTapia administering treatments through a special pump built by JoeCoelho (above) and observation plots (below).
")
Results and Discussion
Compared to the yield in GS plots, marketable strawberry yield was significantly higher (P < 0.05) for H2H treatment on four of the harvest dates and for GS:H2H combination on two of the harvest dates (Table 1). The average marketable berry yield was significantly higher (P = 0.0003) in both H2H and GS:H2H treatments compared to the GS treatment (Fig. 1). There was no difference (P = 0.283) in the weight of unmarketable berries and their proportion of the total yield was 18.7, 15.5, and 16.2 for GS, H2H, and GS:H2H, respectively.

Table 1. Marketable berry yield on different harvest dates. Means followed by the same letter within the same column are not statistically different based on Tukey's HSD test.

Fig. 1. Average marketable and unmarketable yield during the observation period.
This first commercial field study using H2H shows promising results in improving strawberry yield with recycled food waste. Manufacturer made changes to the H2H formulation and recommendation rates after the study was conducted. Additional studies in different fields with different application rates from the beginning of the production season are essential to make valid conclusions. Soil conditions and nutrient management practices vary among various fields and additional studies will add value to the results obtained in this preliminary study.
Acknowledgements: Thanks to Daren Gee for the collaboration, California Safe Soils for financial support, and Joe Coelho and Andres Tapia for their technical assistance.

http://ucanr.edu/articlefeedback
References
Baldock, J. A. and P. N. Nelson. 2000. Soil organic matter. In: Sumner, M. E. (Ed.) Handbook of Soil Science. CRC Press, Boca Raton, FL, USA, pp. B25-B84.
Chen, J.-H. 2006. The combined use of chemical and organic fertilizers and/or biofertilizer for crop growth and soil fertility. International workshop on sustained management of the soil-rhizosphere system for efficient crop production and fertilizer use. Vol. 16. p. 20. Land Development Department Bangkok, Thailand.
Johnston, A. E., P. R. Poulton, and K. Coleman. 2009. Soil organic matter: its importance in agriculture and carbon dioxide fluxes. Adv. Agronomy 101: 1-57.
Senesi, N. 1989. Composted materials as organic fertilizers. Science of the Total Environment 81: 521-542.
Tisdall, J. M. and J. M. Oades. 1982. Organic matter and water-stable aggregates in soils. European J. Soil Sci. 33: 141-163.
United States Department of Agriculture Economic Research Service (USDA-ERS). 2016. US Food Waste Challenge FAQ's. Accessed on 9 December, 2016 from http://www.usda.gov/oce/foodwaste/faqs.htm
