
- Author: Mark Bolda
The following is an addition to the post from August 2 concerning a case of yellowing strawberry plants in a field in Castroville. To summarize, we concluded that the plants are turning yellow because they are being poisoned by excess amounts of sodium and chloride accumulating in the bed.
So of course, and indeed the question was asked right away, what can we do about this problem? The three points below are a start:
1. The dramatic accumulation of sodium and chloride at the surface of the bed in this study indicate that these are not being adequately leached, which was verified by our observation of soil saturation at depths below the bed. If this is correct, by increasing drainage we will be able to ameliorate the situation and restore a normal leaching pattern. Short of installing a system of subsurface drainage, there has been some anecdotal evidence of success in using a certain “Yeoman’s plough” which is essentially a shank going some 16 inches deep into the soil next to the bed opening a deep cut in the soil improving aeration and water infiltration. This has not been tested in replicated trials however, so I can’t make a firm recommendation of this method at this time.
2. We have every indication in this study that substantial amounts of calcium are precipitating out as lime, and is therefore not replacing exchangeable sodium. We could reduce the amount of precipitation of calcium (increasing the exchangeable calcium) by acidifying the irrigation water which would go some lengths to mitigate the sodium hazard (SAR).
3. Finally, there are other useful steps which can be taken to reduce the amount of sodium and chloride being introduced into the field. For example, a grower experiencing a situation of high sodium and chloride should avoid using sodium nitrate or potassium chloride fertilizers.

- Author: Mark Bolda
UC Cooperative Extension and the California Strawberry Commission have a major entomology meeting planned for this upcoming September 18. Topics covered will be lygus bugs, predatory mites, brown marmorated stinkbug, strategies regarding managing invasive pest invasions and a full suite of talks covering numerous facets of the spotted wing drosophila. Speakers are coming from academia, grower supported institutions and private industry and are among the most informed people on entomological topics on the Central Coast. This meeting is not to be missed by anybody with an interest in insects and their management in strawberries and caneberries.
Agenda can be viewed through the link below:
http://ucanr.org/2012 berry entomology
- Author: Mark Bolda
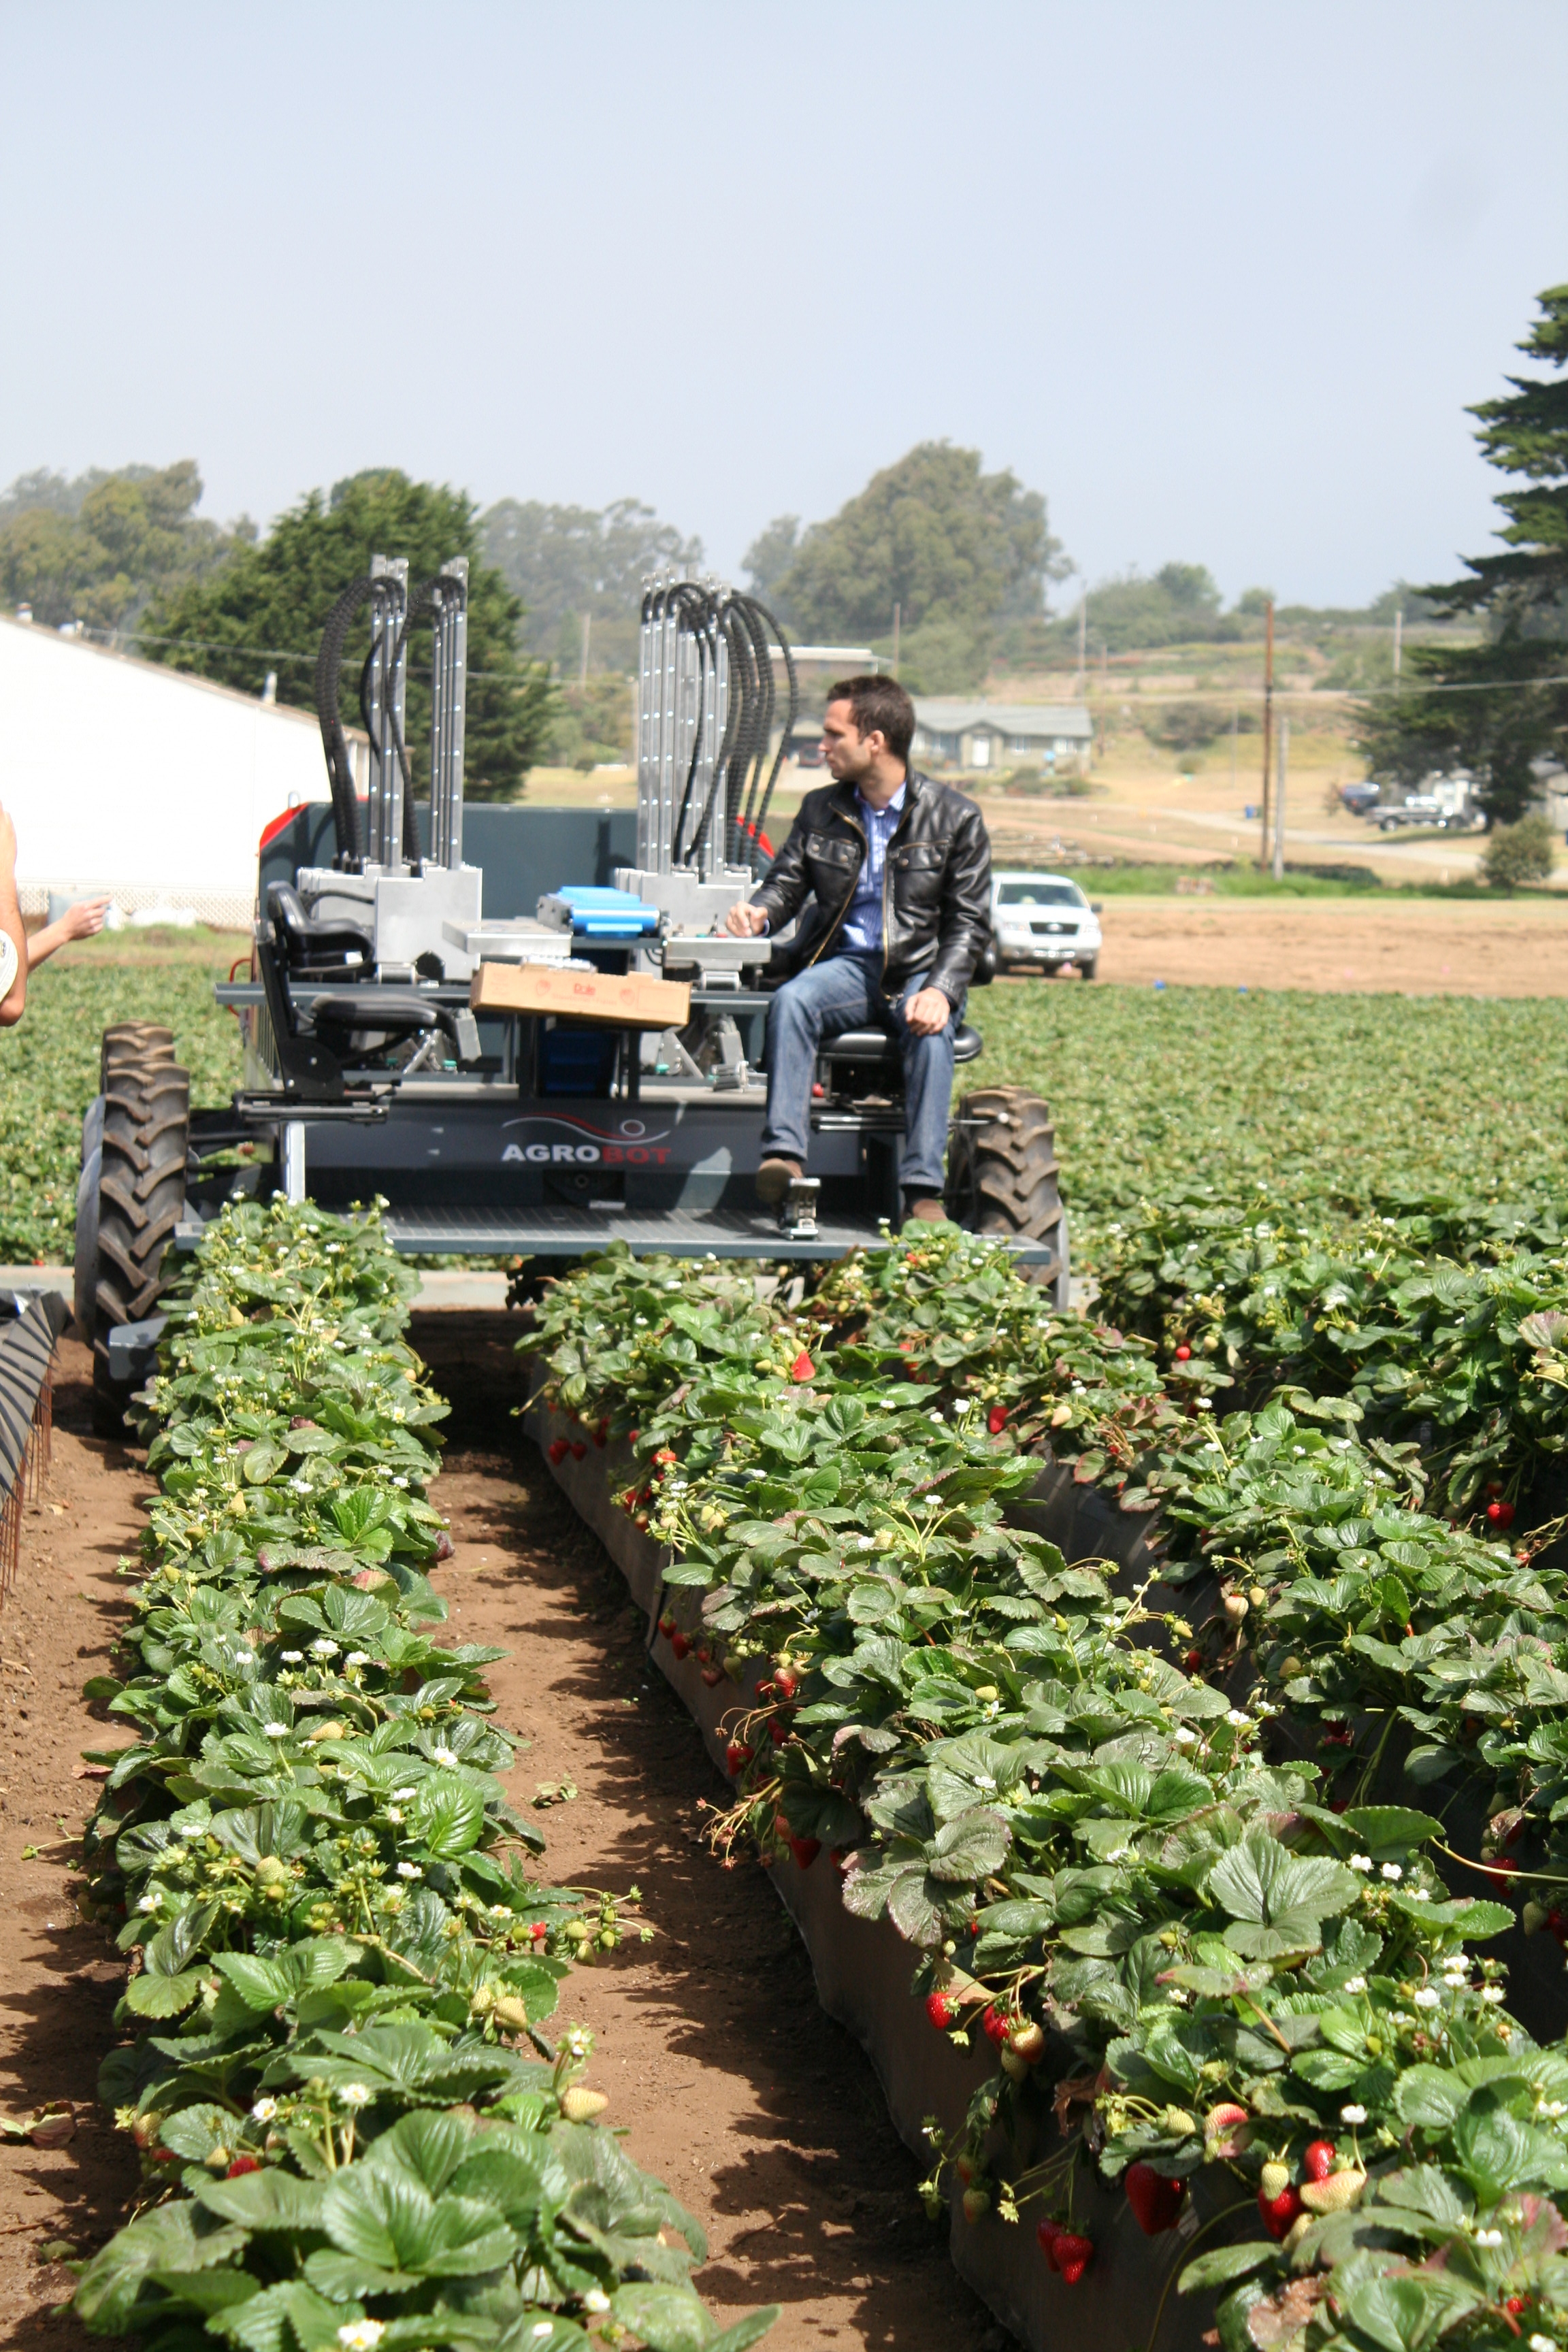
For those who missed yesterday's field meeting, the following is a short summary of the presentation of a robotic harvesting machine for strawberries.
The machine, called "Agrobot", is the creation of a research group in Spain headed by Engineer Juan Bravo, who is seen driving the machine in several pictures below.
Rather than futilely attempt to match the profound and unique complexity of the human hand, the principle of the "Agrobot" is instead a construction of visualization technology which guides a rubber lined basket to the red, ripened strawberry fruit and removes it in a lifting motion from the pedicel with a small round razor buttoned to one side of the basket (photo 2 below). The picked fruit is then deposited on a conveyer belt, which carries it up to a worker seated at the front of the "Agrobot" for quality inspection and placement in a container, be it a clamshell, crate or bucket.
There are a series of arms holding the harvest baskets on either side of the machine to enable picking on both sides of the bed. Much has been of the fact that these arms, having a modular design, are replaceable in case of damage or malfunction. The unit containing the arm and its automated guide snaps easily out to make room for an identical unit, causing minimal delay in the progress of harvest.
Nice video by Luis Macario posted on youtube:
http://www.youtube.com/watch?v=nm3WS5y3kCk&feature=youtu.be
While the "Agrobot" automated harvester is being seen as technology's response to the strawberry industry's increasing problems obtaining harvest labor, many challenges remain nevertheless. For one, the varieties currently in use on the Central Coast produce many fruit in one cluster, which the machine has difficulty distinguishing from one another. Secondly, as the reader can see from picture number three below, the strawberry field must be radically reshaped to accommodate the machine, including farming strawberries in single rows (reducing plant count and subsequently lowering yield per acre) and raising the beds substantially. Third, the machine cannot think for itself and will not find fruit behind foliage or sequestered within the canopy of the plant.
At any rate, the "Agrobot" is a remarkable invention and worthy of a look and consideration by those who haven't seen it yet.


- Author: Mark Bolda
A workshop on anaerobic soil disinfestation (ASD) will take place at the Watsonville UC Cooperative Extension office on August 17.
Anaerobic Soil Disinfestation (ASD) was developed in the Netherlands and Japan as a biological alternative to methyl bromide fumigation. Funded by USDA and the California Strawberry Commission, our research team has been working on optimizing ASD for California strawberries since 2007. Recent data showed that the ASD technique produced comparable marketable fruit yield with a fumigant (Pic-Clor 60) treatment. Although ASD technology is still a work-in-progress, many growers have expressed interests in learning about ASD. This workshop is designed to cover the basics and key aspects for successful ASD implementation.
When: 8/17/12 (F) 9-11am
Where: Auditorium at Santa Cruz County Cooperative Extension 1432 Freedom Boulevard, Watsonville, CA 95076-2796
Phone: (831) 763-8040
Agenda:
9-9:30am:
Anaerobic Soil Disinfestation (ASD): Basics and Research Update
Carol Shennan, Professor, Dept. of Environmental Studies. University of California, Santa Cruz.
9:30-10am:
Key Practices for Successful ASD Implementation
Joji Muramoto, Associate Researcher, Dept. of Environmental Studies. University of California, Santa Cruz.
10-10:20am:
Carbon Source Supplies and Consulting Services for ASD
Kurt Jacobson, Farm Fuel. Inc.
10:20-11am:
Questions and Answers
11am:
Adjourn
For more information, call Joji Muramoto at 831-247-3804.
- Author: Mark Bolda
Introduction: The following is a description of a second, more thorough evaluation of the situation described previously in this space of yellow strawberry plants in a field in Castroville. This issue of yellow strawberry plants popping up in certain locations in the Castroville – Salinas production area has confounded us for years, but I believe the work described below allows us to make a strong argument as to the cause is of this malady at least in this case.
Materials and Methods: A total of four samples (two from an area of severe yellowing, and two from an area of apparently healthy green plants) were taken. Following the output example posted below (Figure 2), each sample consists of 10 zones of a bed, and each zone is tested for 14 parameters. At each soil sampling site, a representative plant sample was uprooted and taken away for analysis of tissue mineral concentration.
Results: The data in the Tables 1 and 2 below represent an average of the two samples taken each for yellow and green plants. In order to better interpret the data, several zones have been grouped together. Zones 9 and 10 represent the surface of the bed, zones 1, 2 and 3 represent the soil straight underneath the drip tape, zone 8 the plant zone, zone 7 the root zone and zones 6, 5 and 4 being underneath the root zone 7.
Table 1: Evaluation of Zones 1- 6 of Bed in Yellow and Healthy Areas
|
Data (mg/Kg dw) |
Zones 1,2 and 3 |
Zones 4,5 and 6 |
||
|
|
Yellow |
Healthy |
Yellow |
Healthy |
|
Moisture (%) |
33.7 |
33.6 |
29.8 |
31.8 |
|
pH (units) |
8.5 |
8.1 |
8.5 |
8.1 |
|
EC5 (umhos/cm) |
269 |
267 |
381 |
355 |
|
Ammonia (NH3-N) |
24 |
32 |
60 |
16 |
|
Nitrate (NO3) |
204 |
49 |
443 |
94 |
|
Phosphate (PO4) |
126 |
86 |
66 |
68 |
|
Potassium (K) |
157 |
184 |
157 |
92 |
|
Calcium (Ca) |
419 |
417 |
398 |
201 |
|
Magnesium (Mg) |
169 |
375 |
174 |
130 |
|
Carbonate (CaCO3) % |
2.3 |
1.8 |
2.7 |
1.7 |
|
Sulfate (SO4) |
219 |
195 |
694 |
412 |
|
Sodium (Na) |
454 |
417 |
578 |
426 |
|
Chloride (Cl) |
175 |
184 |
181 |
242 |
|
Nitrite (NO2) |
0 |
0 |
0 |
0 |
Table 2: Evaluation of Zones 7-10 of Bed in Yellow and Healthy Areas
|
Data (mg/Kg dw) |
Zone 7- Root Zone |
Zone 8- Plant Zone |
Zones 9 and 10 |
|||
|
|
Yellow |
Healthy |
Yellow |
Healthy |
Yellow |
Healthy |
|
Moisture (%) |
30.6 |
32.1 |
33 |
33.1 |
22.8 |
26.3 |
|
pH (units) |
8.7 |
8.2 |
8.7 |
8.3 |
8.3 |
8.2 |
|
EC5 (umhos/cm) |
305 |
389 |
258 |
374 |
938 |
546 |
|
Ammonia (NH3-N) |
34 |
14 |
54 |
16 |
48 |
44 |
|
Nitrate (NO3) |
314 |
30 |
199 |
25 |
968 |
452 |
|
Phosphate (PO4) |
6.5 |
57 |
85 |
55 |
111 |
45 |
|
Potassium (K) |
144 |
74 |
185 |
89 |
206 |
89 |
|
Calcium (Ca) |
341 |
156 |
713 |
194 |
512 |
195 |
|
Magnesium (Mg) |
140 |
83 |
383 |
127 |
384 |
104 |
|
Carbonate (CaCO3) % |
2 |
1.3 |
2.0 |
1.9 |
2.0 |
1.9 |
|
Sulfate (SO4) |
434 |
492 |
239 |
437 |
1216 |
622 |
|
Sodium (Na) |
500 |
446 |
492 |
496 |
872 |
520 |
|
Chloride (Cl) |
160 |
309 |
165 |
330 |
433 |
310 |
|
Nitrite (NO2) |
0 |
0 |
0 |
0 |
0 |
0 |
Table 3: Comparison of Mineral Concentrations of Leaf Tissue for Green and Yellow Plants
|
Mineral |
Yellow Plant |
Green Plant |
|
Total Nitrogen |
2.4% |
2.2% |
|
Total Phosphorous |
0.38% |
0.44% |
|
Potassium |
1.1% |
1.2% |
|
Calcium |
1.5% |
1.3% |
|
Magnesium |
0.55% |
0.38% |
|
Total Sulfur |
0.21% |
0.18% |
|
Copper |
4.5 ppm |
3.7 ppm |
|
Zinc |
23 ppm |
18 ppm |
|
Iron |
515 ppm |
365 ppm |
|
Manganese |
185 ppm |
108 ppm |
|
Boron |
73 ppm |
78 ppm |
|
Molybdenum |
1.1 ppm |
1.9 ppm |
|
Sodium |
350 ppm |
79 ppm |
|
Chloride |
4150 ppm |
3000 ppm |
I’ve also taken a look at the irrigation water. As is common in northern Monterey county, the farm gets its water as a mixture of recycled water blended with well or river water. A full report for an example of the blended irrigation water used on this farm is available from the Monterey Regional Water Pollution Control Agency at:
http://www.mrwpca.org/recycling/chem2012_blended.php
In the sample taken of the blended recycled and river water mix, conductivity (EC) was 1.3 dS/m, sodium 118 ppm, chloride 160 ppm and adjusted SAR of 3.4 (sodium adsorption ratio, an index of sodium hazard adjusted for the amount of calcium in the irrigation water).
Discussion: The pH of the soil in the beds in all zones is quite high, which is not surprising because of the high percentage of carbonates (lime) throughout. One can also see accumulations of nitrates, phosphates and potassium are substantially higher in the areas of the yellow plants, which quite likely due to their declining ability to take up the nutrients being continually applied as fertilizer. It is worth noting that nitrates in the high concentrations found in our soil tests can be toxic to plants, thus accelerating the decline of plants.
Nitrites, generated from ammonium in anaerobic conditions, are zero, indicating adequate aeration in the bed.
In terms of the irrigation water, referring to the water quality guidelines for crops developed by UC Cooperative Extension, we find that the water used on this farm can be used with some restriction to irrigate crops moderately susceptible to salinity such as strawberry. In other words, this irrigation water isn’t great but is OK.
It seems that the real culprits in this field are the accumulated amounts of chloride and sodium. Generally speaking, crops in our area perform best when the soil sodium levels are less than 250 ppm and soil chloride levels are less than 100 ppm.
Across all the soil samples the average amounts of sodium and chloride are above 250 ppm and 100 ppm respectively. High as they are, the concentrations of both ions do not vary greatly in the plant and root zones and the zones around them in either areas of green or yellow plants. There are, however, substantial differences in the concentrations of these ions at the crust (zones 9 and 10) between green and yellow plant areas. For example, on average soil from areas of yellow plants there is nearly a twofold accumulation of sodium in the crust of soil taken as well as a substantially higher amount of chloride over the soil sampled around green, healthy plants. This tells us that while these large amounts of sodium and chloride (also known as salts) are accumulating away from the plant via evaporation, they are nevertheless passing through more sensitive plant zones to get there. It is not difficult then to hypothesize that during this transition the yellow plants are picking up these salts obtaining the fourfold accumulation of sodium and 40% increase in chlorides that we observe in the leaf tissue of yellow plants over that of green.
Furthermore, it is notable that the amount of lime (CaCO3) in all the soil samples is high. This indicates that a lot of calcium coming into the soil from irrigation water is precipitating out and not as capable of sufficiently limiting the amount of exchangeable sodium. In turn the sodium hazard is high. This may also explain to some extent why areas quite close to one another respond differently, since in some areas (perhaps even quite close together) more calcium precipitates out than others.
My conclusion drawn from all this work in this particular instance of severe plant yellowing of strawberry plants is that the uptake of sodium and chloride by these affected plants is very high and they are being poisoned by salt.
Thank you to Frank Shields and Soil Control Lab for their generous assistance in this work. Thanks to other colleagues for their valuable insight and input which assisted me in the development of my conclusion.
This project was supported in part with funds provided by the California Strawberry Commission.


