We have had a lot of rain this past April. I wanted to look at this year relative to previous years. I maintain an on-going database from three CIMIS stations in the Sacramento Valley Rice growing region (Davis, Colusa/Williams and Durham/Biggs). I develop an index where I take the average values from these three stations to get a general representation of the rice growing area. This data is available back to 1983.
Average April rainfall is 1.13 inches. In 2026, April rainfall amounted to 3.2 inches (see graph below). The last time there were similar amounts of April rain was 20 years ago in 2006 (3.25 in), before then, in 1983 April rainfall also amounted to 3.15 in. So, this 2026 April rainfall is certainly in record territory for the valley.
The question becomes; how does this affect the rice season? Certainly, the timing of the rainfall in April is important. If it occurs in early April, it has less impact on the rice season than later. In April there were two large storms, with the most recent being April 18-22. This year, due to a very warm and dry March, the rice season got off to an early start. According to USDA Planting Progress Report, by April 26, 10% of the rice acreage was planted. Driving around the valley and talking with other farm advisors and farmers, this seems like a realistic estimate. Many of these fields were flooded for planting during the second storm in April (18-22). Given the large amount of rainfall at that time, groundwork was delayed for about a week. Driving around this week I saw the start fields being worked on Wednesday (April 29).
Certainly, this rain will delay planting. Based on the USDA Planting Progress Report, on average, 50% of rice fields are planted by May 12. Looking back to 2006 when there was also a lot of April rain, 50% of the fields were planted by May 24 (the latest on record going back to 1994 when they started keeping these records). Unfortunately, that year the rice yields were also low (76.6 cwt/ac on average).
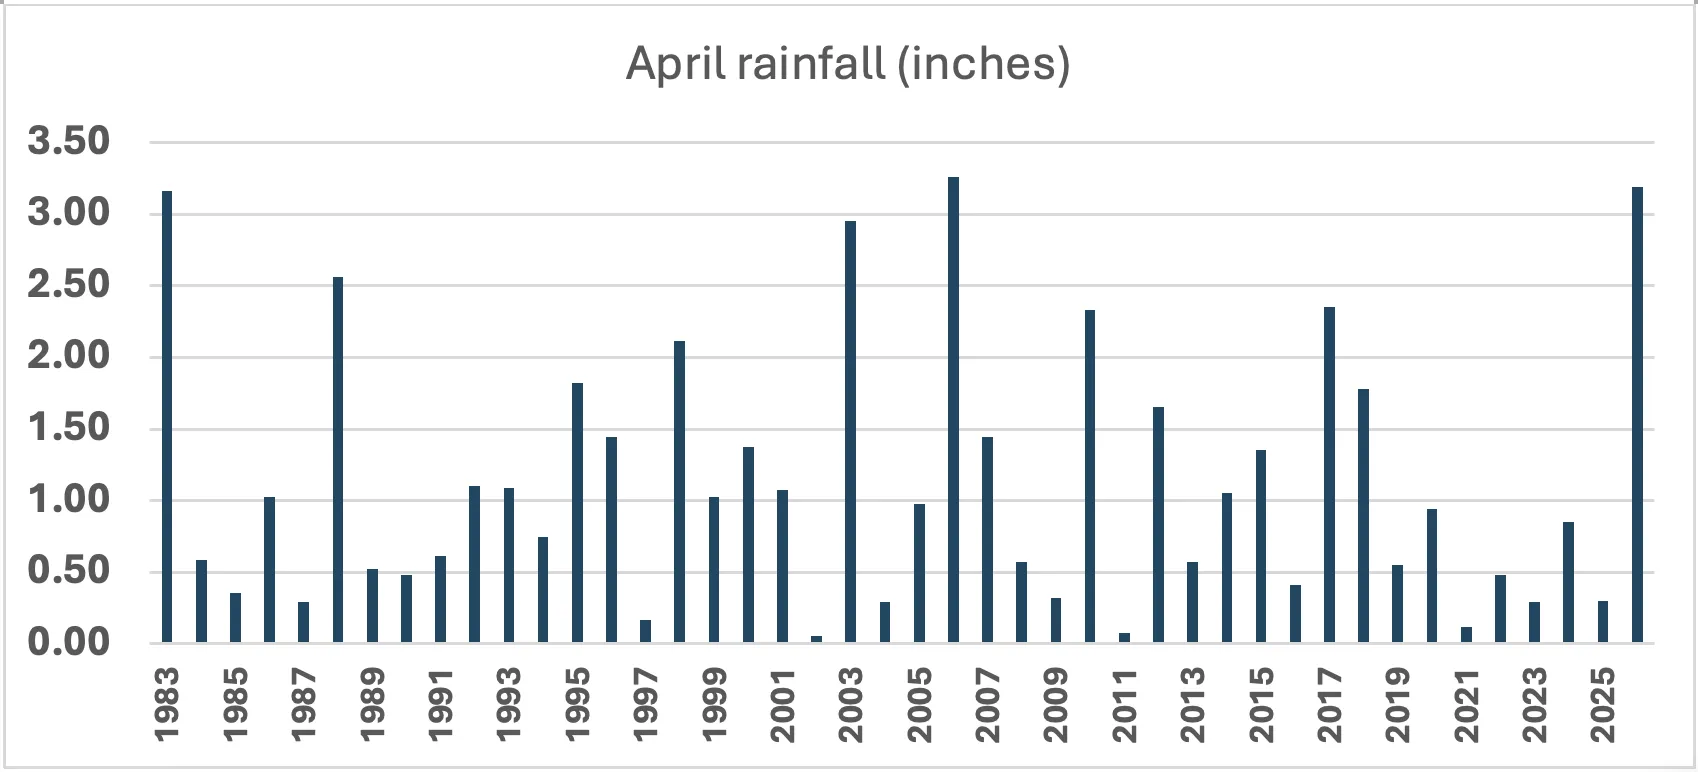
Figure: April rainfall (inches) from 1983 to 2026 for the rice region of the Sacramento Valley. April rainfall ranges from less than 0.1 inch (2002 and 2011) to over 3 inches (1983, 2006 and 2026); during this period, the average April rainfall is 1.3 inches.