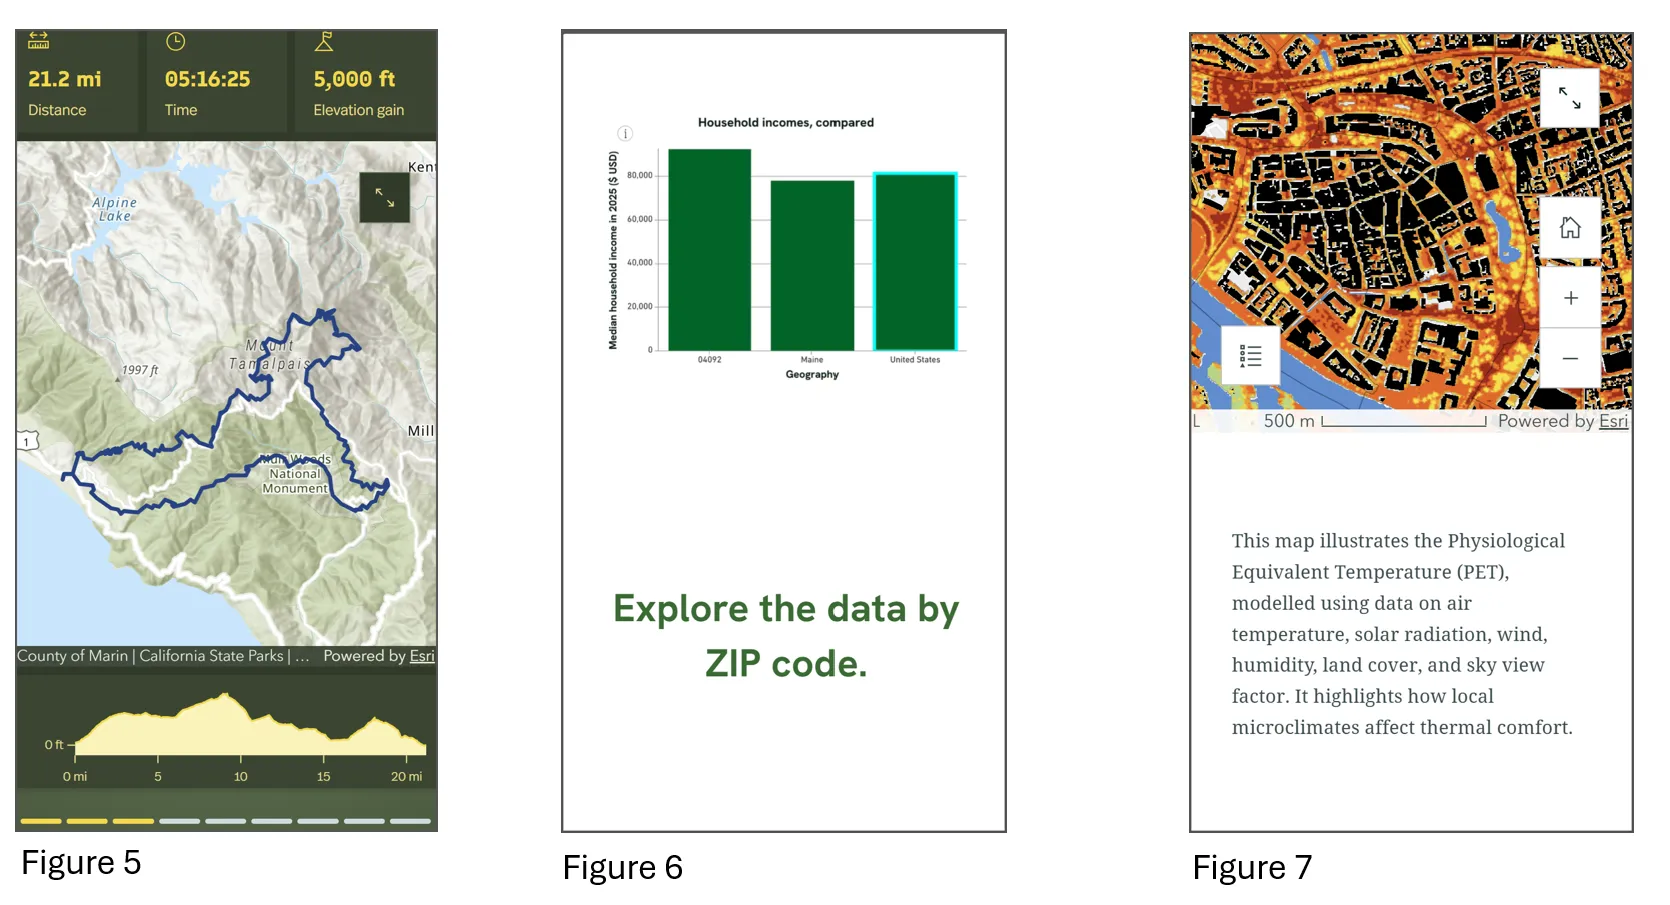
Excited about StoryMaps and don’t have time to gather a lot of content to go with it? If this sounds like your situation, then check out the newly launched StoryMaps Frame – a lighter version of StoryMaps that is designed for minimal content compared to the full fledged StoryMap and built primarily for viewing on mobile devices. Many of us have encountered the challenge where a StoryMap is built on a regular laptop or a large monitor and when it is viewed on a mobile device, some of the content may not adapt well to a smaller device. Or even if it adapts well, the content itself may not be best suited for viewing on mobile. At times we design a dashboard or an interactive map which is mobile friendly, however these web-apps come with the limitation that one cannot include descriptive text that provides context to the data.
To remedy these type of problems, ESRI has launched recently StoryMaps Frames. While this was a feature I had been seeing on my StoryMaps recently, I totally missed exploring the beauty of this new product until I met a developer of this product at the ESRI User Conference last week. Here are the top three reasons when you may consider using StoryMap Frames:
1. Lack of time and limited content
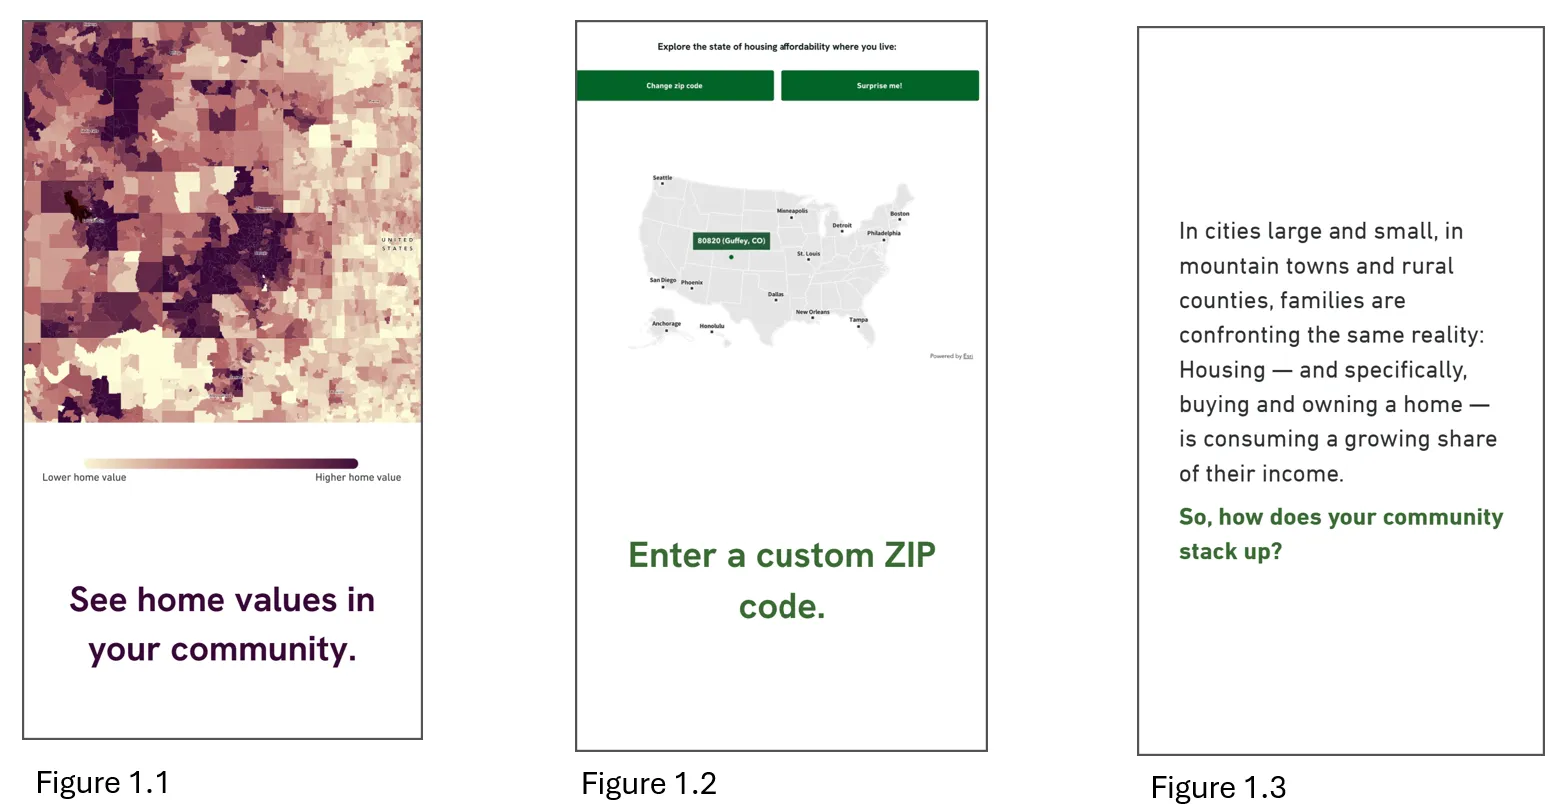
Since Frames are designed primarily for viewing on mobile, they do not require a lot of content that you would need to build a full fledged StoryMap. A full fledged StoryMap needs a variety of visuals such as static map or interactive map, photos of different sizes, and content to go with it. But with Frames you can share the key highlights for your audience. Here are some examples of StoryMap frames that you can view for inspiration. Figure 1.1-1.3 based on Through the Roof StoryMap Frames example reveal how Frames render interactive content with minimal text to guide the reader or even plain text with nice style and fonts.
2. Linking it to a larger StoryMap or a report
Frames can be a great way to entice your audience to a full fledged version of a StoryMap if you have built one. In case not, then you could still link it to a report or your latest scientific publication. This could be a quick and visually engaging way to share your work with your target audience. Think of Frames as an abstract of your journal article or key highlights of an annual report of your county, but instead of just being plain text it can be accommodate a variety of static and interactive visuals along with beautiful and enticing photos. This could arouse curiosity and hunger in your audience to learn more about your work. Figure 2.1 and Figure 2.2 provide a comparison of StoryMaps Frame of Where the Snow Stays to a full version StoryMap.
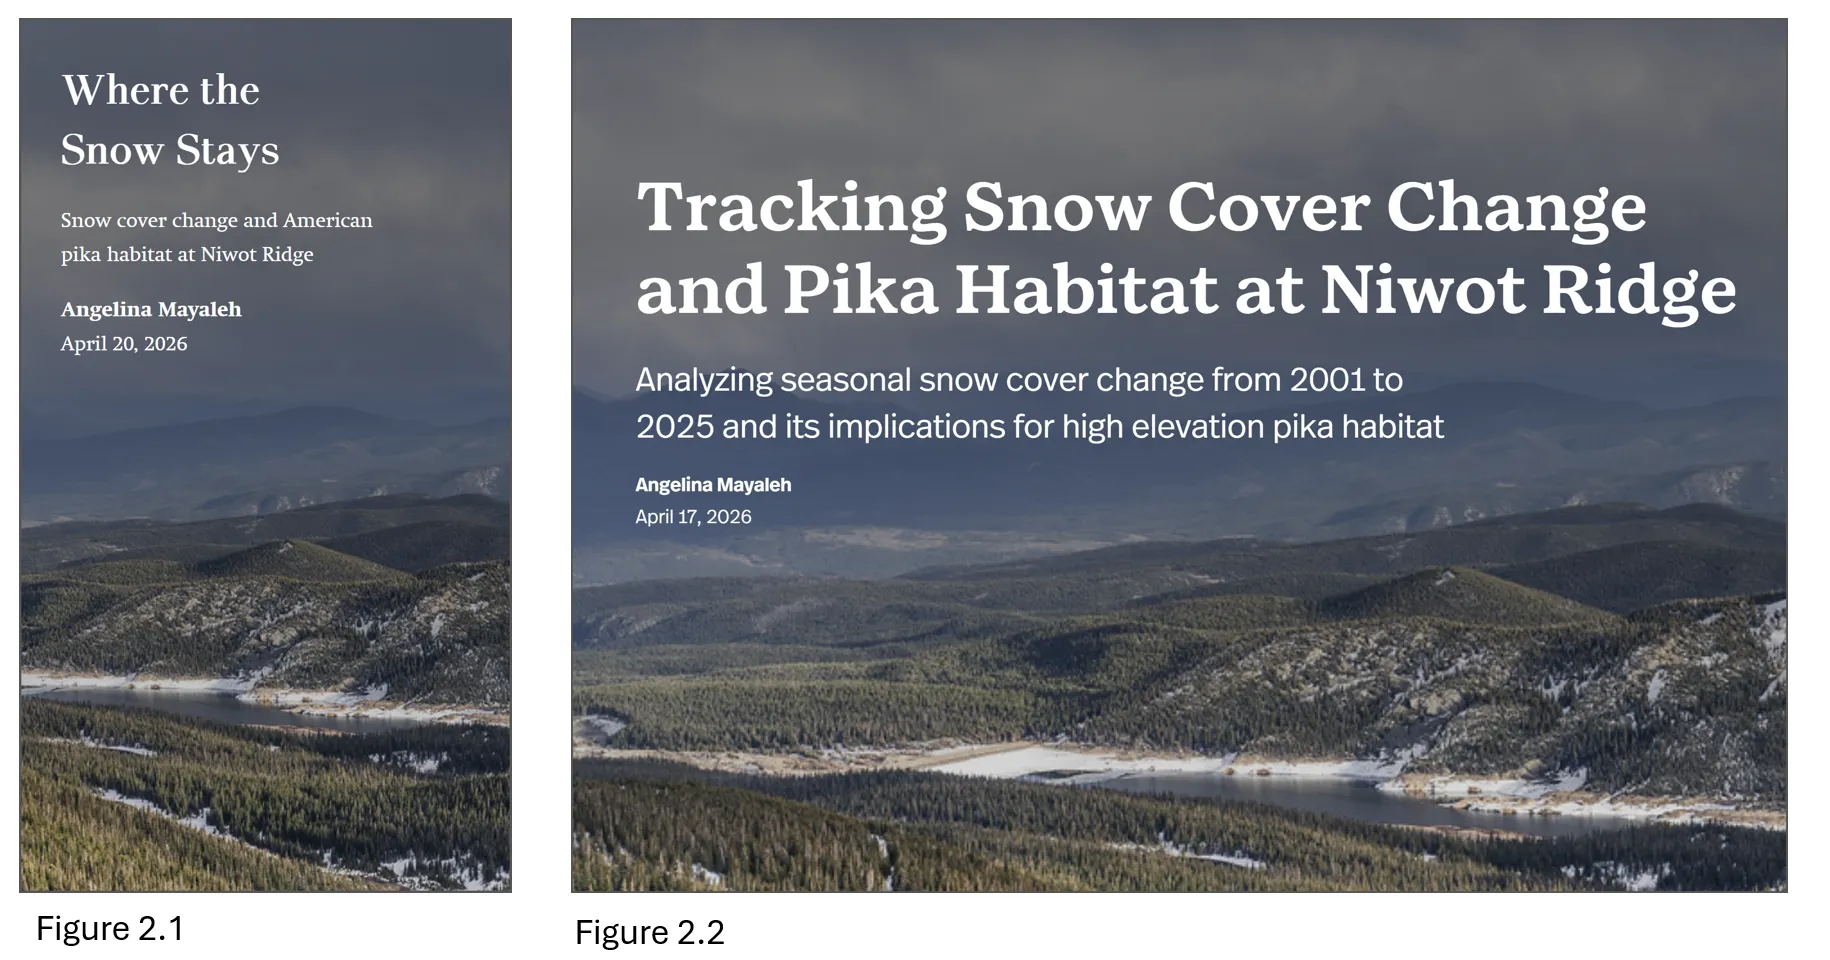
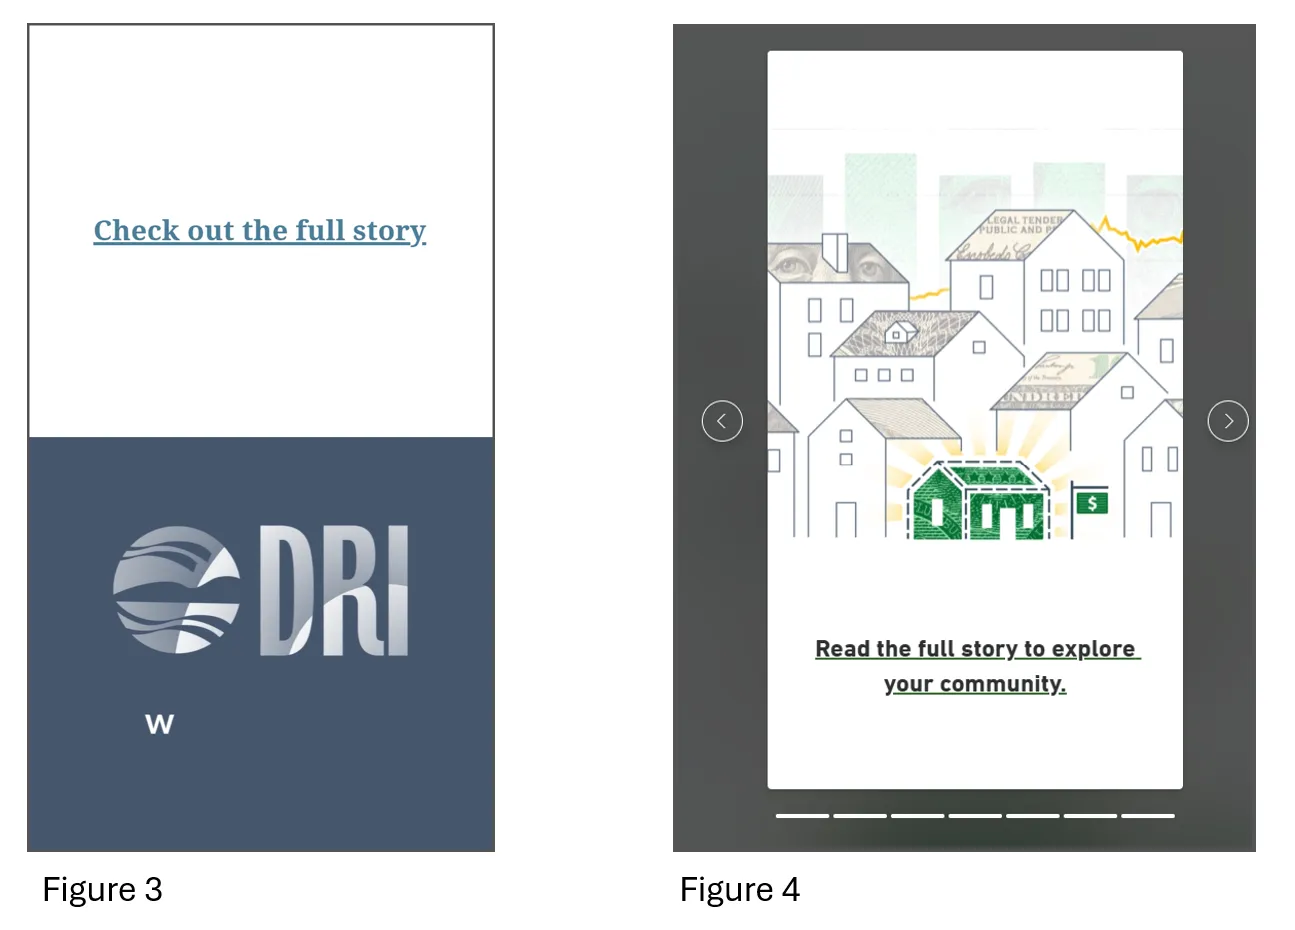
Figure 3 and 4 below demonstrate examples of how StoryMap Frames are used to promote the full version of the StoryMap by providing a link for the audience to check out.
3. When your target audience is super busy
Think of busy policymakers/legislators or grant funders. They usually don’t have time to read a lot of information. However, with Frames, you can convey key information or figures using many of the features available in a traditional StoryMap. Frames are good at displaying key numbers using infographics or icons. This can make it easy for funders or elected officials to find key numbers related to your project that they may need right before an important meeting. Figure 5-7 show how dashboards, interactive charts, maps with minimal text can be embedded seamlessly in StoryMaps Frames.