

So, you took your leaf analysis in mid- August or are having it done now in October, and you are now planning your fertility program for the year ahead. The sampled leaves were the most recently expanded, and matured, healthy, terminal leaves from the spring flush and from non-fruiting branches. This is also the time to start planning applications of mulches, such as manures and chipped materials, in anticipation of the rains. It is good to get these materials out so that any potential salt problems that might come with manures are lessened by the leaching effects of rain.
The reason for taking leaf samples in this period is that this is a relatively stable period in nutrient content when sampling the prior spring's flush. Some nutrients (e.g. nitrogen and potassium) start out high and decrease with age (e.g. nitrogen and potassium), while others (e.g. calcium and magnesium) increase with time. By comparing this year's values with last year's and knowing what you did last year, you can adjust up or down the amounts of nutrients applied, as well as evaluate the adequacy of your irrigation program.
If chlorides, sodium or boron have increased significantly over last year's, you know timing and amounts of irrigation need to be altered or that your water quality has changed and irrigation needs to be managed differently.
A leaf analysis is essential for guiding a fertility program since indiscriminate fertilizer applications can cause serious imbalances of other nutrients. For example, excesses of both macro and micronutrients can cause iron chlorosis. Depending on soil texture and pH, unjustified additions of phosphorus, potassium, calcium, magnesium, zinc and copper have all been implicated in iron chlorosis. Have a definite reason before applying a nutrient. In general avocados in coastal California need water, nitrogen and potassium, and on occasion zinc and iron.
When the lab returns your results you should look not only at last year's, but the avocado leaf analysis guide. The following Chart gives ranges of leaf nutrient concentrations for the various elements of concern. The range for each element often has a fairly wide extent for adequate or sufficient levels of nutrient concentration. If your tissue levels fall within the adequate range, the trees are fine. It is not necessary to feel worried if your levels fall toward one end or the other of the adequate range. The adequate/sufficient range means just that; you are doing a good job. The recommendations are based on the best judgements for a given environment and management practice.
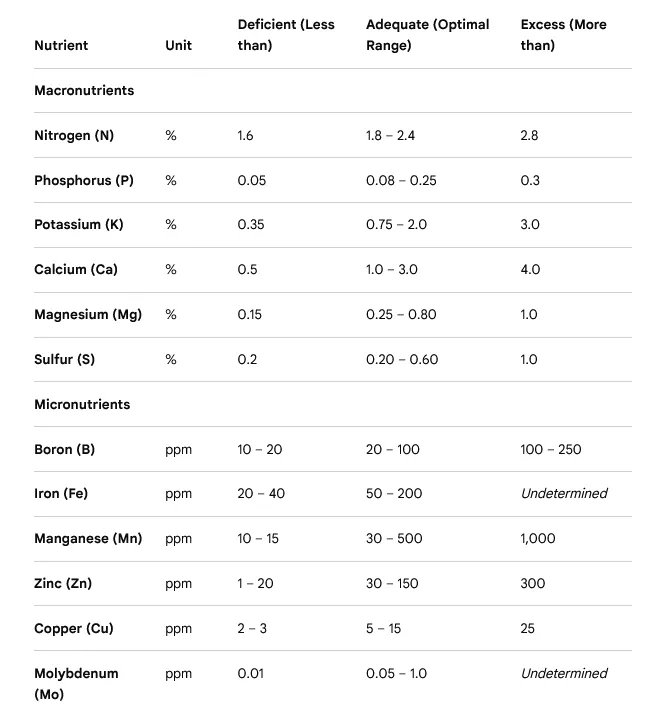
It is only when the values fall beyond the deficient or excess level that you need to be alerted. This is when you go into action, adjusting your fertility program. An example of how to read the California chart for nitrogen would be to look at the table and see that 1.8 to 2.4 percent by dry leaf weight is an adequate range. Below 1.8, and it is time to change the application timing or amount of nitrogen fertilizer. It is not always necessary to increase the amount applied, a change in practice may be what is called for. Instead of broadcasting urea once or twice a year, get a fertilizer injector and start applying the same or possibly lesser amount with irrigation. If tissue analysis shows an excess of 2.4 percent, it is time to think about reducing nitrogen applications. This is not only to conserve money, energy and potential imbalances of other nutrients, it is also to reduce the potential of nitrate contamination of surface and groundwaters.
The ranges in the Chart were developed over many years. Tom Embleton at U.C. Riverside did some very important nitrogen work in the 50's and 60's. More was examined under a microsprinkler regime by Arpaia, Meyer, Witney and Bender near Valley Center. In a five-year trial, they found there were no significant cumulative yield differences when either no nitrogen, 1.5 lbs./tree or 3 lbs./tree applied on a yearly basis. Leaf tissue values for this trial ranged from nearly 2.5% to around 1.7. Tree yields bounced around on a year-to-year basis as they do with avocado, but the cumulative yield of the three treatments were nearly the same. If you think about it, in a mature orchard yielding 10,000 lbs/acre, the nitrogen in the fruit that is removed from the field to the consumer only represents about 24 lbs. N/acre. The rest, hopefully, is in the tree or in the root zone of the soil.
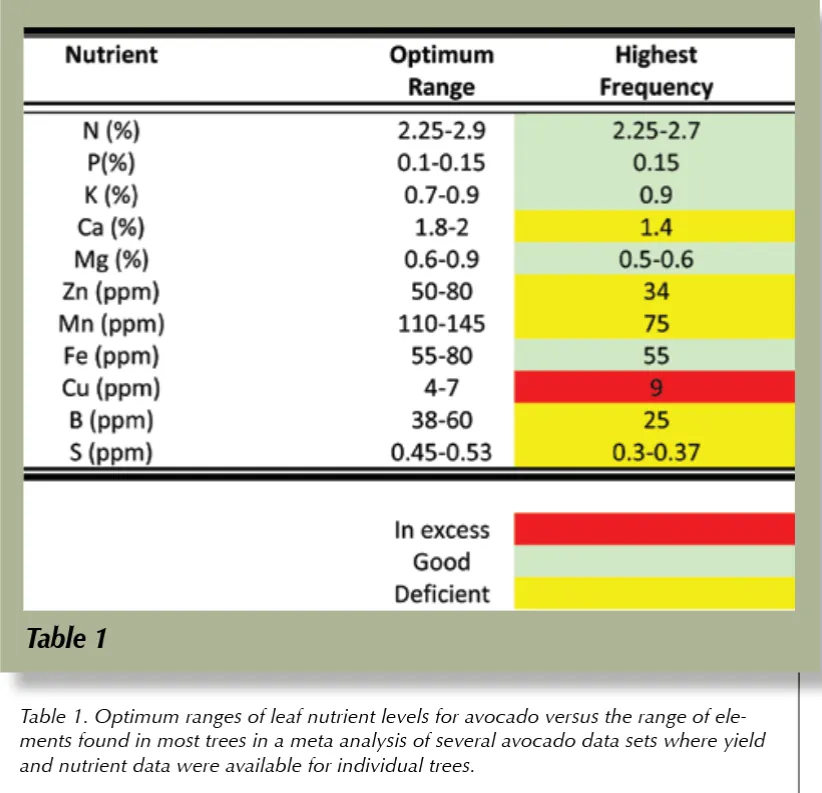
Based on significant studies of a wide range of trees in different growing conditions, David Crowley at UCR was able to generate a more detailed optimum range for avocado leaf sufficiency:
https://www.californiaavocadogrowers.com/sites/default/files/2023-11/2015-Fall-From-the-Grove_0.pdf
he avocado is a closed system, where leaves are raining down to the ground, rotting and returning their nutrients to the soil to be absorbed by the tree again. It is really an elegant nutrient system, with the numerous superficial roots soaking up needed nutrients like a sponge. Following the Chart only helps us nudge the system along. The chart is only that. When it is obvious that yields are going to be larger or smaller than normal or that the trees have been hit by a freeze, it is also necessary to incorporate these facts into a managed fertility program.
Correcting soil pH can significantly improve uptake of zinc and iron. Also correcting phytophthora root rot which destroys the fine roots that take up these micronutrient can aid in uptake. Irrigation management also significantly affects nutrient uptake. Managing irrigation and soil pH can be adjusted along with the leaf analysis nutrient additions to improve plant health and yield. A sound mulch program, either natural avocado leaf mulch or imported, can significantly improve tree nutrient levels. As mulch decomposes, all the stored nutrients are gradually released, and these decomposed nutrients are normally in the balance required for tree growth.