Posts Tagged: Maggi Kelly
UC ANR scientists contribute to California’s Fourth Climate Change Assessment
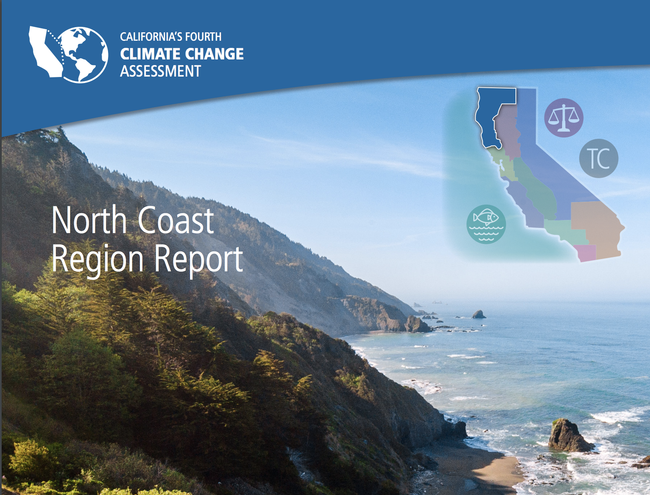
The California Natural Resources Agency released California's Fourth Climate Change Assessment today (Monday, Aug. 27), at http://www.ClimateAssessment.ca.gov. UC Agriculture and Natural Resources scientists contributed substantially to the report.
The Fourth Assessment is broken down into nine technical reports on the following topics:
- Agriculture
- Biodiversity and habitat
- Energy
- Forests and wildlife
- Governance
- Ocean and coast
- Projects, datasets and tools
- Public health
- Water
The technical reports were distilled into nine regional reports and three community reports that support climate action by providing an overview of climate-related risks and adaptation strategies tailored to specific regions and themes.
The regional reports cover:
- North Coast Region
- Sacramento Valley Region
- San Francisco Bay Area Region
- Sierra Nevada Region
- San Joaquin Valley Region
- Central Coast Region
- Los Angeles Region
- Inland South Region
- San Diego Region
The community reports focus on:
- The ocean and coast
- Tribal communities
- Climate justice
All research contributing to the Fourth Assessment was peer-reviewed.
UC Cooperative Extension ecosystem sciences specialist Ted Grantham – who works in the Department of Environmental Science, Policy and Management at UC Berkeley – is the lead author of the 80-page North Coast Region Report. Among the public events surrounding the release of the Fourth Assessment is the California Adaptation Forum, Aug. 27-29 in Sacramento. For more information, see http://www.californiaadaptationforum.org/. Grantham is a speaker at the forum.
Other UC ANR authors of the North Coast Region Report are:
- Lenya Quinn-Davidson, UC Cooperative Extension area fire advisor for Humboldt, Siskiyou, Trinity and Mendocino counties
- Glenn McGourty, UC Cooperative Extension viticulture and plant science advisor in Mendocino and Lake counties
- Jeff Stackhouse, UC Cooperative Extension livestock and natural resources advisor for Humboldt and Del Norte counties
- Yana Valachovic, UC Cooperative Extension forest advisor for Humboldt and Del Norte counties
UC Cooperative Extension fire specialist Max Moritz contributed to sections of the main report on Forest Health and Wildfire and to the San Francisco Bay Area Report.
UC ANR lead authors of technical reports were:
- Economic and Environmental Implications of California Crop and Livestock Adaptations to Climate Change, Daniel Sumner, director of UC ANR's Agricultural Issues Center
- Climate-wise Landscape Connectivity: Why, How and What Next, Adina Merenlander, UC Cooperative Extension specialist
- Visualizing Climate-Related Risks to the Natural Gas System Using Cal-Adapt, Maggi Kelly, UC Cooperative Extension specialist
Fewer big trees found in today's forests
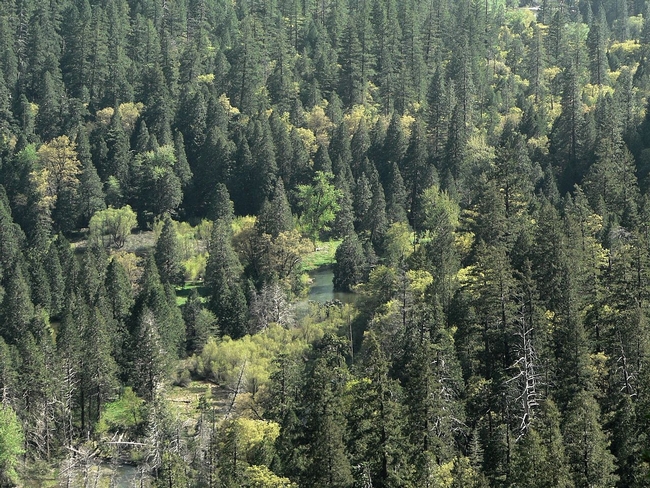
The story said scientists compared exquisitely detailed tree data collected in the 1920s and 1930s with tree surveys made between 2001 and 2010. They identified significant and rapid changes in basic forest structure. As large tree density fell across the state, and the density of small trees increased.
"The thing that I think is particularly worrisome is how widespread this is," said Maggi Kelley, UC Cooperative Extension specialist in the Department of Environmental Science, Policy and Management at UC Berkeley. "These changes will have an impact on how animals use the forest, how fire moves through the forest and the way we view the forest."
"Our grandkids will definitely see a difference," she said.
The Los Angeles Times also covered the new research, which will be published in the Proceedings of the National Academy of Sciences.
LA Times reporter Taylor Goldenstein spoke to study co-author Mark Schwartz, a professor of environmental science and policy at UC Davis and director of the John Muir Institute of the Environment. Schwartz said a denser forest allows fire to travel faster, causing more devastation. After a fire, new, smaller trees grow that are more likely to catch fire, and the cycle continues.
“These are historically fire-maintained ecosystems,” Schwartz said. “The firemen are faced with this notion of when a fire is reported and started, do they go out and bring out helicopters, trucks and people and put the fire out or do they let it burn?”
Just how much the change in forest structure is due to fire suppression and how much results from climate change is hard to tell because the two are interrelated, Schwartz said.
National Geographic magazine invoked Peter, Paul and Mary's mournful ballad in its headline, "Where have all the big trees gone? They've gone to logging and housing - but especially to climate change."
Reporter Warren Cornwall wrote that no area was immune to the forests' decline, from the foggy northern coast to the Sierra Nevada mountains to the San Gabriels above Los Angeles.
The loss of big trees was greatest in areas where trees had suffered the greatest water deficit. Large trees in general appear to be more vulnerable to a water shortfall. Though the 2011-14 drought might have an impact on forest change, it was not reflected in this study because the data was collected before the drought began.
The food vs. fuel debate: Growing biofuel in the U.S.
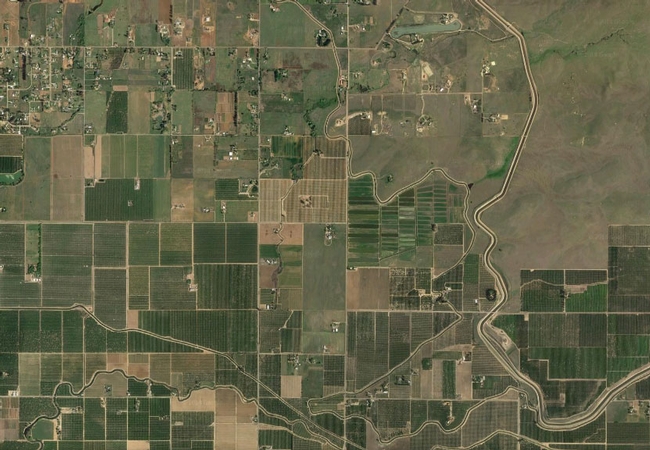
However, estimates suggest that growing crops to produce that much biofuel would require 40 to 50 million acres of land, an area roughly equivalent in size to the entire state of Nebraska.
“If we convert cropland that now produces food into fuel production, what will that do to our food supply?” asks Maggi Kelly, UC Cooperative Extension specialist and the director of the UC Agriculture and Natural Resources Statewide IGIS Program. “If we begin growing fuel crops on land that isn't currently in agriculture, will that come at the expense of wildlife habitat and open space, clean water and scenic views?”
Kelly and UC Berkeley graduate student Sarah Lewis are conducting research to better understand land-use options for growing biofuel feed stock. They used a literature search, in which the results of multiple projects conducted around the world are reviewed, aggregated and compared.
“When food vs. fuel land questions are raised in the literature, authors often suggest fuel crops be planted on ‘marginal land,'” Kelly said. “But what does that actually mean? Delving into the literature, we found there was no standard definition of ‘marginal land.'”
Kelly and Lewis' literature review focused on projects that used geospatial technology to explicitly map marginal, abandoned or degraded lands specifically for the purpose of planting bioenergy crops. They narrowed their search to 21 papers from 2008 to 2013, and among them they found no common working definition of marginal land.
“We have to be careful when we talk about what is marginal. We have to be explicit about our definitions, mapping and modeling,” Kelly said. “In our lab, we are trying to understand the landscape under multiple lenses and prioritize different uses and determine how management regimes impact the land.”
The research report, titled Mapping the Potential for Biofuel Production on Marginal Lands: Differences in Definitions, Data and Models across Scales, was published in the International Journal for Geo-Information.
Click here for this story in Spanish.
An initiative to improve energy security and green technologies is part of UC Agriculture and Naturalist Resources Strategic Vision 2025.
Web-based tools' contribution to public participation and natural resource management
Because management projects in contentious natural resource contexts often involve finding reasonable compromise or shared understandings between participants, the success (or failure) of such management is partly about communicating information. Techniques for public participation continue to evolve in order to facilitate a more comprehensive flow of information to, from, and between diverse audiences.
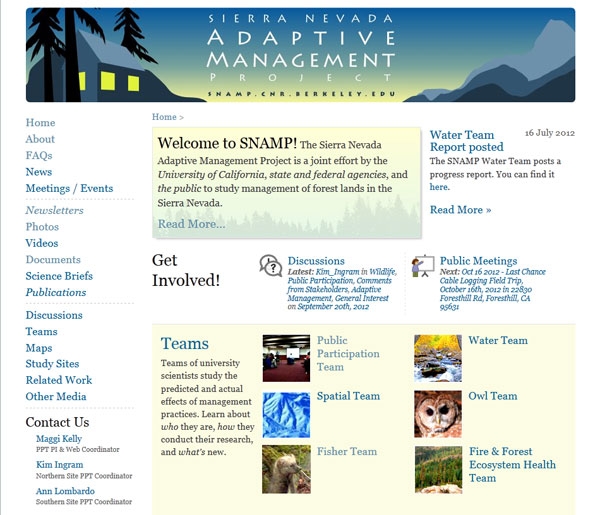
The Internet is part of this evolution: web-based tools provide information exchange between diverse participants and stakeholders about complex environmental systems. But how effective are these tools and do they facilitate the flow of information required in adaptive management? Maggi Kelly, UC Cooperative Extension specialist in the Department of Environmental Science, Policy and Management at UC Berkeley, and Lynn Huntsinger, professor in ESPM at Berkeley, and graduate students Shasta Ferranto, Ken-ichi Ueda and Shufei Lei examined the role of the web in facilitating public participation through a case study - the Sierra Nevada Adaptive Management Project (SNAMP) - a participatory adaptive management project focused on Forest Service vegetation management treatments in California’s Sierra Nevada with a participatory website.
Analyzing three years of website traffic data from Google Analytics, researchers found that the SNAMP website received over 71,000 unique visits from the United States and other countries. Site traffic peaked when quarterly “web updates”- emails sent out to stakeholders with information about the project and any updates - were sent. The data from an email survey conducted by the SNAMP Public Participation Team in 2010 showed that most survey respondents (72.2 percent) had visited the website. Email survey respondents also agreed that the website helped them keep up with SNAMP events, increased information transparency, was easy to use, and was a good source of information. The web also played a small, but important role in public consultation, by providing a discussion board for targeted questions and feedback between the public and SNAMP scientists. However, Internet technology did not actively support the two-way flow of information necessary for mutual learning. It complements, but does not substitute for, face-to-face interactions and public meetings; does not facilitate three-party conversations very well; and has a very small user base to generate sufficient online content and dialogue.
Based on this case study, public participation is most effective when a combination of participatory tools are used, including the web, public meetings, active outreach, and open channels of communication for reaching a broad pool of participants needed for social networking. Website design should be adaptive, and website evolution and maintenance should be budgeted ahead and funded. User needs assessments are necessary to understand how the users collaborate and interact during the life of a project.
Full Reference: M.Kelly, S.Ferranto, K.Ueda, S.Lei, and L.Huntsinger. 2012. Expanding the table: the web as a tool for participatory adaptive management in California forests. Journal of Environmental Management 109: 1-11.
Visualizing the forest
‘Visualizing’ forests from computer and other technological data is common practice in the field of forestry. Forest visualization is used for stand and landscape management and to predict future environmental conditions. Currently, most visualization software packages focus on one forest stand at a time (hundreds of acres), but now we can visualize an entire forest, from ridge top to ridge top. The Sierra Nevada Adaptive Management Project (SNAMP) Spatial Team principle investigators Qinghua Guo, associate professor in the UC Merced School of Engineering; Maggi Kelly, UC Cooperative Extension specialist in the Environmental Science, Policy and Management Department at UC Berkeley; graduate student Jacob Flanagan and undergraduate research assistant Lawrence Lam have created cutting-edge software that allows us to visualize the entire firescape (thousands of acres).
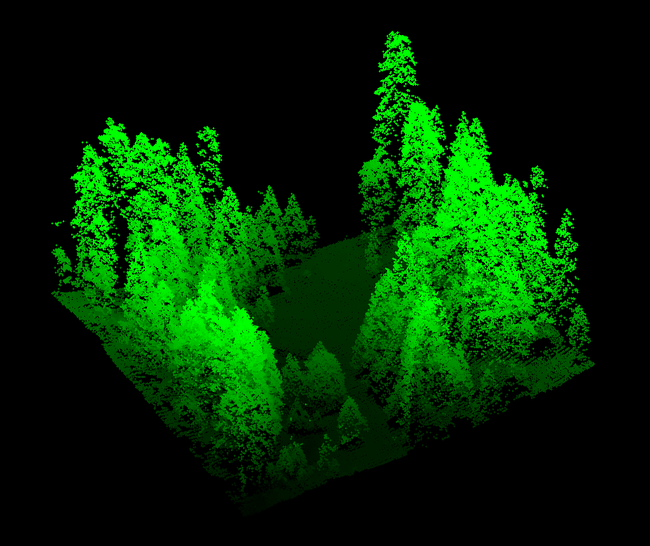
This software uses data collected from a relatively new remote sensing technology called airborne lidar. The word lidar stands for “light detection and ranging” and it works by bouncing light pulses against a target. A portion of that light is reflected back to the airborne sensor and recorded. The time it takes the light to leave and return to the airplane is converted into distance. This measurement, along with position and orientation data from the plane, allows us to calculate the elevation at which the light pulse was reflected, thereby creating a three-dimensional map of the forest vegetation and ground surface. The raw lidar data is seen as a cloud of points from which we can extract meaningful representations. See our lidar FAQ here: http://snamp.cnr.berkeley.edu/documents/251/.
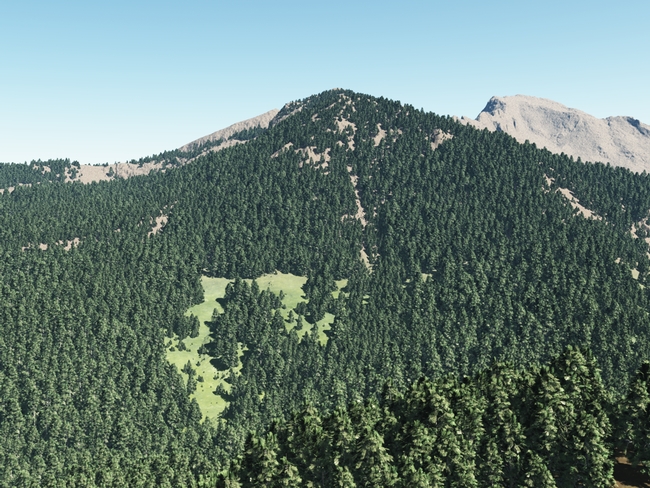
Our new forest visualization software begins by pulling out individual trees from the point cloud. From these individual trees, we extract the tree height and width data. Canopy base height data helps describe the shape of each tree. Then, each individual tree is modeled, and the whole forest is constructed. Visual details such as needles or smooth edges can be added in. This helps to provide a more realistic perspective of the forest than from point clouds alone.
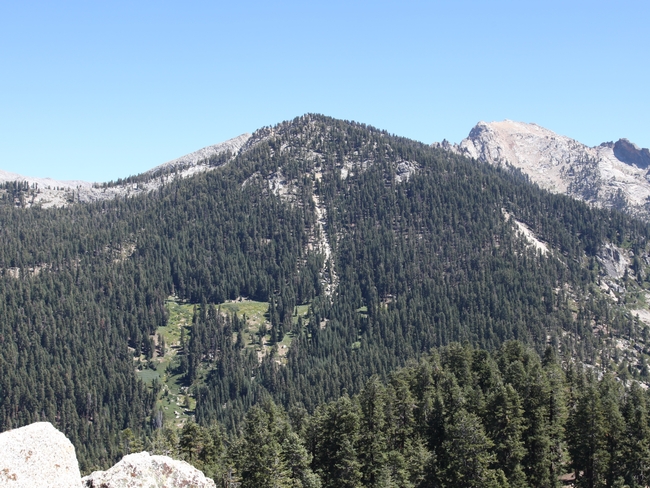
A forested landscape in the Sierra Nevada (left: a photograph taken with a camera) compared to lidar derived virtual forest (right: simulated scene based on the actual location of trees, tree height, and crown size derived from our lidar data, minus the rocks in the lower left-hand corner)
Forest visualization with lidar is useful for helping us understand the complexities in forest structure across the landscape, how the forest recovers from fuels reduction treatments, and how animals with large home ranges might use the forest.
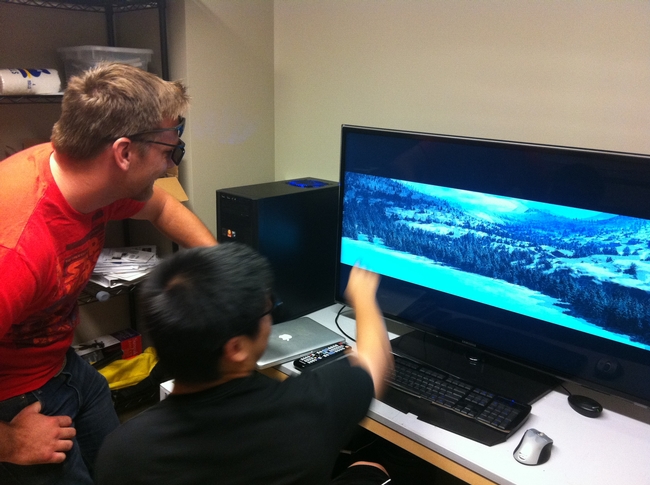
These images, created from lidar data, are still two-dimensional, and thus they lack a sense of depth. To alter that, we have been actively working to bring the created virtual forest into the 3D realm that we are accustomed to seeing in movies or television. Our proposed 3D system relies on stereoscopic imaging to allow individuals to see in 3D. Stereoscopic imaging refers to an optical illusion created by allowing two offset images to be seen by the viewer’s two eyes, independently. The difference in perspective between the left eye and the right eye causes the brain to process the image with depth, which is how current active stereoscopic images are produced in movies or television. By utilizing the fact that the projected forest is virtual, we can then render two offset images to create a new stereoscopic object. From there, a 3D TV easily overlays the two images on top of the other, alternating an image for the left and then right eye, creating an illusion of 3D and depth for the viewer. Again, these visualizations are not of simulated forests, but of our real Sierra Nevada forest, with every tree in the correct place with respect to the other trees, and seen with the correct height.
SNAMP links:
- SNAMP website: http://snamp.cnr.berkeley.edu/
- SNAMP Spatial Team: http://snamp.cnr.berkeley.edu/teams/spatial
- SNAMP Research Briefs (where some of the lidar research has been published): http://snamp.cnr.berkeley.edu/news/categories/research-briefs/

