The Problem: I first addressed this issue and evaluated a yellowing of the leaves at the tips of fruiting laterals in an organic raspberry field in 2015, and have now once again been called on to evaluate the same thing in that is widespread in two new raspberry varieties. With the generosity of the all the growers involved, I’ve been able to take pretty thorough look at this in both cases and arrive at a reasonable conclusion of what is going on.
The issue is that the youngest leaves on the ends of some fruiting laterals, around half of the total in the field in all cases, are showing a distinctive yellowing (see photo 1 below). In many of the cases, the veins of the affected leaves remain green to some extent.
Field Evaluation:
In the first case in 2015, I took 4 replicated samples of yellow leaves and then four replicated samples of green leaves from the same stage (between the 5th and 7th leaf from the tip) of apparently healthy laterals.
In the second case which I have been involved with since May, I took 3 samples of tips which were green and 3 samples of tips which were yellow (see photo 2 below). Here I took leaves closer to the tip, between the 3rd and 5th in both cases.
In both cases, soil samples were also taken down to 6” inches with an Oakfield soil sampler at the base of the plant right around the wetting front from irrigation. Four replicates were taken in 2025 and 3 replicates were taken in 2026.
Results:
The means of the replicated tissue samples were compared through a Student’s t-test and the results are presented below in Table One.
Table One. Average Mineral Concentration of Green and Yellow Leaves, organic raspberries, 2015
| Mineral | Green Leaves | Yellow Leaves | T-test p value |
| Total Nitrogen (%) | 2.825 | 2.875 | 0.4950 |
| Total Phosphorous (%) | 0.19 | 0.2025 | 0.2394 |
| Potassium (%) | 1.425 | 1.925 | 0.0088 |
| Calcium (%) | 1.675 | 1.375 | 0.0462 |
| Magnesium (%) | 0.4525 | 0.375 | 0.0139 |
| Sulfur (%) | 0.165 | 0.15 | 0.1817 |
| Copper (ppm) | 4.725 | 4.625 | 0.7629 |
| Zinc (ppm) | 14.25 | 14 | 0.3910 |
| Iron (ppm) | 530 | 380 | 0.0270 |
| Manganese (ppm) | 42.75 | 21.25 | 0.0016 |
| Boron (ppm) | 73.25 | 68.5 | 0.2777 |
| Sodium (ppm) | 172.5 | 167.5 | 0.1817 |
Table Two. Average Mineral Concentration of Green and Yellow Leaves, conventional raspberries, 2026
| Mineral | Green Leaves | Yellow Leaves | T-test p value |
| Total Nitrogen (%) | 2.92 | 2.71 | 0.072 |
| Total Phosphorous (%) | 0.13 | 0.14 | 0.42 |
| Potassium (%) | 0.95 | 1.48 | 0.07 |
| Calcium (%) | 1.86 | 1.58 | 0.08 |
| Magnesium (%) | 0.42 | 0.40 | 0.63 |
| Copper (ppm) | 3.80 | 3.97 | 0.55 |
| Zinc (ppm) | 23 | 27 | 0.26 |
| Iron (ppm) | 249 | 247 | 0.42 |
| Manganese (ppm) | 44.67 | 26 | 0.03 |
| Boron (ppm) | 80.33 | 89.67 | 0.17 |
| Sodium (ppm) | <100 | <100 | - |
As one can see from the two tables included here, that there are several minerals, being potassium, magnesium, manganese, calcium and iron, which are significantly lower (p<0.05) in concentration in the yellow leaves than in the green in the first, 2015 data set, but only manganese is significantly different in the second, 2026, data set.
It is worth pointing out that the potassium in both sets of foliar samples trends much lower in the green leaves than the yellow, significantly so in 2015. This is concentration of what is a highly mobile nutrient in leaves which are ostensibly compromised and turning yellow is something worth looking at more in the future.
Also, I did have a PCA share with me a tissue analysis from yet another field with yellowing laterals of a proprietary raspberry variety, and much like my examples here, the manganese here is something like half in the yellow leaves when compared to the green - 17 ppm to 39 ppm. Potassium is also much higher in these yellow leaves than the green ones.
The unfortunate thing is that since we still don’t have published guidelines for raspberry varieties (for example like the DRIS study in strawberry), we need to recur to out of state raspberry fertility guidelines for other varieties to get a handle on the meaning of all these numbers. Using these guidelines, we find that the concentration of manganese in the yellow leaves falls below the consensus of a lower threshold of sufficiency of about 30 ppm. In contrast, concentrations of iron, calcium, and magnesium, even though they are significantly lower in the yellow leaves than the green, are still within the generally accepted ranges of sufficiency.
The averages of the soil samples are below. As there was no area in the field showing more yellow than others, simply four composites of six individual samples were taken to get an understanding of the background mineral concentration of the soil.
Table Three. Average Mineral Concentrations of Soil, 2015 organic raspberries.
| Mineral | Soil Concentration |
| NO3-N (ppm) | 10.83 |
| NH3- N (ppm) | 5.70 |
| Phosphorous (ppm) | 102.00 |
| pH | 7.63 |
| ECe (dS/m) | 0.91 |
| Calcium (meq/L) | 4.73* |
| Magnesium (meq/L) | 2.37* |
| Sodium (meq/L) | 1.63* |
| Potassium (meq/L) | 0.49* |
| Chloride (meq/L) | 1.83* |
| SAR | 0.87 |
| Boron (ppm) | 0.65 |
| Copper (ppm) | 1.53 |
| Zinc (ppm) | 4.77 |
| Iron (ppm) | 27.67 |
| Manganese (ppm) | 3.90 |
* Saturated paste extraction
Table 4. Average Mineral Concentrations of Soil, 2026 conventional raspberries
| Mineral | Soil Concentration |
| NO3-N (ppm) | 39 |
| NH3- N (ppm) | 15 |
| Phosphorous (ppm) | 119 |
| SP (%) | 212 |
| pH | approximately 7 |
| ECe (dS/m) | - |
| Calcium (ppm) | 3242 |
| Magnesium (ppm) | 170 |
| Sodium (meq/L) | 3.7 |
| Potassium (ppm) | 120 |
| Chloride (meq/L) | 3 |
| SO4-S (meq/L) | - |
| SAR | - |
| Boron (ppm) | 0.3 |
| Copper (ppm) | 3.6 |
| Zinc (ppm) | 14.8 |
| Iron (ppm) | 55.7 |
| Manganese (ppm) | 17.3 |
Nothing jumps out here from these tables of soil concentrations. Nitrates might be a tad lean at 10 ppm in Table 3 while they are quite strong in Table 4 with a titer of 39 ppm, phosphorous is as is typical for our area high, pH is normal in Table 2 (and unfortunately not taken in the second soil test, Table 4 but that soil is understood by the grower to be around 7)
The question is then what to do? One is that the neutral to a bit higher than neutral pH of the soil is possibly limiting the manganese, and that the big fruit load could be also drawing off this nutrient from the leaves and moving them to the fruit which are quite close by. I think all told, it certainly would not hurt to add manganese to the plant, either through a foliar application or if possible through the drip tape.
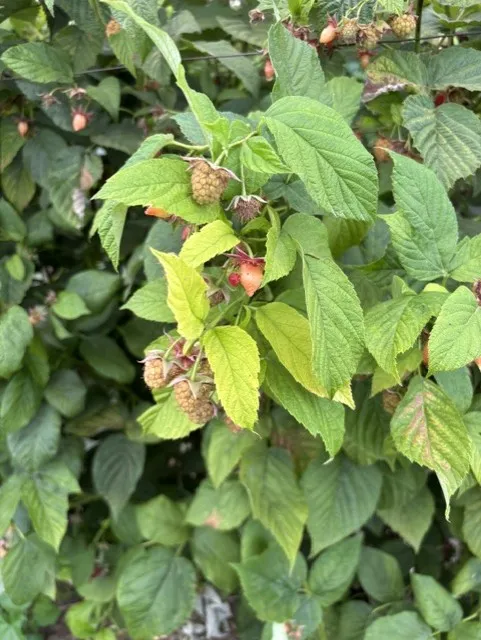
Photo 1: Yellowed leaves at the tip of fruiting lateral.
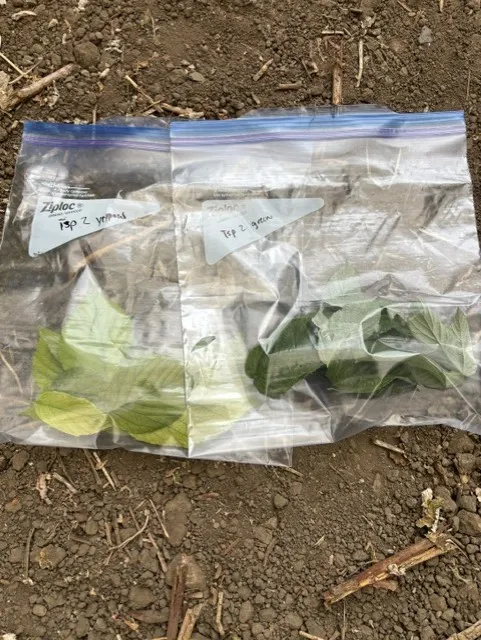
Photo 2 - Comparison of green and yellow leaves taken.