
- Author: Richard Smith
The lack of rain in the Salinas Valley brings many concerns. The lack of runoff into lakes San Antonio and Nacimiento of course is a concern for the availability of water to run down the river to recharge the ground water for irrigation purposes. In addition, the lack of rain will affect the levels of salts that remain up in the root zone of the crops. Soil nitrate (NO3-) is one of the anions that will remain in the soil if leaching by winter rains does not occur. Nitrate is highly mobile and can be easily leached with just one or more significant rain storms; figure 1 illustrates nitrate leached from the top foot of soil by a series of storms that delivered 2.0 inches of water over the course of one week in the winter of 2010. High residual soil nitrates may come from several sources: 1) unused fertilizer from the previous crops or fall preplant nitrogen applications; 2) mineralization of crop residues from the previous crop; and 3) mineralization of soil organic matter over the winter (mineralization of soil organic matter is much slower during the winter but will still occur to a minimal degree).
We recently surveyed several soils looking for a site to conduct a fertilizer trial and observed that residual soil nitrate levels were routinely over 20 ppm nitrate-nitrogen. These levels were in contrast with levels that we observed last year following a wet spring where, in general, residual soil nitrate levels were in the 5 – 10 ppm nitrate-nitrogen range. The difference in conditions between a dry winter like this and a wet winter like last year is that it has implications for planning nitrogen fertilizer programs; with soil residual nitrate levels this high, the nitrogen fertilizer needs of the first crop fields will behave like second crop fields in that the robust amounts of residual soil nitrate in the soil that can provide for the crop needs and allow you to reduce nitrogen fertilizer programs.
To illustrate this point, we observed a great difference in the fertilizer needs of first vs second crop spinach during the 2011 growing season. In a first crop spinach planting, residual soil nitrate levels were at 5 ppm at the beginning of the trial. Spinach responded to at-planting applications of nitrogen up to 40 lbs nitrogen/A (Figure 2). The second crop spinach planting had initial levels of residual soil nitrate of 28 ppm nitrate-nitrogen which allowed the grower to skip the at-planting nitrogen application; he made one top-dress nitrogen application two weeks after planting to bring the crop to harvest. The results of a top-dress nitrogen evaluation indicated that there was no improvement in yield beyond 25 lbs nitrogen per acre (Figure 3).
These results indicate the importance of deep percolation of water on residual levels of soil nitrate. Winter rains have the beneficial effect of leaching salts from the soil. It is very unfortunate that nitrate is one of the salts that is leached with the water, but that is the case. In many of the discussions that we have had over the last several years regarding managing nitrogen fertilization more efficiently, we have emphasized that testing for residual soil nitrate is generally most effective for the second crop of the season. However, given the extreme lack of leaching rain events this winter, residual soil nitrate levels are also high at the beginning of the first crop in many areas in the valley and can be taken into consideration when planning nitrogen fertilization.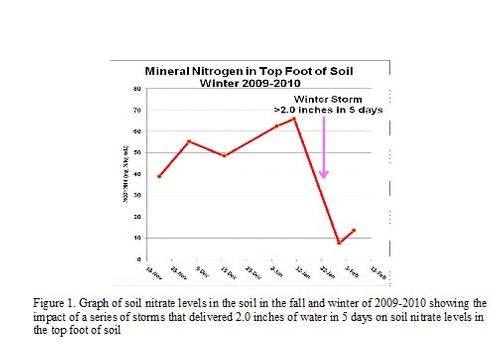

Figure 2. Yield response of first crop spinach under five
application rates of at-planting nitrogen (0 – 80 lbs N/A)

Figure 3. Yield response of second crop spinach under five application rates of top-dressed nitrogen (0 – 105 lbs N/A); no at-planting nitrogen was applied to this planting.
- Author: Michael D Cahn
- Contributor: Barry Farrara
Several strawberry growers have expressed interest in using evapotranspiration data for scheduling irrigations in strawberries, especially during the production season when crop water needs are greatest. Weather-based approaches to scheduling irrigations are used for many cultivated crops. Windspeed, air temperature, relative humidity, and solar radiation affect plant water-use, or more specifically the water lost by evaporation from the soil and by transpiration from the leaves of the crop. Using evapotranspiration (ET) data (evaporation + transpiration) from the California Irrigation Management Information System (CIMIS) the consumptive water use of a crop in units of inches or mm per day, can be estimated.
CIMIS ET data is available from the Department of Water Resources website (http://wwwcimis.water.ca.gov/cimis/welcome.jsp) for more than 120 locations in California, and is generated by weather stations located on irrigated grass, which serves as a reference crop. The MyCIMIS feature of the website allows the user to customize the reporting of CIMIS crop ET data, such as specifying type of weather data, stations, time period, and file format to display. MyCIMIS also allows the user to select for the data to be emailed to their account. Spatial CIMIS is another feature of the website that produces estimates of reference ET at a 2 km (1.2 mi) resolution using GOES satellite information and by triangulating humidity, temperature and wind speed data from the closest CIMIS stations to the point of interest. A Google map feature allows the user to locate a field of interest. Similar to MyCIMIS, a user can select to have updated Spatial CIMIS estimates of reference ET emailed.
ET can be estimated for a specific crop by multiplying reference ET data and the appropriate crop coefficient (Kc):
ETcrop = ETref × Kc
The value of Kc can range from almost 0 to greater than 1 and is closely related to the percentage of ground shaded by the canopy. Irrigation method and physiological stages, such as flowering and senescence are also factored into the crop coefficient. Crop ET values should be adjusted down by 20% to 30% for crops grown under macro tunnels or greenhouses because of shading.
Because accurate crop coefficients are not available for many crops, estimates of canopy cover serve as a close substitute for the Kc values. We have taken overhead photos of the UC strawberry variety Albion using an infra-red camera during the last 2 years. Photos were taken on a monthly schedule for fields with 48-, 52-, and 64- inch wide beds. After analyzing canopy images from 9 fields, we have estimated the Kc values on a weekly schedule during a 12 month period (Table 1). Because these data represent the average of several fields, values may need to be adjusted for site-specific conditions. Also, these Kc values for Albion represent Salinas and Pajaro Valley growing conditions and methods.
By irrigating enough to replace water lost by evapotranspiration it is possible to optimize irrigations for production and minimize percolation below the root zone. Also, it is possible to avoid under-irrigating during periods of high water consumption, which can result in stress and reduced growth. ETc estimates can be used to determine day by day soil water depletions from field capacity and thus can be used to also estimate when to irrigate. For detailed descriptions and examples of this technique, visit http://wwwcimis.water.ca.gov/cimis/infoIrrSchedule.jsp
Table 1. Estimated crop coefficient (Kc) for UC strawberry variety Albion.
| 48-inch bed width | 52-inch bed width | 64-inch bed width | |||||||
| Plant Date | DAP | % canopy cover | Kc | % canopy cover | Kc | % canopy cover | Kc | ||
| 11/1/2011 | 0 | 1 | 0.02 | 1 | 0.01 | 1 | 0.02 | ||
| 11/8/2011 | 7 | 1 | 0.02 | 1 | 0.02 | 1 | 0.03 | ||
| 11/15/2011 | 14 | 1 | 0.02 | 1 | 0.02 | 2 | 0.03 | ||
| 11/22/2011 | 21 | 1 | 0.03 | 1 | 0.02 | 2 | 0.04 | ||
| 11/29/2011 | 28 | 2 | 0.03 | 1 | 0.02 | 3 | 0.04 | ||
| 12/6/2011 | 35 | 2 | 0.04 | 1 | 0.03 | 3 | 0.05 | ||
| 12/13/2011 | 42 | 2 | 0.04 | 2 | 0.03 | 4 | 0.06 | ||
| 12/20/2011 | 49 | 3 | 0.05 | 2 | 0.04 | 4 | 0.07 | ||
| 12/27/2011 | 56 | 3 | 0.06 | 2 | 0.04 | 5 | 0.08 | ||
| 1/3/2012 | 63 | 4 | 0.06 | 3 | 0.05 | 6 | 0.09 | ||
| 1/10/2012 | 70 | 5 | 0.08 | 4 | 0.06 | 7 | 0.11 | ||
| 1/17/2012 | 77 | 5 | 0.09 | 4 | 0.07 | 8 | 0.13 | ||
| 1/24/2012 | 84 | 6 | 0.10 | 5 | 0.08 | 10 | 0.15 | ||
| 1/31/2012 | 91 | 8 | 0.12 | 6 | 0.10 | 11 | 0.17 | ||
| 2/7/2012 | 98 | 9 | 0.14 | 7 | 0.11 | 13 | 0.20 | ||
| 2/14/2012 | 105 | 10 | 0.16 | 9 | 0.13 | 15 | 0.23 | ||
| 2/21/2012 | 112 | 12 | 0.18 | 10 | 0.15 | 18 | 0.26 | ||
| 2/28/2012 | 119 | 14 | 0.21 | 12 | 0.18 | 20 | 0.29 | ||
| 3/6/2012 | 126 | 16 | 0.23 | 14 | 0.21 | 23 | 0.33 | ||
| 3/13/2012 | 133 | 18 | 0.27 | 16 | 0.24 | 26 | 0.37 | ||
| 3/20/2012 | 140 | 21 | 0.30 | 19 | 0.28 | 29 | 0.41 | ||
| 3/27/2012 | 147 | 23 | 0.33 | 22 | 0.32 | 33 | 0.46 | ||
| 4/3/2012 | 154 | 26 | 0.37 | 25 | 0.36 | 36 | 0.50 | ||
| 4/10/2012 | 161 | 29 | 0.41 | 28 | 0.40 | 40 | 0.54 | ||
| 4/17/2012 | 168 | 32 | 0.44 | 32 | 0.44 | 43 | 0.58 | ||
| 4/24/2012 | 175 | 35 | 0.48 | 35 | 0.49 | 47 | 0.62 | ||
| 5/1/2012 | 182 | 38 | 0.52 | 39 | 0.53 | 50 | 0.66 | ||
| 5/8/2012 | 189 | 40 | 0.55 | 43 | 0.57 | 54 | 0.70 | ||
| 5/15/2012 | 196 | 43 | 0.58 | 46 | 0.61 | 57 | 0.73 | ||
| 5/22/2012 | 203 | 46 | 0.61 | 49 | 0.65 | 60 | 0.76 | ||
| 5/29/2012 | 210 | 48 | 0.64 | 53 | 0.69 | 62 | 0.79 | ||
| 6/5/2012 | 217 | 50 | 0.66 | 55 | 0.72 | 65 | 0.81 | ||
| 6/12/2012 | 224 | 52 | 0.69 | 58 | 0.75 | 67 | 0.83 | ||
| 6/19/2012 | 231 | 54 | 0.71 | 61 | 0.77 | 69 | 0.85 | ||
| 6/26/2012 | 238 | 56 | 0.72 | 63 | 0.79 | 70 | 0.87 | ||
| 7/3/2012 | 245 | 57 | 0.74 | 65 | 0.81 | 72 | 0.88 | ||
| 7/10/2012 | 252 | 59 | 0.75 | 66 | 0.83 | 73 | 0.89 | ||
| 7/17/2012 | 259 | 60 | 0.76 | 68 | 0.84 | 74 | 0.90 | ||
| 7/24/2012 | 266 | 61 | 0.77 | 69 | 0.85 | 75 | 0.91 | ||
| 7/31/2012 | 273 | 61 | 0.78 | 70 | 0.86 | 76 | 0.92 | ||
| 8/7/2012 | 280 | 62 | 0.79 | 71 | 0.87 | 76 | 0.92 | ||
| 8/14/2012 | 287 | 63 | 0.79 | 71 | 0.88 | 77 | 0.93 | ||
| 8/21/2012 | 294 | 63 | 0.80 | 72 | 0.88 | 77 | 0.93 | ||
| 8/28/2012 | 301 | 64 | 0.80 | 72 | 0.89 | 78 | 0.94 | ||
| 9/4/2012 | 308 | 64 | 0.81 | 73 | 0.89 | 78 | 0.94 | ||
| 9/11/2012 | 315 | 64 | 0.81 | 73 | 0.90 | 78 | 0.94 | ||
| 9/18/2012 | 322 | 65 | 0.81 | 74 | 0.90 | 79 | 0.95 | ||
| 9/25/2012 | 329 | 65 | 0.82 | 74 | 0.90 | 79 | 0.95 | ||
| 10/2/2012 | 336 | 65 | 0.82 | 74 | 0.90 | 79 | 0.95 | ||
| 10/9/2012 | 343 | 65 | 0.82 | 74 | 0.90 | 79 | 0.95 | ||
| 10/16/2012 | 350 | 65 | 0.82 | 74 | 0.91 | 79 | 0.95 | ||
| 10/23/2012 | 357 | 65 | 0.82 | 74 | 0.91 | 79 | 0.95 | ||
| 10/30/2012 | 364 | 66 | 0.82 | 75 | 0.91 | 80 | 0.95 | ||
- Contributor: Steven T. Koike
2012 Pepper Production Meeting
Meeting Rescheduled: New Date Wednesday, March 29, 2012
8:00 a.m. - 12:15 p.m.
Gilroy Grange Hall (8191 Swanston Lane)
Agenda
- Contributor: Steven T. Koike
The University of California Allium Workgroup & California Garlic and Onion Research Advisory Board present the California Garlic and Onion Symposium 2012 with the latest research results for Growers and Allied Industry on Monday, February 13, 2012 at the Agriculture Building Auditorium, UC Cooperative Extension, Tulare County - 4437 S. Laspina Street in Tulare, CA.
Please see the agenda below for more information:
AGENDA-FLYER
- Author: Richard Smith and Stuart Pettygrove, Farm Advisor, Monterey County and Soil Specialist, UC Davis
Potassium is a critical nutrient in vegetable production in the Salinas Valley. In nearly all key vegetable crops that are produced here, the amount of potassium removed in the harvested crop is similar to or exceeds that of nitrogen (Table 1). Potassium dynamics in the soil are distinctly different from nitrogen, and the need for it can be assessed by a soil test. Ammonium acetate extraction is the most common technique for assessing potassium availability in the soil. Some laboratories use the Mehlich-3 test, which gives numerically a similar result to the ammonium acetate method. In general crops growing in soils with test values above 200 ppm do not respond to potassium fertilization (Table 2). In general, the decomposed granite soils on the eastside tend to have the lowest potassium levels in the Salinas Valley, while clay loams and clays tend to have higher values (Table 3). However, due to fertilization practices there are some exceptions noted in the 2010 survey of Central Coast soils.
However, there are some details about potassium that need to be kept in mind; the standard soil tests for K (ammonium acetate and Mehlich-3 analytical methods) provide an index of available potassium and not a quantitative measure of soil potassium content. Other cations in the soil solution (calcium, magnesium, sodium, ammonium) can compete for plant uptake, and therefore it can be helpful to look at the percent potassium of exchangeable soil cations. Cation competition with potassium is not a problem if potassium makes up more than 3% of exchangeable cations. In soils where potassium makes up less than 2% of exchangeable cations, potassium uptake may be restricted. Table 3 shows examples of soils with relatively high potassium levels; in some of these soils potassium is relatively low as a percent of exchangeable cations and may be of concern.
Potassium uptake by plants is affected by the density of the root system of the plant. Factors that affect root development affect potassium uptake: rooting depth, irrigation system (drip vs sprinkler), soil compaction and root disease. In general, any production practice or unfavorable soil condition that reduces rooting density will reduce potassium uptake. An advantage of drip irrigation over sprinkler is the ability to deliver a concentrated dose of potassium by fertigation at the time of the season when demand is highest.
Certain soils have a tendency to fix potassium and make it unavailable or only slowly available to plants. Soils that contain large amounts of the silicate mineral vermiculite have the ability to trap the potassium ions between layers of the crystalline structure of the mineral, thereby making it unavailable to plants. Vermiculite is generally associated with soils derived from granite, but the type of granite affects the levels of vermiculite. In addition, the age of the alluvium and the degree of weathering impacts the quantity of vermiculite in the soil. Very young soils may not have had sufficient time for all the parent material potassium (in mica and hydrous mica) to weather out of it, and will not have a significant K fixation potential. On the other hand, in very old soils, the vermiculite may have weathered to a different type of clay (smectite) which does not have the proper crystalline structure to fix potassium. Soils with high levels of potassium (e.g., > 200 ppm) are likely low in vermiculite and have little or no potential to fix potassium.
Potassium fixation potential has been identified in some soils used for cotton and other crops on the east side of the San Joaquin Valley but has not been examined in other parts of California. In a recent survey of a small number of soil samples from Salinas Valley vegetable field, none were found to fix potassium in a UC Davis laboratory test for this. The lack of fixation capacity in Salinas Valley soils may reflect the impact of crop production and past fertilization practices. Crop production may affect the weathering of vermiculite on the surface layer of soil. Fertilization practices over the years result in higher soil potassium levels which can saturate potassium fixing sites in the soil minerals.
Potassium is also capable of leaching from soils. We conducted an evaluation of leaching during winter storms on a sandy loam soil on the eastside of the Salinas Valley. The amount of anions and cations leached was measured using suction lysimeters placed two feet deep in the soil; in addition, we measured the quantity of moisture moving through the soil during each rain event. The data indicates that there was movement of potassium and other ions deeper in the soil profile (Table 4). It is interesting to note that, the relative loss of potassium was much less than other cations. Potassium is bound to the negatively charged sites on clay and soil organic matter and losses of potassium due to leaching are generally assumed to be low rich in these materials.
In general, there appears to be robust levels of potassium in some Salinas Valley soils. This is particularly true for heavier soils. However, crop removal by many Salinas Valley crops is also quite robust. Fertilization with potassium does not have the environmental consequences that we observe with nitrogen and phosphorus and it seems prudent to utilize potassium fertilization programs that replace potassium that leaves the farm in harvested product and to use soil testing to monitor the situation.
Table 1. Nutrient content of Salinas Valley crops at harvest (lbs/acre).
|
Crop |
Nitrogen |
Potassium |
|
Lettuce |
90 – 1401 |
150 – 180 |
|
Broccoli |
180 – 220 |
160 – 240 |
|
Cauliflower |
180 – 220 |
160 – 240 |
|
Celery |
180 – 240 |
350 – 450 |
|
Spinach - clip |
60-1102 |
25-552 |
1 – higher nitrogen uptake occurs on 5-6 seedlines on 80 inch beds;
2 – these values are currently being evaluated by a research project
Table 2. Soil adequacy levels of potassium for Salinas
Valley cool season crops
|
Crop Response |
Potassium ppm |
|
|
Celery |
Other cool season vegetables |
|
|
Response unlikely |
>200 |
>150 |
|
May respond |
150 – 200 |
100-150 |
|
Response likely |
<150 |
<100 |
Table 3. Analyses of 14 Central Coast soils for available potassium
(ammonium acetate extraction top foot of soil) in 2010
|
No. |
Soil Type |
Potassium ppm |
Potassium percent of all cations |
Sand % |
Silt % |
Clay % |
|
1 |
Chualar Loam |
182 |
3.2 |
53 |
30 |
17 |
|
2 |
Metz loamy sand |
112 |
3.7 |
84 |
10 |
6 |
|
3 |
Metz loamy sand |
182 |
2.7 |
80 |
10 |
10 |
|
4 |
Gary sandy loam |
147 |
2.0 |
69 |
16 |
15 |
|
5 |
Cropley clay |
419 |
3.1 |
27 |
31 |
42 |
|
6 |
Mocho silty clay |
317 |
2.3 |
15 |
52 |
33 |
|
7 |
Salinas clay loam |
500 |
3.8 |
33 |
31 |
36 |
|
8 |
Sorrento clay loam |
424 |
3.7 |
21 |
50 |
29 |
|
9 |
Chualar sandy loam |
370 |
7.9 |
75 |
15 |
10 |
|
10 |
Clear lake clay |
496 |
3.6 |
18 |
41 |
41 |
|
11 |
Salinas loam |
217 |
2.6 |
35 |
41 |
24 |
|
12 |
Antioch sandy loam |
171 |
1.6 |
38 |
34 |
28 |
|
13 |
Sorrento clay loam |
346 |
3.5 |
26 |
45 |
29 |
|
14 |
Sorrento clay loam |
261 |
2.0 |
37 |
29 |
34 |
|
|
Mean |
296 |
3.3 |
44 |
31 |
25 |
Table 4. Estimate of cations and anions leached during winter
storm events (winter 2009-2010) under three cover crop treatments
|
Cover crop treatment |
Nutrient leached (lbs/A) |
|||||
|
K |
Ca |
Mg |
Na |
Cl |
SO4-S |
|
|
Bare Fallow |
9 |
133 |
32 |
88 |
158 |
36 |
|
Triticale |
18 |
216 |
55 |
178 |
275 |
60 |
|
Rye |
16 |
226 |
63 |
191 |
289 |
69 |

