
Table of Contents
- Finding the Productivity of your Soil
- Soil Mapping
- Using Soil Surveys
- Site Index: an Estimate of Soil Productivity
- Site Index Curves
- Estimating Site Index
- Estimating soil productivity - using forest floor plants
- Site Class
- Definitions
Finding the Productivity of your Soil
Soil productivity is a measure of the capacity of a soil to grow plants. This capacity is influenced by the soil’s chemical and physical properties, which include its texture, structure, organic matter content, nutrients, and acidity. Measurement of these properties directly can be time consuming and require a good deal of expertise.
Fortunately, a lot of information on soils has already been compiled by the U.S. Department of Agriculture’s Natural Resources Conservation Service (NRCS), formerly the Soil Conservation Service. The NRCS was formed in the mid-1930's as a national response to rapid soil erosion during the Dust Bowl. The agency works directly with private land owners to conserve their lands. In addition the NRCS surveys soils across the nation. The soils on about 95% of California’s privately owned land have been mapped.
Soils Mapping
Characteristics of soil vary widely from place to place. For example, the soil on steep slopes is usually not as deep or productive as soil on gentle slopes. Soil that has developed from sandstone is more sandy and less inherently productive than soil formed from rocks such as limestone. Scientists have studied the geographical distribution of soil properties and set up labeling systems that designate where one type of soil ends and where another type begins.
Soils which have similar properties and developed in the same way are described as a soil series. There are about 16,800 soil series recognized in the United States.
A soil description is a summary of the major characteristics and uses of a soil series. It includes a typical soil profile description to help identify and classify the soils on a specific site.
NRCS maintains the free online Web Soil Survey (WSS) tool. It provides public access to the largest natural resource information system in the world. The website contains maps showing the soil series occurring in specific areas, and descriptions of the soil’s properties. The soil maps have soil series boundaries on them as well as soil series; slope class; and human features such as roads and buildings.
Using Soil Surveys
Although Soil Surveys contain a lot of information, they are not considered accurate enough for site-specific planning such as timber sales. Soil surveys have limited detail and limited field checking. Small scale, site specific variations are mostly ignored on the maps, but can be quite important in management. The general descriptions will give you an idea of the smallest size area that is mapped. Specific descriptions of each soil type will indicate if that
soil is similar or if that soil is often included with other soil types.
Timber harvesting or other ground disturbing activities use soil survey information in a general way. Foresters, engineers, and soil scientists use the general descriptions to develop guidelines appropriate for each soil series.
For example, using heavy equipment for logging operations may be restricted on soil series which are naturally very prone to compaction. Heavy logs may not be skidded on soil series which compact easily. Soils which do not retain water well may have recommendations for replanting with drought hardy tree species, such as ponderosa pine.
Soil Surveys include assessments of a soil’s potential for producing timber and agricultural crops. County governments use a land capability rating system to get a general idea of a soil’s suitability for different uses. For example, Soil Surveys are commonly used to determine the amount of agricultural land that can be irrigated within a county. This information is then used to zone land.
Site Index: an Estimate of Soil Productivity
Another way to estimate the soil’s productivity, which is its capacity to grow plants, is to look at the plants rather than the soil. Productivity of a soil can be measured indirectly by looking at how well plants are growing in that soil.
When this idea is applied to how well trees are growing on a site, the productivity is called site quality. The idea is that sites with the fastest growing trees have the most productive soils. Trees on sites with productive soils will be taller than trees of the same age growing on less productive soils. Site quality can be estimated by means of a site index.
The relationship between the height and age of trees on one particular site is called its site index. The site index of different forest soils is used to compare their quality. It’s important to recognize that within a forested property of any size, there will no doubt be a good deal of variety in the soil found there and its productivity. Therefore, it’s very likely that parts of your land will have different site quality.
Site Index Curves
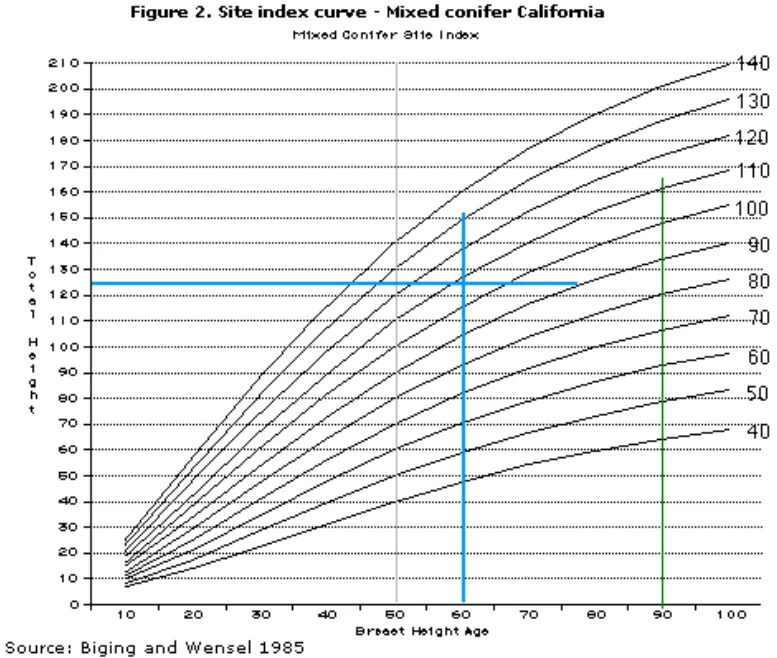
Site index information has been collected for most of the major tree species in the U.S. The productivity of different soils for one particular species is represented by means of a graph or curve.
The “site index” of a piece of property is the height of the trees there at the index age, which can be from 50 to 100 to 300 years, depending on the site index classification system used. Figure 2 is an example of site index for mixed conifers in the Sierra Nevada using 50 as the index age. The curves are for sites of different site quality and show tree height growth versus tree age.
The horizontal (X) axis is age, beginning at age 0 and ending at age 100. The vertical (Y) axis is the height of the tree. Each curve shows the height of a tree at a particular age for sites of different quality.
A site index of 140, the most productive, means that on the average, a tree 50 years old will be 140 feet tall. At the other extreme on this chart, a "site index" of 40 means that a tree 50 years old will be 40 feet tall.
Estimating Site Index
Estimating the site index for your property requires finding out how fast your trees are growing. This requires knowing how tall the trees are, how old they are, and what species they are.
It is important to choose trees that have been dominant trees during their whole lifetime. This is because trees which have been overtopped by others will have slower growth and therefore, be shorter for their age than the dominant trees in the stand. Dominant trees have live crowns that receive full sunlight from above, and partial sunlight from the sides.
The age of a tree can be established fairly accurately because trees put on one new ring of diameter growth every year. When a tree is cut down, it is easy to count the rings on the stump and estimate its age. However, with a living tree, a special instrument must be used to count the rings. The instrument, known as an increment borer is used to drill a very small hole in the tree trunk and remove a section of its core. This core contains tree rings which can be counted to give the tree’s age.
The site index curve you use will say if it is based on breast height age (4.5 feet above the ground) or total age. You may need to adjust the age with the following table to get the correct age for the site index curve.
Years to Reach Breast Height Age | ||||||||||
|---|---|---|---|---|---|---|---|---|---|---|
| Site Index | <40 | 40 | 50 | 60 | 70 | 80 | 90 | 100 | 110 | 120 |
| Years | 10 | 8 | 7 | 7 | 6 | 6 | 5 | 5 | 4 | 4 |
The height of the tree can be measured fairly easily. Trees can be measured from the ground with a special instrument, known as a clinometer. You can also very easily create your own tree measuring stick.
To estimate your site index, take the age of the site tree and locate it on the horizontal axis of the graph. Draw a line straight up. Then locate the height of the site tree on the vertical axis and draw a straight line across. In the example (blue lines) a 60 year old tree is 125 feet tall. By drawing the blue line you can see that the site index is just a bit less than 110. While you can adjust the site index by estimating the distance between the curves, in practice we usually take the closest site index. In this case 110.
The site index tells us that at age 50, the tree was about 110 feet tall. You can also use the curve to predict growth. If you follow along the 110 site index curve to 90 years of age (green line), you can predict that that tree will be a bit over 160 feet tall.
Estimating soil productivity - using forest floor plants
Although measuring tree growth is the best way to estimate a property’s site quality, there may be some cases in which all of a site’s trees have been removed. In these cases, the plants living on the forest floor can be used to estimate soil productivity and so, help determine the kinds of trees most suited for planting there.
Presence of specific plants give a general indication of productivity. For example, ferns indicate favorable moisture conditions, while sage brush species indicate a lack of available moisture for growth of most trees. In a few cases, the relationship between presence of forest floor plants and site index has been quantified. Table 1 is a mathematical system using an equation that has been devised for Shasta and Trinity counties. This system works because the plants included in the equation indicate specific soil and climate characteristics which are associated with a site’s productivity, or site index.
Table 1: Estimating site productivity from plant composition | |||
|---|---|---|---|
Species | Present = 1 Absent = 0 | Weight | Presence × Weight |
| Western white pine | 0 | -28 | 0 |
| Wedgeleaf ceanothus, or birchleaf or curlleaf mountain-mahogany | 0 | -16 | 0 |
| Coffeeberry or Sierra plum | 0 | -10 | 0 |
| White fir | 1 | 18 | 18 |
| Bush chinkapin or bitter cherry | 0 | 25 | 0 |
| Bracken fern | 0 | 15 | 0 |
| California black oak | 1 | 8 | 8 |
| Trail plant, fairy bells or sweet cicely | 1 | 20 | 20 |
| Pine drops, prince's pine, or false solomon seal | 0 | -20 | 0 |
| California harebell | 0 | -24 | 0 |
| Greenleaf manzanita | 1 | -20 | -20 |
| Paint brush, forest clarkia, Nuttall larkspur or Western Juniper | 0 | 18 | 0 |
| Wooly mule's ears or balsam root | 0 | 18 | 0 |
Site index = | 164 | ||
For example, presence of bracken fern, which requires a lot of moisture, implies high soil productivity since it indicates that the site has plenty of water. At the other extreme, presence of Western white pine indicates high elevation, short growing season, and therefore less productivity.
As an example, if white fir, California black oak, trail plant, and green leaf manzanita are present on the site, then:
Site index =
| Site index = | 138 (Base Site Index) |
| + 18 (White Fir) | |
| + 8 (Black Oak) | |
| + 20 (Trail Plant) | |
| -20 (Greenleaf Manzanita) | |
| = 164 |
Site Class
Site class, usually numbered in Roman numerals from I (best) to V (worst) is a grouping of site indexes used to determine among other things the tax rate for your property. It also determines whether or not it can be zoned as Timber Production Zone. In most counties it is site Site Class I to III. Site class is also used to determine which of the Forest Practice Rules may apply on your land.
Site class is a similar idea to site index, but slightly different. In general, the many different site indexes for each species have been lumped together into a series of site classes.
These site classes are known as site class I through V. The most productive sites, those capable of growing new trees the fastest, are grouped together into site class I, while the least productive are lumped into site class V.
Table 2 shows the relationship of site index at age 100 to site class for three forest types as used by the State Board of Equalization to administer the timber yield tax law.
To make things complicated, there are several different site class systems which have been set up for use in different regions. This is because some areas of the state have a much higher natural productivity for tree growth. For example, the redwood growing region along the North Coast has a mild climate combined with abundant precipitation. In this region, trees can be expected to grow as tall on the almost poorest quality sites (105-129 feet on site class IV), as on the best quality sites (114 feet or more on site class I) in mixed conifer regions such as the Sierra Nevada.
Therefore, site class should only be used to compare sites within specific regions and forest types. Or in other words, a site class I property cannot be assumed to have the same growth potential along the north coast as a site class I property in the Sierra Nevada.
While the measure of site index for your property is relatively straightforward, a determination of site class requires localized information to be factored in. Because taxes and timber harvest regulations are involved, you will need to rely on the professional judgment of your Registered Professional Forester to accurately determine your property’s site class.
Table 2: Site Index and Site Class | |||
|---|---|---|---|
Redwood Young Growth | Douglas Fir | Mixed Conifer, Ponderosa,Jeffrey Pine, True Fir | |
| Site Class | Site Index | Site Index | Site Index |
| I | 180 or more | 194 or more | 114 or more |
| II | 155-179 | 164-193 | 93 |
| III | 130-154 | 134-163 | 75-92 |
| IV | 105-129 | 103-133 | 60-74 |
| V | < 105 | < 103 | < 60 |
Definitions
| Soil | The soil is the top layer of the earth's crust where biological activity takes place |
| Soil description | A summary of the major characteristics and uses of a soil series provided in a soil survey report |
| Soil survey report | A report generated by the USDA Natural Resources Conservation Service’s free online Web Soil Survey (WSS) tool that shows the soil series in specific area and describes the soils' properties. |
| Soil productivity | The capacity of a soil to grow plants |
| Soil series | A unit of soil that consists of soils that are similar in all major profiles |