
The Fall 2020 UC Berkeley's Rausser College of Natural Resources Sponsored Project for Undergraduate Research (SPUR) project “Mapping municipal funding for police in California” continued in Spring 2021. This semester we continued our work with Mapping Black California (MBC), the Southern California-based collective that incorporates technology, data, geography, and place-based study to better understand and connect African American communities in California. Ben Satzman, lead in the Fall, was joined by Rezahn Abraha. Together they dug into the data, found additional datasets that helped us understand the changes in police funding from 2014 to 2019 in California and were able to dig into the variability of police spending across the state. Read more below, and here is the Spring 2021 Story Map: How Do California Cities Spend Money on Policing? Mapping the variability of police spending from 2014-2019 in 476 California Cities.
This semester we again met weekly and used data from 476 cities across California detailing municipal police funding in 2014 and 2019. By way of background, California has nearly 500 incorporated cities and most municipalities have their own police departments and create an annual budget determining what percentage their police department will receive. The variability in police spending across the state is quite surprising. In 2019 the average percentage of municipal budgets spent on policing is about 20%, and while some municipalities spent less than 5% of their budgets on policing, others allocated more than half of their budgets to their police departments. Per capita police spending is on average about $500, but varies largely from about $10 to well over $2,000.
We set out to see how police department spending changed from 2014 to 2019, especially in relation to population changes from that same 5-year interval. We used the California State Controller's Finance Data to find each city's total expenditures and police department expenditures from 2014 and 2019. This dataset also had information about each city's total population for these given years. We also used a feature class provided by CalTrans that had city boundary GIS data for all incorporated municipalities in California.
By dividing the police department expenditures by the total city expenditures for both 2014 and 2019, we were able to create a map showing what percentage of their municipal budgets 476 California cities were spending on policing. We were also able to visualize the percentage change in percentage police department spending and population from 2014 to 2019. Changes in police spending (and population change) were not at all consistent across the state. For example, cities that grew sometimes increased spending, but sometimes did not. Ben and Rezahn came up with a useful way of visualizing how police spending and population change co-vary (click on the map above to go to the site), and found 4 distinct trends in the cities examined:

-
Cities that increased police department (PD) spending, but saw almost no change in population (these are colored bright blue in the map);
-
Cities that saw increases in population, but experienced little or negative change in PD spending (these are bright orange in the map);
-
Cities that saw increases in both PD spending and population (these are dark brown in the map); and
-
Cities that saw little or negative change in both PD spending and population (these are cream in the map).
They then dug into southern California and the Bay Area, and selected mid-size cities that exemplified the four trends to tell more detailed stories. These included for the Bay Area: Vallejo (increased police department (PD) spending, but saw almost no change in population), San Ramon (increases in population, but experienced little or negative change in PD spending), San Francisco (increases in both PD spending and population) and South San Francisco (little or negative change in both PD spending and population); and for southern California: Inglewood (increased police department (PD) spending, but saw almost no change in population), Irvine (increases in population, but experienced little or negative change in PD spending), Palm Desert (increases in both PD spending and population), Simi Valley (little or negative change in both PD spending and population). Check out the full Story Map here, and read more about these individual cities.
The 5-year changes in municipal police department spending are challenging to predict. Cities with high population growth from 2014 to 2019 did not consistently increase percentage police department spending. Similarly, cities that experienced low or even negative population growths varied dramatically in percentage change police department spending. The maps of annual police department spending percentages and 5-year relationships allowed us to identify these complexities, and will be an important source of future exploration.
The analysts on the project were Rezahn Abraha, a UC Berkeley Conservation and Resource Studies Major, and Ben Satzman, a UC Berkeley Conservation and Resource Studies Major with minors in Sustainable Environmental Design and GIS. Both worked in collaboration with MBC and the Kellylab to find, clean, visualize, and analyze statewide data. Personnel involved in the project are: from Mapping Black California - Candice Mays (Partnership Lead), Paulette Brown-Hinds (Director), Stephanie Williams (Exec Editor, Content Lead), and Chuck Bibbs (Maps and Data Lead); from the Kellylab: Maggi Kelly (Professor and CE Specialist), Chippie Kislik (Graduate Student), Christine Wilkinson (Graduate Student), and Annie Taylor (Graduate Student).
We thank the Rausser College of Natural Resources who funded this effort.
Fall 2020 Story Map: Mapping Police Spending in California Cities. Examine Southern California and the Bay Area in detail, check out a few interesting cities, or search for a city and click on it to see just how much they spent on policing in 2017.
Spring 2021 Story Map: How Do California Cities Spend Money on Policing? Mapping the variability of police spending from 2014-2019 in 476 California Cities.

In September 2020, UC Berkeley’s Rausser College of Natural Resources selected the Kellylab for a Sponsored Project for Undergraduate Research (SPUR) project for their proposal entitled “Mapping municipal funding for police in California.” The project partnered with Mapping Black California (MBC), the Southern California-based collective that incorporates technology, data, geography, and place-based study to better understand and connect African American communities in California. We met weekly during the fall semester and gathered data from 472 cities across California, detailing the per-capita police funding and percent of municipal budget that is spent on police departments. California has nearly 500 incorporated cities and most municipalities have their own police departments and create an annual budget determining what percentage their police department will receive. The variability in police spending across the state is quite surprising - check out the figures below. The average percentage of municipal budgets spent on policing is about 20%, and while some municipalities spent less than 5% of their budgets on policing, others allocated more than half of their budgets to their police departments. Per capita police spending is on average about $500, but varies largely from about $10 to well over $2,000. If you are interested in this project, explore our findings through the Story Map: examine Southern California and the Bay Area in detail, check out a few interesting cities, or search for a city and click on it to see just how much they spent on policing in 2017.
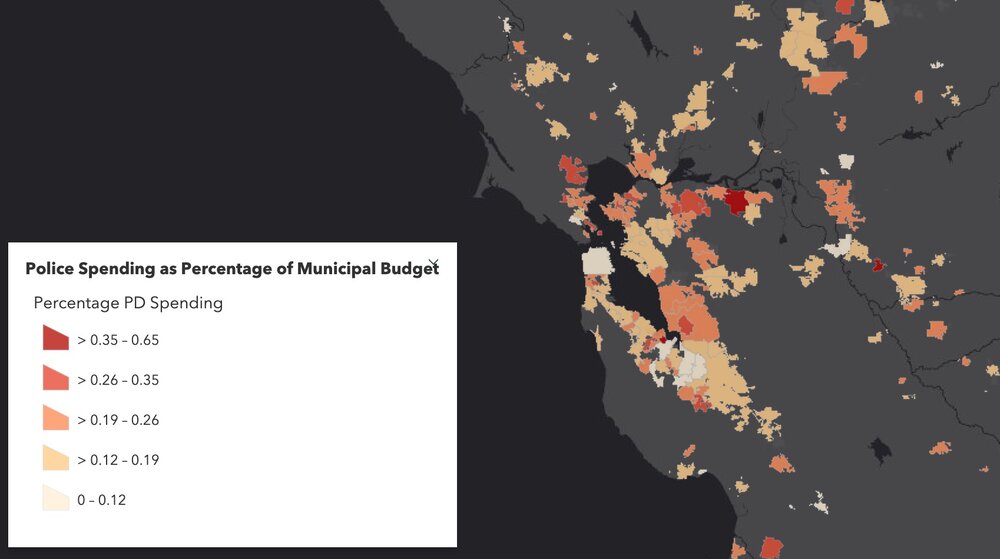
Figure showing variability in Police Spending (% of municipal budget) in Northern California in 2017. Data from California State Controller's Cities Finances Data, 2017 (City and police spending information). For more information see the Story Map here.
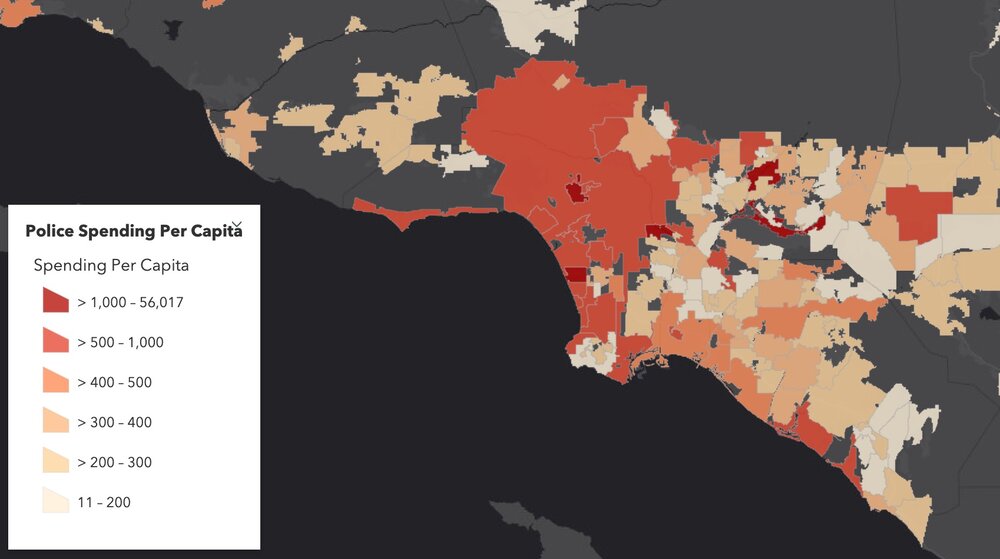
Figure showing variability in Police Spending (PEr capita) in Northern California in 2017. Data from California State Controller's Cities Finances Data, 2017 (City and police spending information). For more information see the Story Map here.
The analyst on the project has been Ben Satzman, a UC Berkeley Conservation and Resource Studies Major with minors in Sustainable Environmental Design and GIS, who worked in collaboration with MBC and the Kellylab to find, clean, visualize, and analyze statewide data. We plan on continuing the project to explore the possible influences (such as racial diversity, crime, poverty, ethnicity, income, and education) underlying these regional trends and patterns in police spending. Personnel involved in the project are: from Mapping Black California - Candice Mays (Partnership Lead), Paulette Brown-Hinds (Director), Stephanie Williams (Exec Editor, Content Lead), and Chuck Bibbs (Maps and Data Lead); from the Kellylab: Maggi Kelly (Professor and CE Specialist), Chippie Kislik (Graduate Student), Christine Wilkinson (Graduate Student), and Annie Taylor (Graduate Student).
We thank the Rausser College of Natural Resources who funded this effort.

My usual update from ESRI UC is a bit tougher this year, since I am working from home, and on one screen. So note taking is a bit rough. And I kind of miss the whole razz-ma-tazz of Day 1 on site. But here goes:
OK, so Jack’s Plenary is the always place to get a big view of new releases in software. 2020 is no different. A sweep of the software improvements coming this summer. Here is my (very) quick summary of highlights. Items with ‘*’ are those that will be useful in class (I hope).
The Conference Theme is Collaboration
What’s coming in ArcGIS Pro and AGOL:
Data:
New layers
Better integration with OSM*
Visualization (New Map Apps* - launching this fall):
Beta now in AGOL
Better styling, better color ramps, and better dynamic interaction with color ramp *
Dot density mapping!
Clustering and new labeling
Filtering data
Some cool color blending as an alternative to transparency! *
Cartography in Pro:
Charts
Story Maps
Optimize for mobile
Collections
StoryTeller role
Spatial Analytics and Data Science
New suitability modeling tool *
Spider diagrams
Modeling
AI, Big Data, ML
Jupyter Notebooks inside of ArcGIS Pro *
AGOL implementing Jupyter Notebooks
Imagery and Remote Sensing
Image management - ready to use workflows and content
Feature extraction
Analytics - classification, etc.
Something called “Excalibur” - web-based exploitation. Search and find, feature extraction, add to a database
Drone Mapping *
Drone2Map on desktop
Site Scan - cloud-based solutions
3D Mapping
Jack loves voxels
Real-time Analytics
Cloud-based sensor data storage and management
Data Management
Improving editing: 2D and 3D editing improvements *
Field Maps App
In beta, and should streamline things.
And Enterprise runs on kubernetes…
All leading up to ArcGIS 2021 next year.
OK deep breath, off for a lunch break.

Every fall I ask my GIS students to answer the big questions in advance of their class projects. This year climate change, wildlife conservation, land use and water quality are important, as well as a number of other topics. Remote sensing continues to be important to GISers. Scientists, government and communities need to work together to solve problems.
Why?
- What does the proposed project hope to accomplish?
- What is the problem that needs to be addressed?
- What do you expect to happen?
How?
- What analysis approach will be used?
- Why was this approach selected?
- What are alternative methods?
- Is the analysis reproducible?
What?
- What are the datasets that are needed?
- Where will they come from?
- Have you downloaded and checked this dataset?
- Do you have a backup dataset?
Who?
- Who will care about this? And why?
- How will they use the results?
- Will they be involved in the entire workflow?
Here are the responses from Fall 2017:


So much to learn! Here is my distillation of the main take-homes from last week.
Notes about the workshop in general:
- Making participants do organized homework and install software is necessary for complicated workshop content: http://neondataskills.org/workshop-event/NEON-Data-Insitute-2017
- NEON used tips from software carpentry workshops, particularly the green-and-pink sticky tag tip. When you put up a pink sticky on your computer, you need help; when you put up a green sticky on your computer, you are all good. This makes everything go smoother and means participants don't have to hold up their hand to get attention.
- Having lots of helpful, friendly faces around to help during the coding bits, and having access to the code when you got behind was critical.
- The workshop content and daily schedule:
NEON data and resources:
- http://www.neonscience.org/resources/data-tutorials
- All the NEON airborne data can be found here: http://www.neonscience.org/data/airborne-data
- For more on when data rolls out, sign up for the NEON eNews here: http://www.neonscience.org/
Other misc. tools:
- For cleaning messy data - check out OpenRefine - a FOS tool for cleaning messy data http://openrefine.org/
- Excel is cray-cray, best practices for spreadsheets: http://www.datacarpentry.org/spreadsheet-ecology-lesson/
- Morpho (from DataOne) to enter metadata: https://www.dataone.org/software-tools/morpho
- Pay attention to file size with your git repositories - check out: https://git-lfs.github.com/. Git is good for things you do with your hands (like code), not for large data.
- Markdown renderer: http://dillinger.io/
- MIT License, like Creative Commons for code: https://opensource.org/licenses/MIT
- There is a new project called "Feather" that allows compatibility between python and R: https://blog.rstudio.org/2016/03/29/feather/
- All the NEON airborne data can be found here: http://www.neonscience.org/data/airborne-data
- Information on the TIFF specification and TIFF tags here: http://awaresystems.be/, however their TIFF Tag Viewer is only for windows.
- All NEON point cloud classifications are done with LASTools. Go LASTools! https://rapidlasso.com/lastools/
- Check out pdal - like gdal for point clouds. It can be used from bash. Learned from my workshop neighbor Sergio Marconi https://www.pdal.io/
- Reflectance Tarps are made by GroupVIII http://www.group8tech.com/
- ATCOR http://www.rese.ch/products/atcor/ says we should be able to rely on 3-5% error on reflectance when atmospheric correction is done correctly (say that 10 times fast) with a well-calibrated instrument.
- NEON hyperspectral data is stored in HDF5 format. HDFView is a great tool for interrogating the metadata, among other things. https://support.hdfgroup.org/products/java/hdfview/

